U.S. stocks ended the week lower, breaking a two-week winning streak, as escalating tensions in the Middle East and a sharp rise in oil prices overshadowed otherwise positive economic data and trade developments. The S&P 500 finished down for the week, while the Dow Jones Industrial Average and the NASDAQ also posted losses.
Key Drivers
Geopolitical Tensions: Markets were rattled late in the week by news of Israeli airstrikes on Iranian nuclear facilities, followed by Iranian retaliation. This escalation drove a risk-off sentiment, with equities selling off sharply on Friday and oil prices surging to their highest level in four months.
Oil Prices: U.S. crude oil closed the week up sharply, as traders priced in the risk of supply disruptions and renewed inflationary pressures.
Inflation Data: The Consumer Price Index for May rose less than expected, and annual inflation held near a four-year low. Producer Price Index data was also cooler than forecast, reinforcing expectations that inflation is moderating.
Interest Rates and Bonds: Treasury yields declined as investors sought safety in government bonds. A strong auction for long-term Treasuries further eased concerns about U.S. debt supply.
Trade Developments: Early in the week, sentiment was buoyed by progress in U.S.-China trade talks, with both sides agreeing to a framework that could ease recent tariff tensions. This helped lift stocks before geopolitical headlines reversed gains.
Sector Performance
Leaders: Energy stocks outperformed, benefiting from the spike in oil prices. Consumer durables and health technology also showed relative strength.
Laggards: Commercial services, retail trade, and transportation sectors lagged, reflecting broader risk aversion and concerns about global growth.
Other Markets
Global Equities: International developed markets rose for the week, while U.S. small- and mid-cap indexes underperformed.
Crypto: Bitcoin saw significant volatility, briefly trading above the $110,000 mark before pulling back.
Economic Data Highlights
Labor Market: Initial jobless claims were steady, slightly above expectations, with continuing claims rising, suggesting a cooling but still resilient labor market.
Business and Consumer Sentiment: Small business optimism and consumer sentiment both improved, indicating some recovery in confidence.
Looking Ahead
The focus will be on upcoming retail sales data and the Federal Reserve meeting for further clues on the economic outlook and the timing of potential rate cuts.
In summary, the week was marked by a sharp reversal in risk appetite due to geopolitical shocks, with energy outperforming and safe havens in demand. Despite the volatility, inflation data remained benign, supporting the case for eventual Fed rate cuts later in the year.
Key Economic Events for the Week
This week is highlighted by the Federal Reserve’s policy decision, fresh retail sales data, and important housing and industrial production reports. U.S. markets will be closed on Thursday, June 19, in observance of Juneteenth.
Monday, June 16
Empire State Manufacturing Index (June, 8:30 am ET)
Provides an early read on manufacturing activity in New York State.
Tuesday, June 17
Retail Sales (May, 8:30 am ET)
Closely watched for signals on consumer spending. Economists expect flat or slightly negative growth, with weak auto sales dragging down the headline figure, while the control group (excluding autos and other volatile categories) may show a modest gain.
Import Prices (May, 8:30 am ET)
Offers insight into inflation pressures from imported goods.
Capacity Utilization Rate (May, 9:15 am ET)
Measures the extent to which U.S. industrial capacity is being used.
Industrial Production (May, 9:15 am ET)
Indicates output from manufacturing, mining, and utilities. A modest gain is expected after a flat prior month.
Business Inventories (April, 10:00 am ET)
Reflects inventory levels in the supply chain.
NAHB Housing Market Index (June, 10:00 am ET)
Gauges homebuilder sentiment, an early indicator for the housing sector.
Wednesday, June 18
Housing Starts & Building Permits (May, 8:30 am ET)
Measures new residential construction activity and future supply.
Weekly Initial & Continued Jobless Claims (for week ending June 14, 8:30 am ET)
Provides a timely update on labor market conditions.
The Fed is expected to keep rates unchanged. Markets will focus on the updated "dot plot" for clues on the timing and number of potential rate cuts later in 2025, as well as Powell’s comments on inflation and growth.
EIA Weekly Petroleum Status Report
Tracks U.S. oil inventories and production, relevant for energy markets.
Thursday, June 19
Juneteenth National Independence Day
U.S. financial markets closed.
Friday, June 20
No major economic data releases scheduled due to the holiday-shortened week.
Key Takeaway: The week’s highlights are the Fed’s policy decision and press conference, the May retail sales report, and housing starts data. These will be closely watched for signals on the direction of monetary policy, consumer strength, and the state of the housing market. Markets may be quieter than usual due to the Juneteenth holiday.
Market Themes
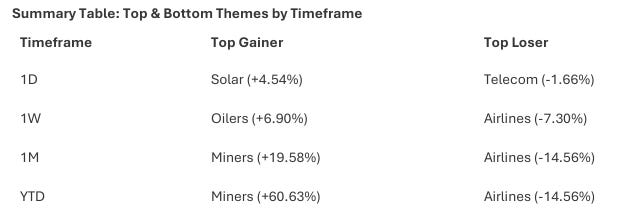
Observation: Miners have been the standout YTD, with a massive +60.63% gain, indicating a (possible) strong commodities supercycle or supply/demand imbalance. Aerospace, Blockchain, and Social Media have also performed well, suggesting risk-on sentiment in certain innovative or cyclical sectors. Airlines, Home Construction, and Oilers are the biggest laggards, likely reflecting ongoing sector-specific challenges.
Key Takeaways
Commodities and Cyclicals: Miners, Oilers, and Energy themes have led over multiple timeframes, especially YTD and 1M, pointing to robust demand for commodities and cyclicals.
Growth and Innovation: Genomics, Biotechnology, and Blockchain have shown strong momentum, particularly in the past month, indicating renewed interest in growth and innovation themes.
Sector Weakness: Airlines and Home Construction have consistently underperformed across all timeframes, highlighting persistent sectoral headwinds.
Short-term vs. Long-term Trends: While Solar and Genomics led in the short term (1D), Miners and Aerospace dominate the longer-term (YTD) performance.
Strategic Implications for Swing Traders
Momentum Plays: Consider focusing on Miners, Aerospace, and Blockchain for continued momentum, but be wary of overextension after large YTD gains.
Contrarian Opportunities: Look for potential bottoming or reversal setups in lagging sectors like Airlines and Home Construction, but only with clear technical confirmation.
Rotation Awareness: The strong weekly performance in Oilers and Energy suggests ongoing sector rotation—monitor for confirmation or reversal.
Conclusion: The market is currently favoring commodities, innovation, and select cyclicals, while defensive and rate-sensitive sectors are underperforming. Swing traders should align strategies with prevailing momentum but remain alert to rotation signals and potential reversals in oversold sectors.
Thanks for reading Phatinfantry’s Substack! Subscribe for free to receive new posts and support my work.
Market Carpet for the week
S&P 500 Heatmap Summary: Notable Stocks and Sector Standouts
Market Sentiment and Rotation
The market is showing sector rotation, with strong moves in select tech (ORCL, TSLA), health care (LLY), and energy (XOM), while traditional defensives (consumer staples, some financials) and megacap tech (AAPL, META) lag.
The overall tone is mixed, with pockets of strength and weakness, suggesting traders are being selective and possibly repositioning after recent market moves.
Swing Trading Takeaways
Momentum opportunities: Oracle, Tesla, Eli Lilly, and ExxonMobil are showing strong momentum and could be candidates for continued swing trades if trends persist.
Caution on laggards: Apple, Meta, and Walmart are underperforming and may face continued selling pressure.
Watch for reversals: The divergence in sector performance suggests potential for mean reversion trades, especially in sectors that have been heavily sold.
Conclusion
The S&P 500 over the past week has been characterized by significant dispersion—select large caps are driving gains in their sectors, while others are seeing notable declines. This environment favors active traders who can identify and capitalize on sector and stock-specific momentum and reversals.
Market Sentiment from Friday…
Market Sentiment Analysis (as of June 13, 2025)
Volatility Index ($VIX):
Last: 20.82
Change: +2.80
The VIX has spiked significantly, up 2.80 points to 20.82. This level suggests heightened market uncertainty and increased demand for options protection. A VIX above 20 often signals investor anxiety and potential for larger price swings.
Put/Call Ratios:
The total put/call ratio at 0.89 is slightly below 1, indicating more call (bullish) than put (bearish) activity, but not at an extreme.
The equity-only put/call ratio at 0.61 is low, showing a bullish bias among retail traders, as they are buying more calls than puts.
The index-only put/call ratio at 1.03, while slightly above 1, actually declined on the day, suggesting some hedging activity but not at a panic level.
NAAIM Exposure Index:
Last: 82.66 (no change)
Active managers remain heavily invested in equities, with exposure well above the neutral 50 level. This indicates institutional confidence in the market's direction.
Rydex Asset Ratio (Bear+MM - Bull):
Last: 0.08 (no change)
This very low reading signals that Rydex mutual fund investors remain heavily allocated to bullish funds, with little interest in bearish or money market positions. This is often seen as a sign of complacency.
AAII Bulls - Bears:
Last: 3.10 (no change)
A wide spread between bulls and bears in the AAII survey (3.10) shows strong retail bullish sentiment. Such high readings can sometimes precede market pullbacks, as excessive optimism may signal overextension.
Key Takeaways
Sentiment is very bullish among both retail and institutional investors, as shown by low put/call ratios, high NAAIM exposure, and a wide AAII bull-bear spread.
Volatility has jumped, suggesting underlying concerns or a reaction to recent market events, despite the bullish positioning.
Complacency risk: The Rydex ratio and AAII spread show little fear among traders, which can sometimes precede corrections.
Contrarian signal: Extreme bullish sentiment, combined with a rising VIX, may indicate the market is vulnerable to a short-term pullback or increased volatility.
For swing traders: While the overall sentiment is bullish, the spike in volatility and extreme optimism are classic warning signs of a potential near-term reversal or correction. Consider tightening stops and watching for confirmation of a trend change before increasing long exposure.
Market Breadth
Key Takeaways
Market Breadth is Strong in Large Caps: Both NYSE and S&P 500 A/D lines are at or near highs, confirming broad participation among large caps.
Mid Caps Recovering: Mid cap breadth is improving, but not as strong as large caps.
Small Caps Lag: The small-cap A/D line is still in a downtrend, showing a lack of broad, risk-on participation.
Overall Health: The market rally is supported by strong breadth in larger stocks, but a sustained, healthy bull market would benefit from stronger participation by mid and small caps.
Conclusion: Breadth indicators suggest the current rally is robust among large caps, but risk appetite is not fully broad-based until small caps break their downtrend and resistance. Watch for improvement in the small-cap A/D line for confirmation of a more inclusive market advance.
Psych Charts of note:
S&P 500 Bullish percent index Green Circles: When we don’t return to the 50 level and reclaim 70 as we did here, the next dip below 70 can be a doozy. It’s not time to worry yet, but I’ll be off the wall when that happens…
Nasdaq Bullish Percent Index, seen below is still working its way there. I’ll alert when/if it does…
MMTW… Stocks above their 20-day moving average. As you can see, my handy dandy indicator is red…
No arguing with the NYMO McClellan Oscillator… I don’t make the rules…
SPY…
SPY Daily Chart Analysis (as of June 13, 2025)
Overview
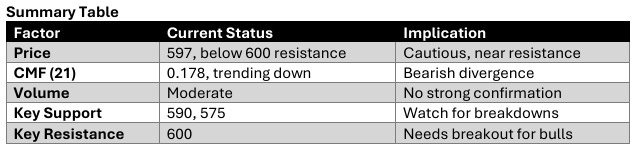
SPY closed at 597.00, down 1.12% on the day, with notable volume (89.3M).
Price Action & Structure
SPY has been in a strong uptrend since early 2024, making higher highs until it peaked near the 610 level.
The 600 level (marked in purple) is a major psychological and technical resistance; price has struggled to sustain above it.
Recent price action shows a failed breakout above 600, followed by a pullback and a retest of the 595-600 zone.
Multiple horizontal support/resistance levels are marked:
Resistance: 600, 590, 575
Support: 555, 535, 515
Volume
Volume spikes are visible during sharp corrections and rebounds, especially during the March-April 2025 correction, suggesting institutional activity.
Recent sessions show moderate volume, not confirming a strong bullish reversal after the latest pullback.
Chaikin Money Flow (CMF) Analysis
The CMF(21) is currently positive (0.178), but the indicator has been trending down since late May, as highlighted by the red arrow.
Historically, each marked CMF downtrend (red arrows) has often preceded or coincided with significant pullbacks or corrections in SPY.
The latest CMF downtrend suggests waning buying pressure and possible distribution, even as price holds near highs.
Key Observations
Negative Divergence: Price is near all-time highs, but CMF is trending lower, indicating less conviction behind the rally and potential for a deeper pullback.
Support Zones: Immediate support lies at 590 and 575. A break below these could trigger further downside toward 555 or even 535.
Resistance: The 600 level remains a formidable ceiling. Sustained closes above this would be needed to resume the uptrend.
Volume Confirmation: Lack of strong volume on the recent bounce raises caution for swing traders looking for confirmation of a new leg up.
Swing Trade Implications
Caution is warranted near these levels due to negative money flow divergence and repeated failure at 600.
Watch for a break below 590 for potential short setups, targeting 575 or lower.
Bulls need to see a reversal in CMF and a decisive close above 600 with volume for renewed confidence in the uptrend.
Conclusion
SPY is at a critical juncture: price is consolidating just below major resistance, but underlying money flow is weakening. Swing traders should be alert for potential breakdowns if support fails, or wait for stronger confirmation before entering new long positions.
SPY chart with Deepvue market trend analysis
The Sam Weinstein stage analysis is currently in Stage 2 and we are above the key and rising moving averages of 10/20/50 so the Deepvue Market Trend is green. Although it is close to price dropping below the 10…
Weekly- Relative Rotation Graph (RRG)
Highlights:
Technology (XLK) leads with a +9.91% gain, confirming its strong move in the improving quadrant.
Energy (XLE), Communication Services (XLC), Industrials (XLI), and Consumer Discretionary (XLY) also outperform SPY.
Defensive sectors (XLP, XLU, XLRE, XLF) lag, with minimal gains.
Sector Rotation Implications
Bullish Sectors: Technology (XLK) is regaining leadership, and Industrials (XLI) and Materials (XLB) are currently the strongest sectors. Although (XLB) is in danger of crossing into the lagging zone.
Caution: Communication Services (XLC) and Financials (XLF) are losing momentum; defensive sectors are underperforming.
Potential Turnarounds: Consumer Discretionary (XLY) is improving; watch for further momentum gains.
Avoid: Energy (XLE) and Health Care (XLV) remain weak, despite short-term price gains.
Swing Trading Takeaways
Favor sectors in the Leading and Improving quadrants (XLK, XLI, XLB, XLY). With the exception of (XLB) if we see a cross into the lagging quadrant.
Be cautious or avoid sectors in Lagging (XLE, XLV) and Weakening (XLC, XLF, XLRE) unless reversal signals appear.
Monitor Technology for continued leadership, as it shows both strong price and improving relative strength.
This RRG analysis suggests a market environment favoring cyclical and growth sectors, with defensive sectors losing favor. For swing trading, focus on momentum in the leading and improving quadrants and be alert for sector rotation signals. Obviously world events can affect this analysis in a news driven environment that we are in. However, dip buys would occur in the, leading and improving quadrants like (XLK, XLI, XLB, XLY).
Key Ratios from Friday…
Key Takeaways
Mixed Signals: The standard Discretionary vs. Staples ratio (XLY:XLP) is slightly positive, suggesting some risk-on appetite, but the equal-weight version (RSPD:RSPS) is negative, indicating that the move is concentrated in larger stocks, not broad-based.
Defensive Rotation: Most other ratios (Tech vs. Utilities, Biotech vs. Health Care, Hotels vs. Utilities) are negative, showing outperformance of defensive sectors. The sharpest move is in Hotels vs. Utilities (-2.26%), a strong risk-off signal.
Sector Leadership: Utilities and Staples are outperforming their cyclical counterparts, indicating traders are seeking safety and lower volatility sectors.
Market Sentiment
Overall, the data points to a defensive market posture on June 13, 2025. While there is a slight tilt toward risk in large-cap discretionary, the broader and more pronounced moves are into defensive sectors, suggesting caution among investors and a preference for stability over growth. This could be in response to macroeconomic uncertainty, earnings concerns, or geopolitical risks.
Swing traders may find better risk/reward setups in defensive sectors or by shorting cyclical sector rallies until a clearer risk-on trend emerges.
Before we look further at the S&P 500 sectors, let’s look at the offensive versus defensive chart below…
Market Sentiment Implications
Risk Appetite: Both ratios show that risk appetite peaked in early 2025 and then reversed sharply. The subsequent rebounds off support indicate some stabilization, but neither ratio has convincingly broken out above key resistance levels.
Swing Trading Context: For swing traders, these ratios suggest a market in transition. The initial risk-off move has paused, but risk-on leadership is not yet confirmed. Watch for decisive moves above resistance (2.65 for XLY:XLP, 1.80 for RSPD:RSPS) for confirmation of renewed bullish sentiment.
Relative Strength: The fact that both cap-weighted and equal-weighted ratios are showing similar patterns adds confidence to the signal.
Conclusion: Both risk-on/risk-off ratios have stabilized after a sharp risk-off move, but neither has broken out to new highs. The market is in a wait-and-see mode regarding risk appetite. Swing traders should monitor these levels closely for confirmation of the next directional move.
Growth versus Spy
Bottom Line: Both discretionary vs. staples ratios show a loss of momentum after a risk-off reversal in early 2025. The current sideways action near support/resistance suggests indecision. Swing traders should watch these ratios for a decisive breakout or breakdown to gauge the next major move in sector leadership and market risk appetite. Be patient…
Growth versus SPY
Key Takeaways
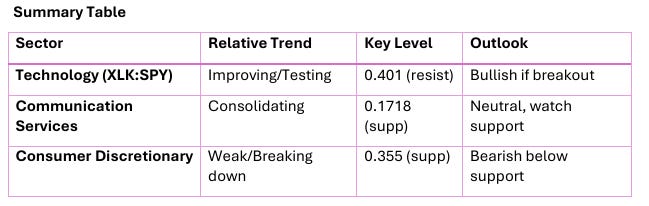
Technology is on the verge of resuming leadership if it can break above resistance.
Communication Services are at a decision point; holding support is crucial for continued outperformance.
Consumer Discretionary is the weakest of the three, breaking down and likely to underperform unless it regains support.
For swing trading, focus on tech for potential leadership, be cautious with communication services, and avoid or consider short opportunities in consumer discretionary until the trend reverses.
Value versus SPY
Key Takeaways
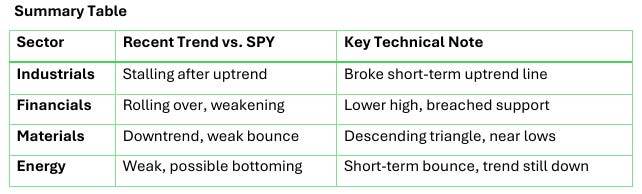
Leadership Rotation: Industrials have been leading but are now showing signs of exhaustion. Financials and Materials are both weakening, while Energy remains the laggard but is showing tentative signs of stabilization.
Sector Caution: The broad trend across cyclicals (Industrials, Financials, Materials, Energy) is one of waning momentum relative to the S&P 500. This could indicate a shift in market leadership or a broader risk-off environment.
Watch for Confirmation: For swing traders, confirmation of breakdowns (for Industrials, Financials, Materials) or a sustained reversal in Energy will be important signals for sector allocation in the coming weeks.
The chart suggests a cautious stance on cyclicals, with close monitoring needed for any sustained change in trend, especially in Energy, which could be forming a base.
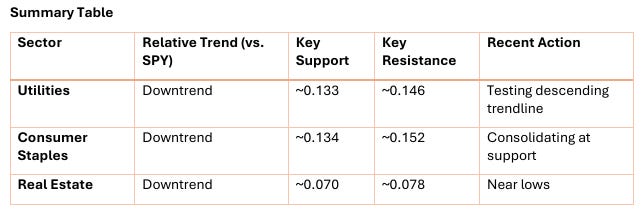
Defensive versus SPY
Key Takeaways
All three defensive sectors are underperforming the S&P 500, with each ratio chart in or near a downtrend and testing key support levels.
No clear evidence of defensive rotation: Typically, outperformance in these sectors signals risk-off sentiment, but current weakness suggests continued risk appetite in the broader market.
Watch support levels: A break below current support in any of these ratios would confirm further sector underperformance. Conversely, a bounce could signal a shift toward defensive positioning.
This analysis suggests that, as of mid-June 2025, market participants are favoring risk-on sectors over defensives, with no current signs of a defensive bid emerging in Utilities, Consumer Staples, or Real Estate. Watch XLU as a potential defensive leader if we break upside the descending trendline.
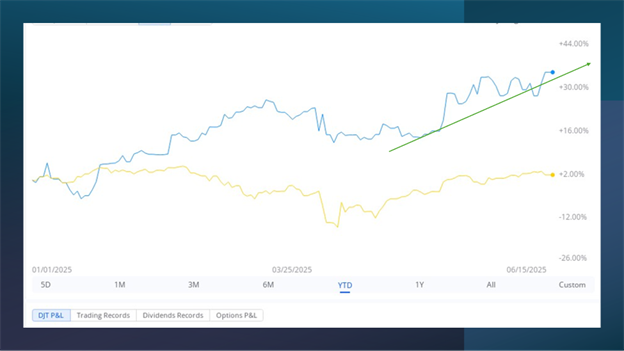
Thoughts this week:I faced my biggest loss of the year on Tuesday, but I stayed disciplined—cut my losses quickly and avoided bag holding. After regrouping, I came back strong, finished the week on a high note, and closed at new year-to-date highs.
You can do it, keep studying!
Stock Talk Insiders discord
Stock Talk Insiders discord If you like this Phat-plan, and you would like to receive alerts for my trades, click the link for the discord and enter the promo code: PHAT to get 10% off all packages for life...