
Phat Swing Plans and Observations
For the week of 1/5/26


U.S. equities had a choppy, holiday‑shortened week, with major indexes essentially flat to slightly lower and leadership rotating away from mega‑cap tech toward cyclicals and semis, while bonds and Fed expectations took their cue from an upcoming heavy jobs-data calendar.
Index performance
The S&P 500 slipped roughly 1% for the week in a giveback after recent record highs, though it remains up more than 16% over the past year.
The Dow Jones Industrial Average was the relative winner, eking out about a 0.6% weekly gain, helped by industrials and financials.
The Nasdaq Composite lagged, ending roughly flat to modestly negative as some “Magnificent 7” names saw profit‑taking while semiconductors outperformed.
Macro and Fed backdrop
The week was thin on data, but jobless claims remained contained and continuing claims hovered near 1.8 million, keeping recession odds in check but not eliminating slowdown concerns.
The big focus is the first full week of 2026, with ADP, Challenger layoffs, JOLTS, ISM, and especially Friday’s December nonfarm payrolls expected to show slower hiring and a slight dip in unemployment.
Fed funds futures still price a high probability that the Fed holds rates steady at the late‑January meeting, with cuts more a mid‑year story, and markets are also watching Trump’s pending pick to replace Chair Powell when his term ends in May.
Sectors, commodities, and flows
Leadership rotated toward cyclicals: industrials and financials were firm, while parts of tech, especially crowded mega‑caps, saw some de‑risking after strong 2025 gains.
Commodities cooled after a multi‑week run; silver dropped more than 6% on the week, though still trades above 70, and gold saw volatility tied to Iran‑Venezuela tensions and sanctions headlines.
Year‑end flows showed 2025 closing with the S&P 500 up about 16% and the Nasdaq up over 20%, reinforcing how extended large‑cap growth is relative to historical norms heading into 2026.


I posted this pic several weeks ago, and it appears to be still in play…
Geopolitics and headline risk
Markets digested additional U.S. sanctions targeting Iran’s drone trade with Venezuela and ongoing Russia‑Ukraine developments, including positive rhetoric around a Ukrainian peace plan; risk assets mostly shrugged but gold/silver reacted intraday.
A 43‑day U.S. government shutdown that ran through October and part of November is now in the rear‑view, but investors remain sensitive to any new fiscal or political shocks in an election‑aftermath environment.
Investors are also watching for any hints from the White House about Fed leadership and regulatory priorities, which could become a narrative driver for financials and rate‑sensitive sectors.
Trading takeaways for the week
Short term, breadth is improving modestly as leadership broadens beyond the largest tech names, but the index‑level tape is tired after a strong year and a failed Santa‑Claus rally.
The upcoming jobs and ISM data, plus the start of bank earnings in about two weeks, are likely catalysts for a volatility pick‑up; swings around rate‑cut odds should create mean‑reversion and range‑trading setups in index and sector ETFs.
Given stretched 12‑month returns and rising macro event risk, many swing traders are favoring defined‑risk positions, staggered entries, and quicker profit‑taking until there is clearer confirmation of either a January breakout or a deeper pullback.
The StockCharts Technical Rank (SCTR)
Proprietary ranking score (0-100) by Stockcharts.com that evaluates a stock or ETF’s technical strength compared to its peers, using a blend of multiple timeframes and momentum metrics.
Interpretation and Use
Top 10%: SCTR scores 90–100 indicate strong technical leaders.
Middle Range: Scores between 40–60 represent average technical strength.
Bottom 10%: Scores 0–10 indicate technical laggards.
Scores above 60 generally signal relative technical strength, while scores below 40 highlight weakness.
SCTR is best used for peer comparisons and screening for momentum, rather than as a standalone trading/signal tool.
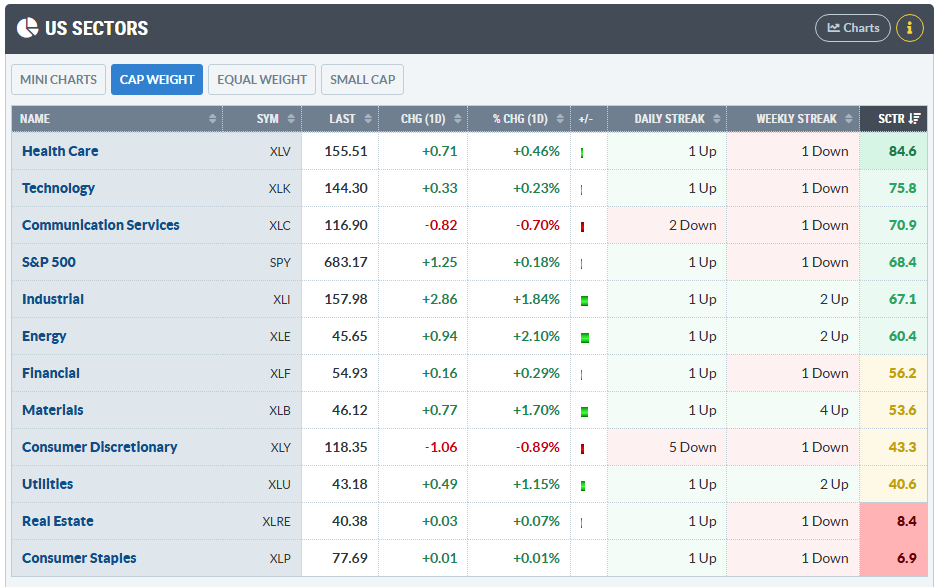
Health care has taken back the lead from Tech… We continue to see them flip flop as leaders over the past two months.
Major Economic Events
For the coming week (Jan 5–9), the key drivers are U.S. labor data, ISM PMIs, and global inflation/PMI prints that will shape rate‑cut expectations and risk sentiment.
Big U.S. releases
ISM Manufacturing PMI (Mon, Jan 5, 10:00 ET) – Final December read; markets are watching whether activity stays near the 50-expansion line.
ISM Services / S&P PMIs (Tue, Jan 6, 9:45–10:00 ET) – Final December services and composite PMIs, important for gauging broader growth momentum.
ADP Employment (Wed, Jan 7, 8:15 ET) – December private payrolls, a pre‑signal for Friday’s jobs report.
JOLTS job openings (Wed, Jan 7, 10:00 ET) – November vacancies, closely watched for labor‑market cooling.
Weekly jobless claims (Thu, Jan 8, 8:30 ET) – Initial and continuing claims as a high‑frequency check on layoffs.
December Employment Situation / NFP (Fri, Jan 9, 8:30 ET) – Consensus looks for ~55k payroll gain and unemployment around 4.5%; this is the week’s anchor event.
U. Michigan Consumer Sentiment (Fri, Jan 9, 10:00 ET) – Preliminary January confidence and inflation expectations.
Other notable U.S. data
Factory orders, durable goods, and trade data (mostly October catch‑up) fill in the Q4 growth picture, alongside housing starts and building permits.
Several Fed officials are scheduled to speak during the week, giving fresh color on the 2026 rate‑cut path after the late‑2025 easing.
Key global events
Eurozone & major economies: December inflation prints (CPI) and unemployment, plus manufacturing gauges from Germany and Switzerland, will drive ECB‑cut timing expectations.
China: PMI results and inflation data (CPI/PPI) for December are in focus as markets gauge the strength of any late‑year stabilization.
India & Southeast Asia: India’s FY26 GDP estimates, Indonesia trade, and Philippines/Australia inflation and activity data round out EM growth signals.
Earnings and events to watch
Early‑season conferences include a Bank of America software bus tour and a Goldman Sachs energy/cleantech/utilities conference (Jan 5–7), which can move sector leaders even before the main earnings season.
The main U.S. Q4 earnings ramp (e.g., big banks) begins the following week, but pre‑announcements and guidance commentary may start to trickle in.
Key earnings for the week
Earnings season is still light this week (Jan 5–9, 2026), with the focus on a handful of consumer, industrial, cannabis/beer, and rail/transport names rather than the big banks or megacaps.
Headline names by day
Tue, Jan 6
AngioDynamics (ANGO) before open.
AAR Corp. (AIR) and Penguin Solutions (PENG) after close.
Wed, Jan 7
Grocery/consumer: Albertsons (ACI), Apogee Enterprises (APOG), Cal‑Maine Foods (CALM), UniFirst (UNF) before open.
After close: Constellation Brands (STZ), Jefferies (JEF), PriceSmart (PSMT), AZZ (AZZ), Applied Digital (APLD) and several smaller caps.
Thu, Jan 8
Before open: Acuity Brands (AYI), Commercial Metals (CMC), Helen of Troy (HELE), Lindsay (LNN), Neogen (NEOG), RPM International (RPM), Simply Good Foods (SMPL), TD Synnex (SNX).
After close: Greenbrier (GBX) and WD‑40 (WDFC) among the more watched mid‑caps.
Fri, Jan 9
Conagra Brands (CAG), Lamb Weston (LW), Paychex (PAYX), Winnebago (WGO) report, giving reads on packaged food, frozen potatoes, payroll/SMB, and RV demand.
Sector reads traders care about
Beverage / cannabis / consumer: Constellation Brands (STZ) on Wed and Tilray Brands (TLRY) on Thu (also tied to Trump’s cannabis reclassification) will be closely watched for beer trends and cannabis commentary.
Industrials / transports / capex: Greenbrier (GBX), Commercial Metals (CMC), Acuity (AYI) and related industrial names give clues on construction, rail, and manufacturing demand into 2026.
Labor / services / small business: Paychex (PAYX) on Friday is a useful micro read‑through on hiring and wage pressures for small and mid‑sized firms
Deepvue Market Themes
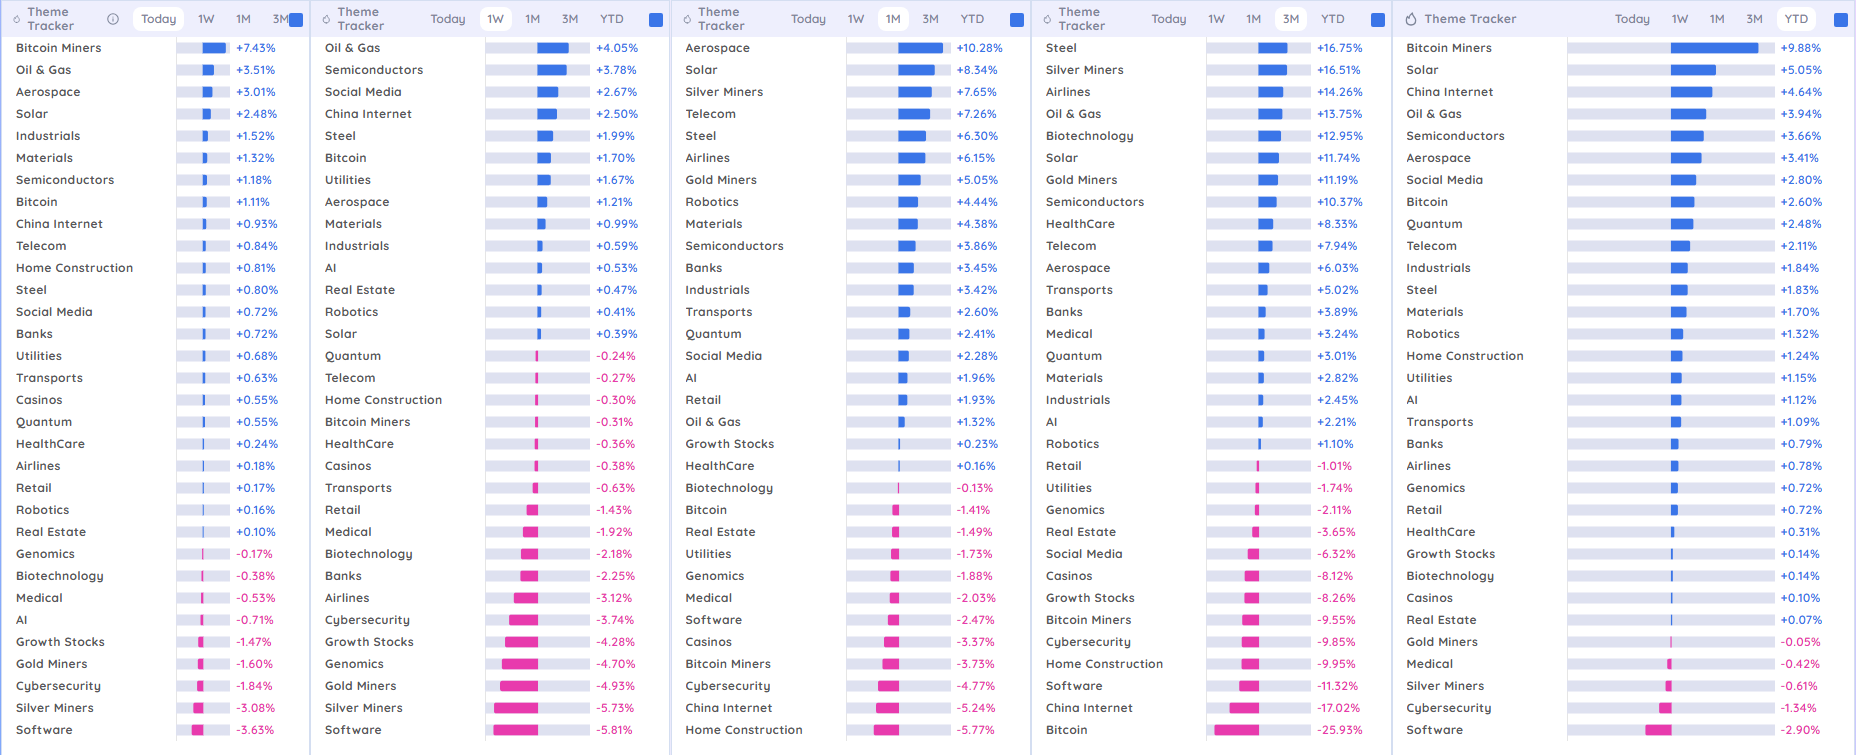
Momentum continuation setups
Themes that are already strong on 1M–3M and not selling off today/this week can be treated as trend‑following longs on pullbacks.
Aerospace / Solar / Steel / Airlines / Gold Miners / Robotics / Materials / Semiconductors / Telecom / Banks / Industrials / Transports: solid 1M strength with supportive 3M, suggesting continuation potential if Today/1W stay green or shallow red.
Steel / Silver Miners / Oil & Gas / Biotechnology / Solar / Semiconductors / HealthCare / Telecom: top of the 3M stack; dips on Today/1W that hold higher lows are candidates for buying into strength.
Mean‑reversion long ideas
Themes that are strong over 1W but still weak over 3M/YTD can offer short‑term pops back toward their longer‑term mean.
China Internet / Social Media / Real Estate / Retail / Growth Stocks / Biotech / Banks / Airlines: 1W strength but lagging on 3M, so you can target quick bounces into nearby resistance rather than expecting full trend reversals.
Bitcoin / Bitcoin Miners / Casinos / Cybersecurity / Software: if they print a strong 1W after being deeply negative on 3M, treat as tactical squeezes only and manage risk tightly.
Names to de‑emphasize for longs
Some themes screen poorly for either style right now.
Software / Cybersecurity / Home Construction / Bitcoin (spot): weak on both 1M and 3M with no clear 1W outperformance, so edge for long swings is limited unless your plan is very short‑term oversold bounces.
Defensives like Utilities: middle‑of‑the‑pack across timeframes, offering less asymmetric swing potential compared with clear leaders/laggards above.
TradersLab.io Themes

Swing Trading Takeaways
The board is highlighting cyclicals / commodities and industrials (Autos, Steel, Metals & Mining, Aerospace & Defense, Copper/Lithium) as the dominant RS clusters, suggesting risk‑on appetite toward real‑economy and materials plays.
A practical swing approach: focus watchlists on the listed “Leaders” within the strongest themes for continuation, and run scans or chart reviews on “Setting Up” names in Robotics, Natural Resources, and Banks for emerging moves.
Market Carpet for the week
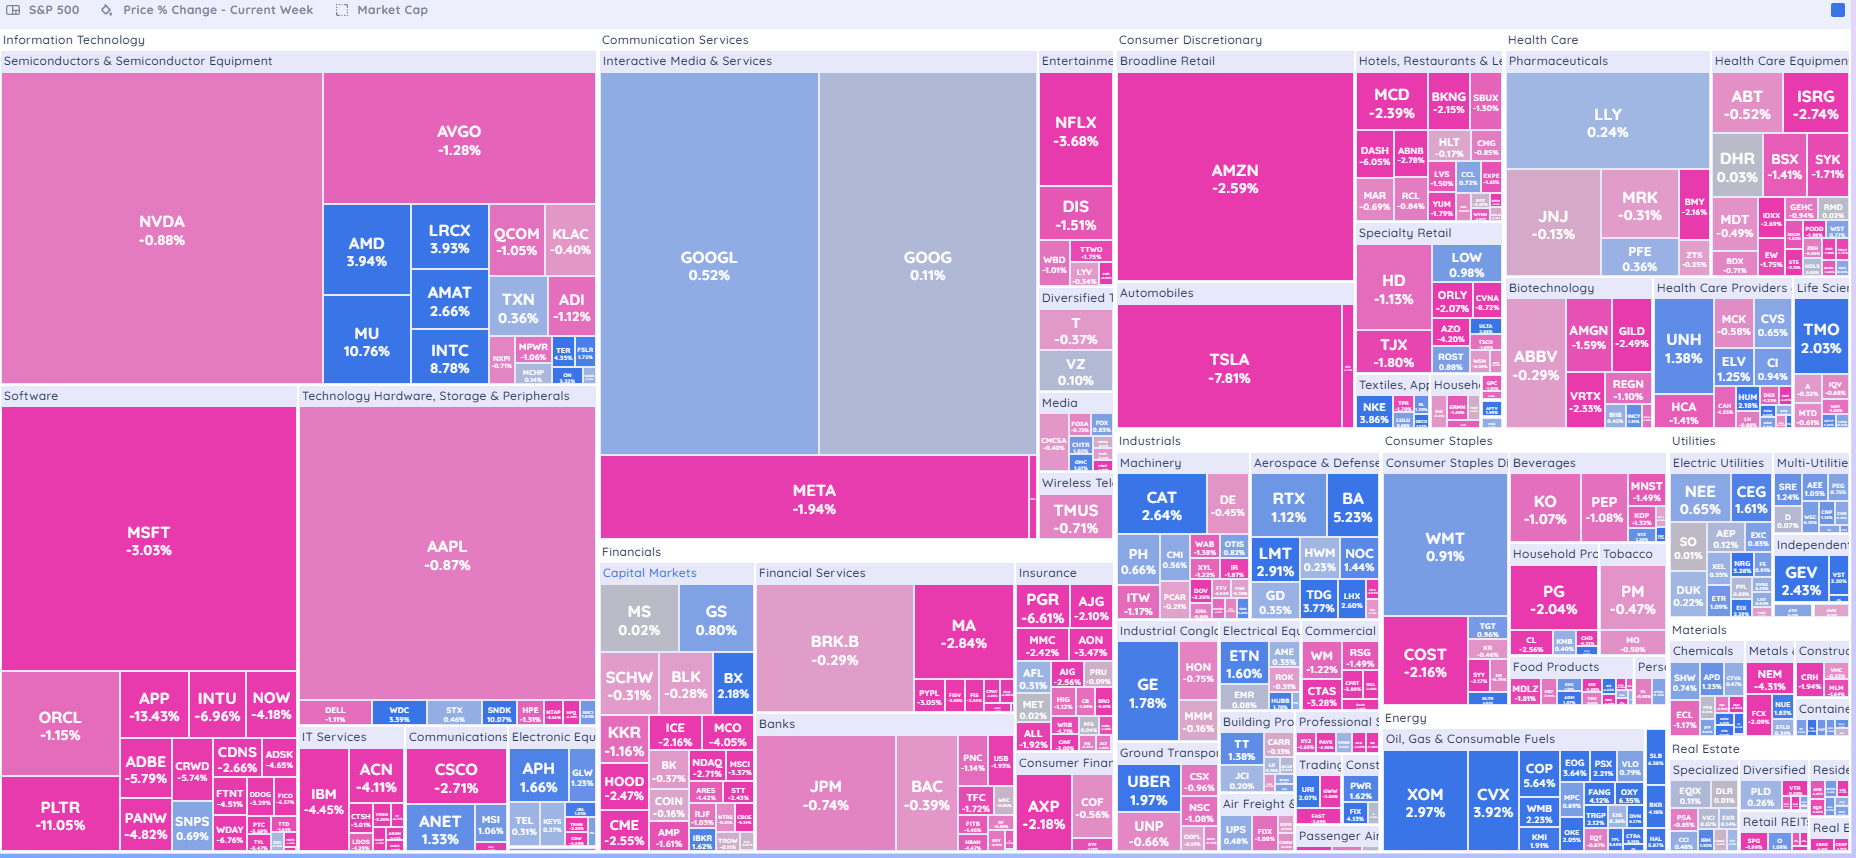
Sector highlights
Semiconductors: NVDA, AVGO slightly red while MU, AMD, LRCX, AMAT, INTC are bright blue/green, showing rotation within the group rather than a full-sector dump.
Software: MSFT, ADBE, NOW, PANW, APP, CRWD, INTU, CDNS, PLTR all notably red, indicating a momentum unwind in higher-valuation software.
Communication Services: META, NFLX, DIS are red, while GOOGL is slightly positive, suggesting a mild relative-strength shift toward search/advertising vs social/streaming.
Consumer Discretionary: AMZN and TSLA are both sharply negative, a classic “risk-off” signal inside growth/consumer space.
Defensives: Staples (WMT, COST, KO, PG), Utilities, and much of Health Care are mixed to slightly positive, showing some defensive bid.
Market character / risk tone
Risk-on leaders (software, mega-cap growth, EVs, high-beta consumer) are getting sold while some cyclicals (select industrials like CAT, BA, RTX) and defensives hold up or trade higher.
This pattern fits a rotation and de-risking environment more than a full-blown risk crash: money is moving within sectors and into relatively safer large caps rather than leaving equities entirely.
Swing-trade implications
Expect mean-reversion bounces in oversold growth/tech leaders but with choppy follow-through; favor tight risk on any counter-trend longs in beaten-down software and TSLA/AMZN.
For relative-strength plays, look for continuation setups in green pockets like select semis (MU, AMD, LRCX, AMAT, INTC) and industrial/defensive names showing blue on the map, while avoiding or shorting the weakest pink clusters within software and consumer.
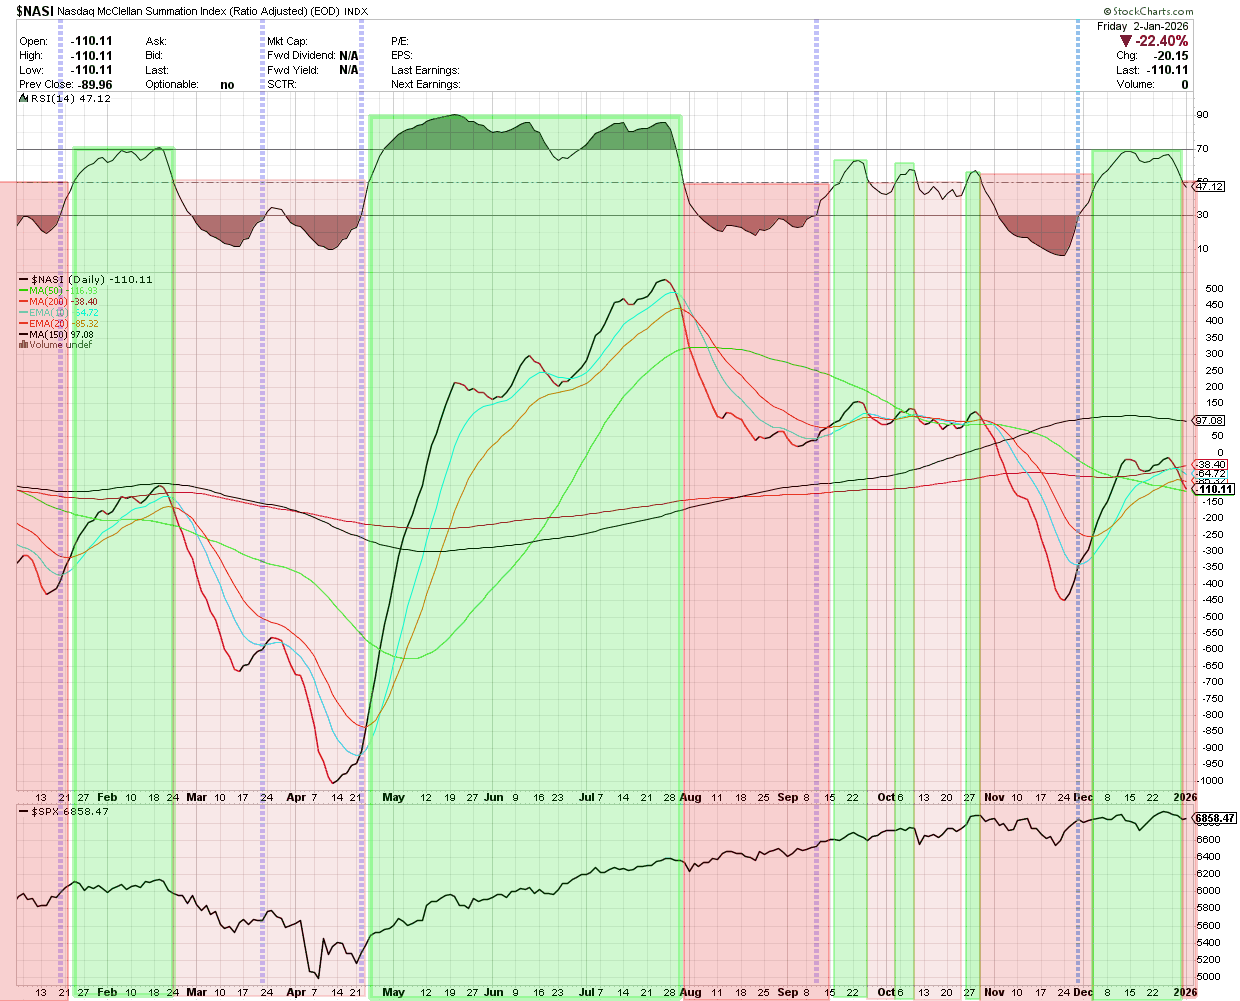
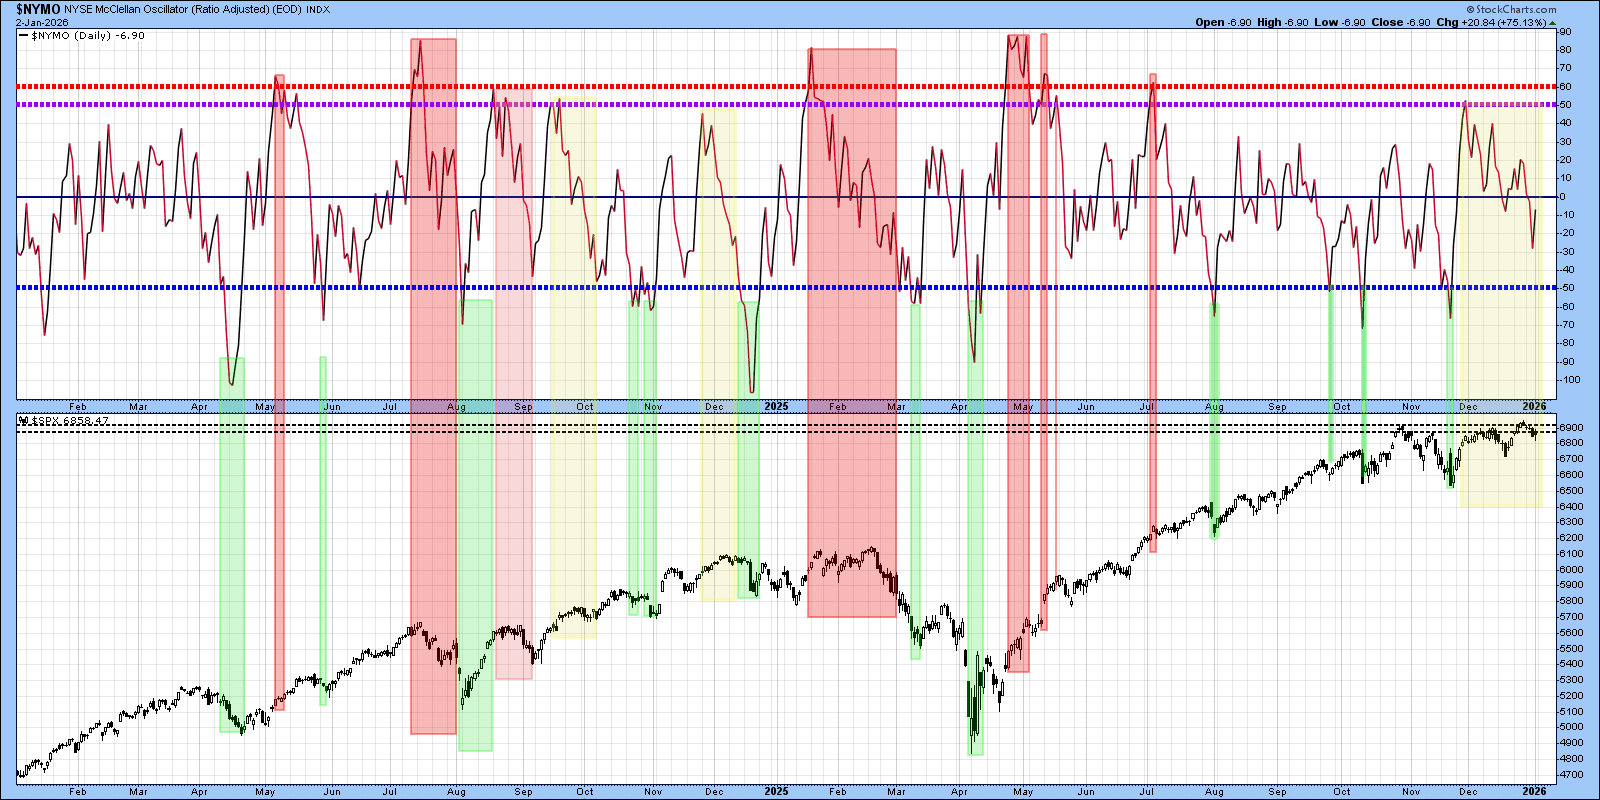
Psych Charts of note
NASI has crossed the 50… I don’t make the rules…
NYMO… Wait for it… Blue oversold line area…
SPX Intraday Morning Gaps Tracker
SPX intraday… Weak all around… We couldn’t fill the morning gap down on December 28th and failed to hold the morning gap Friday…
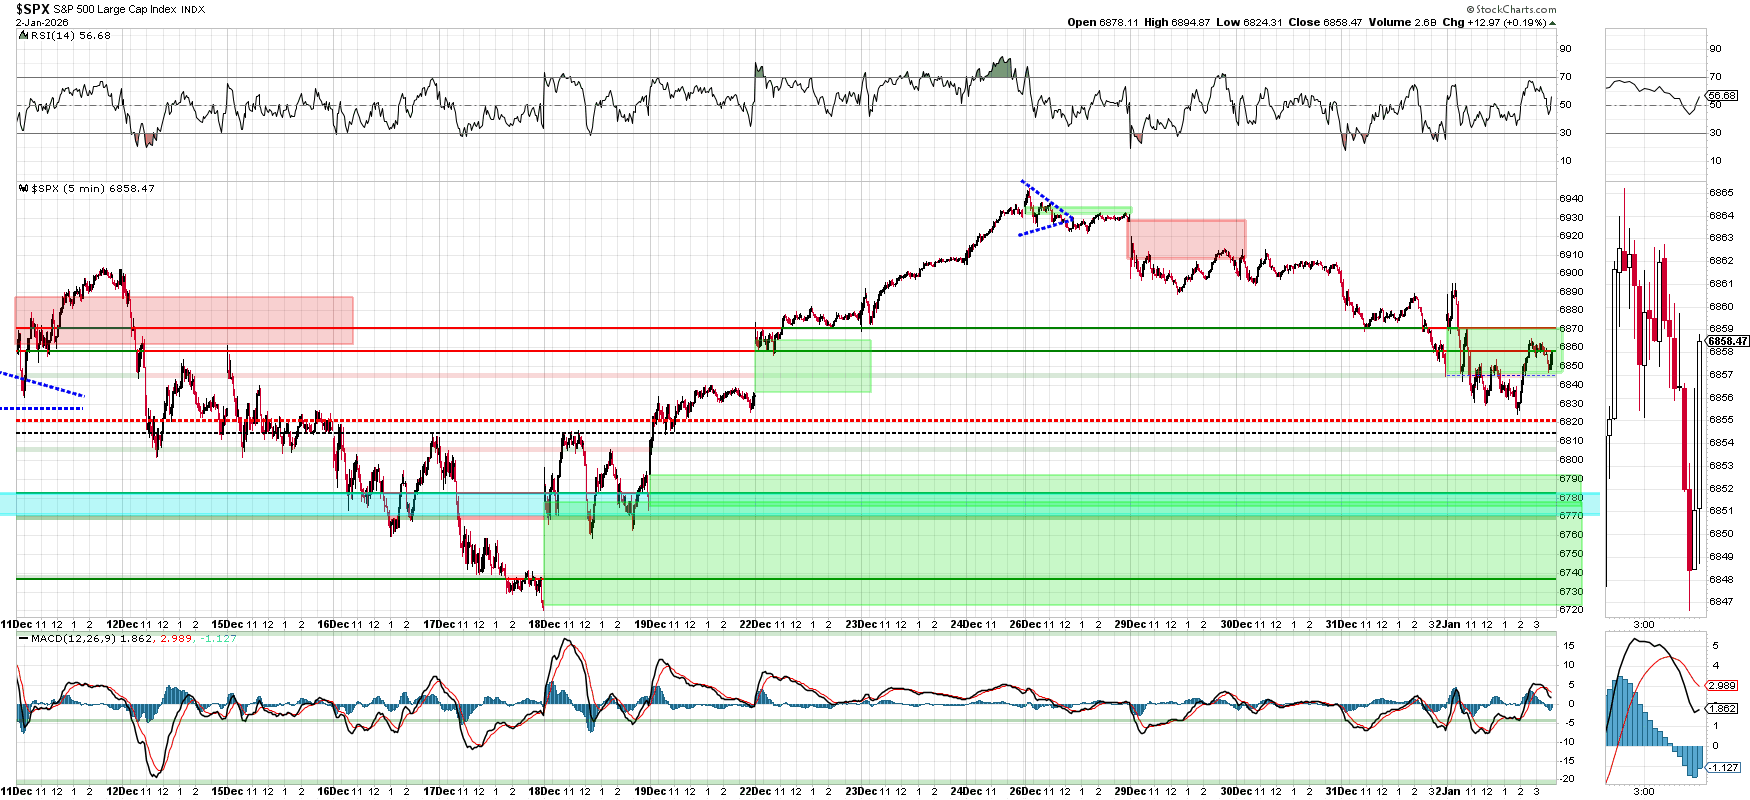
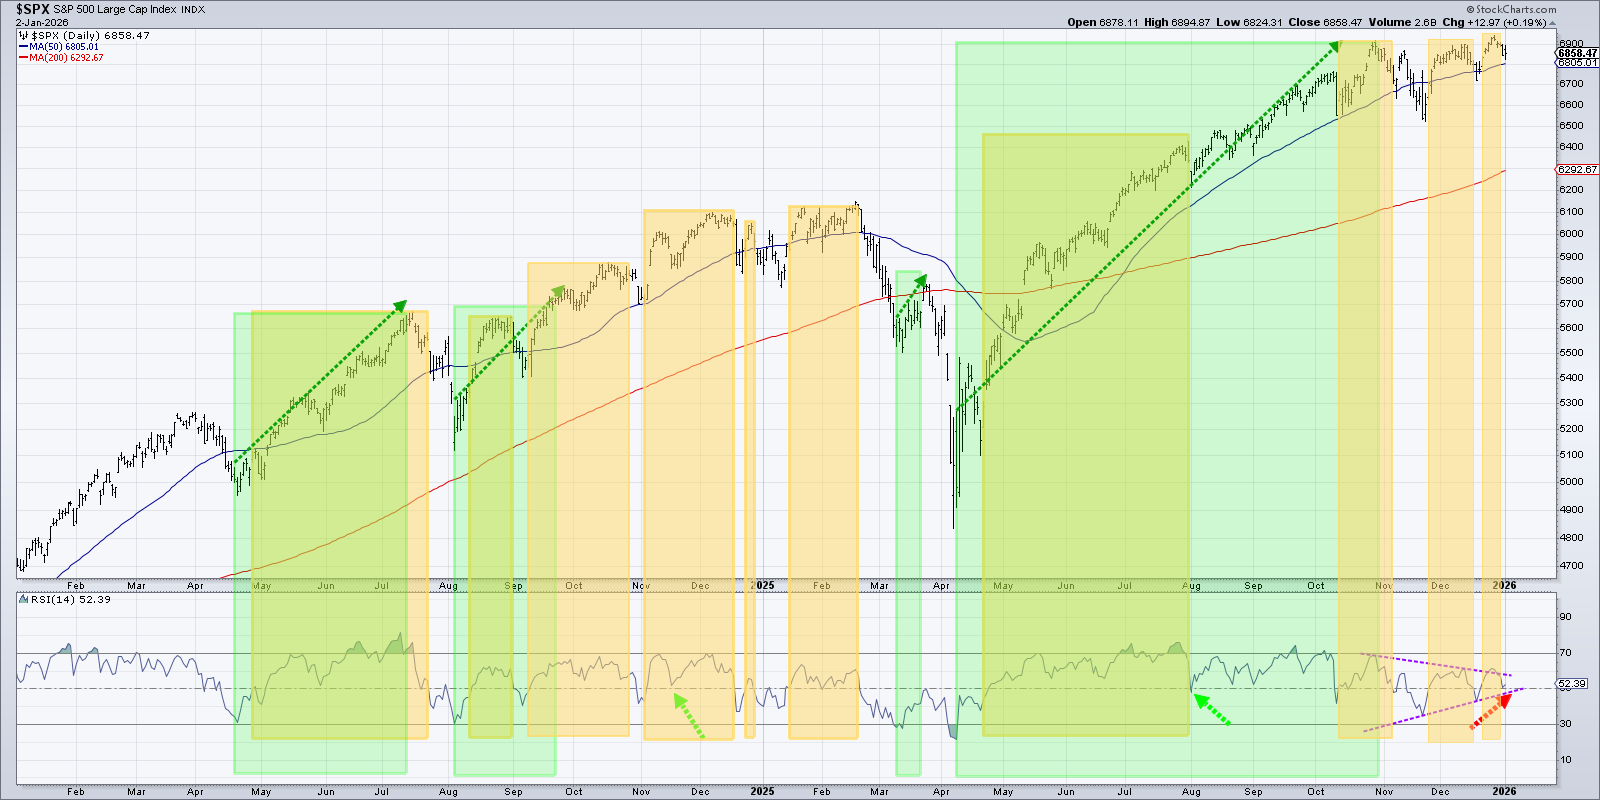
SPX RSI tracker
Potential cross below the 50 early this week.
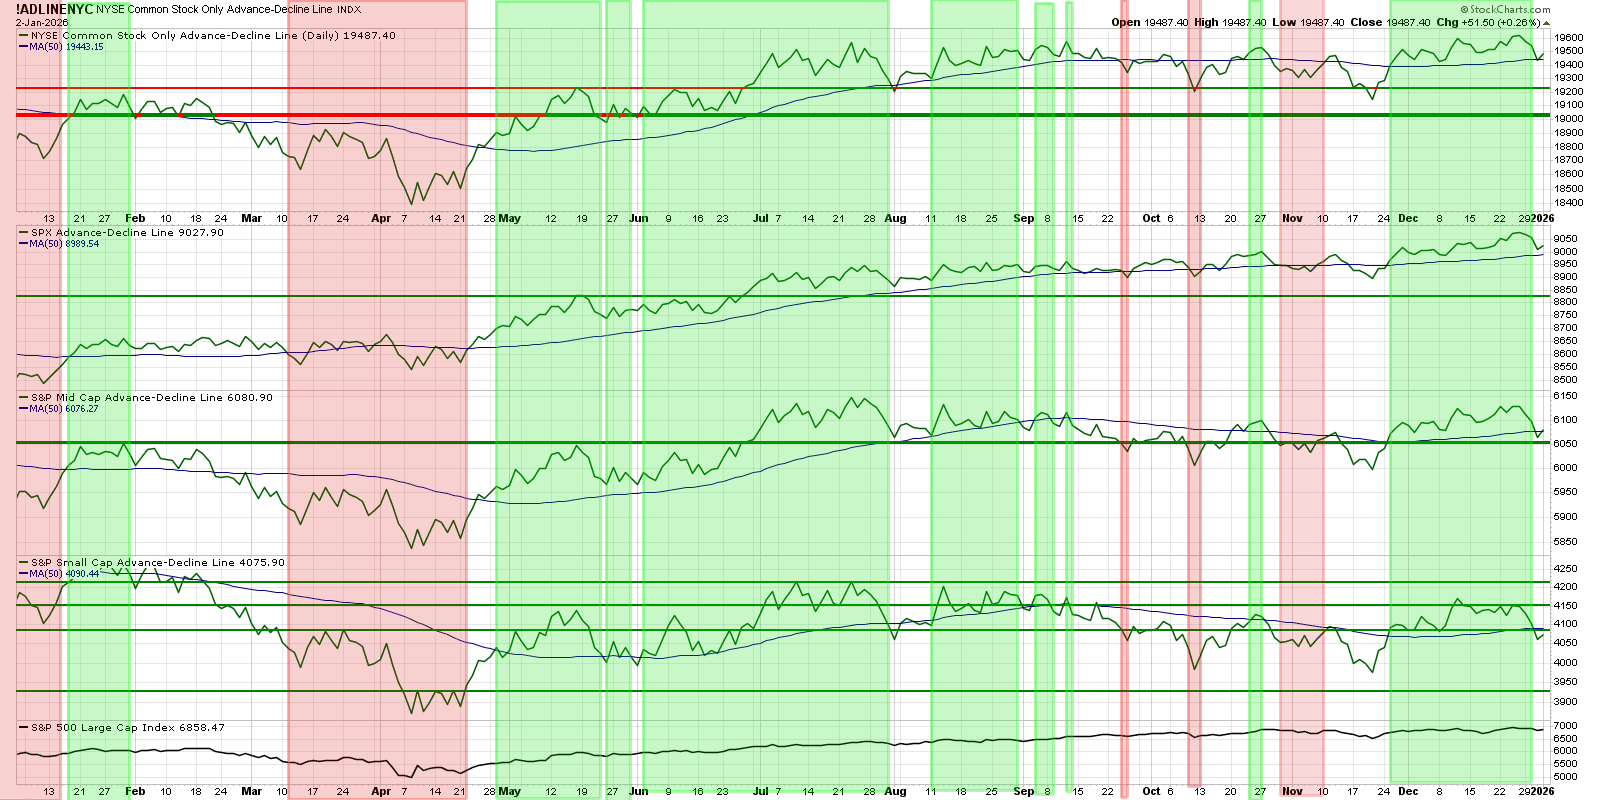
Breadth
Slowly breaking down. We lost the 50 day on small caps and mid-caps…
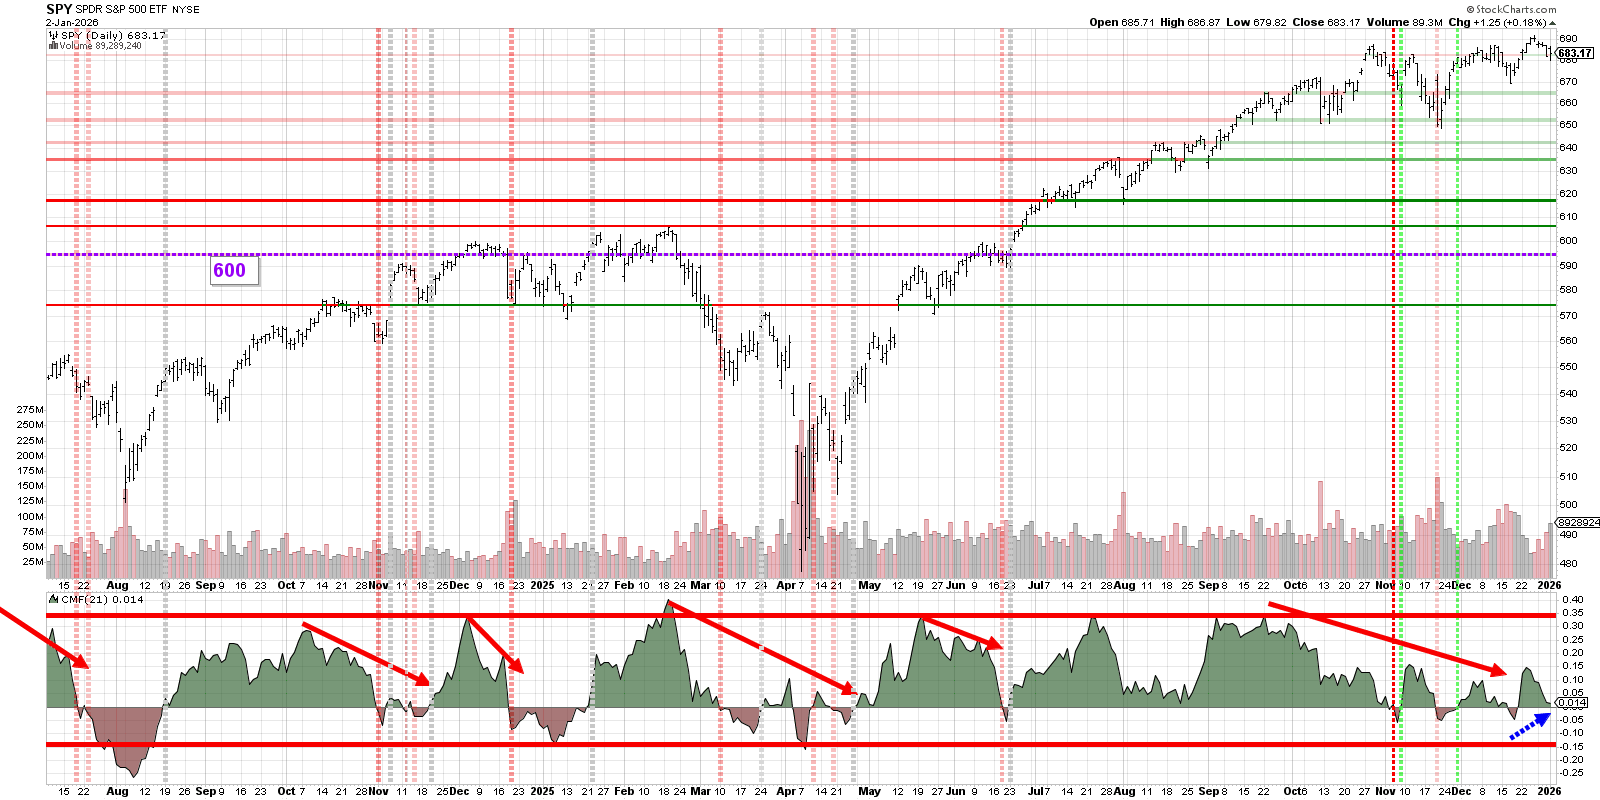
SPY
Potential CMF cross below zero… Don’t like that…
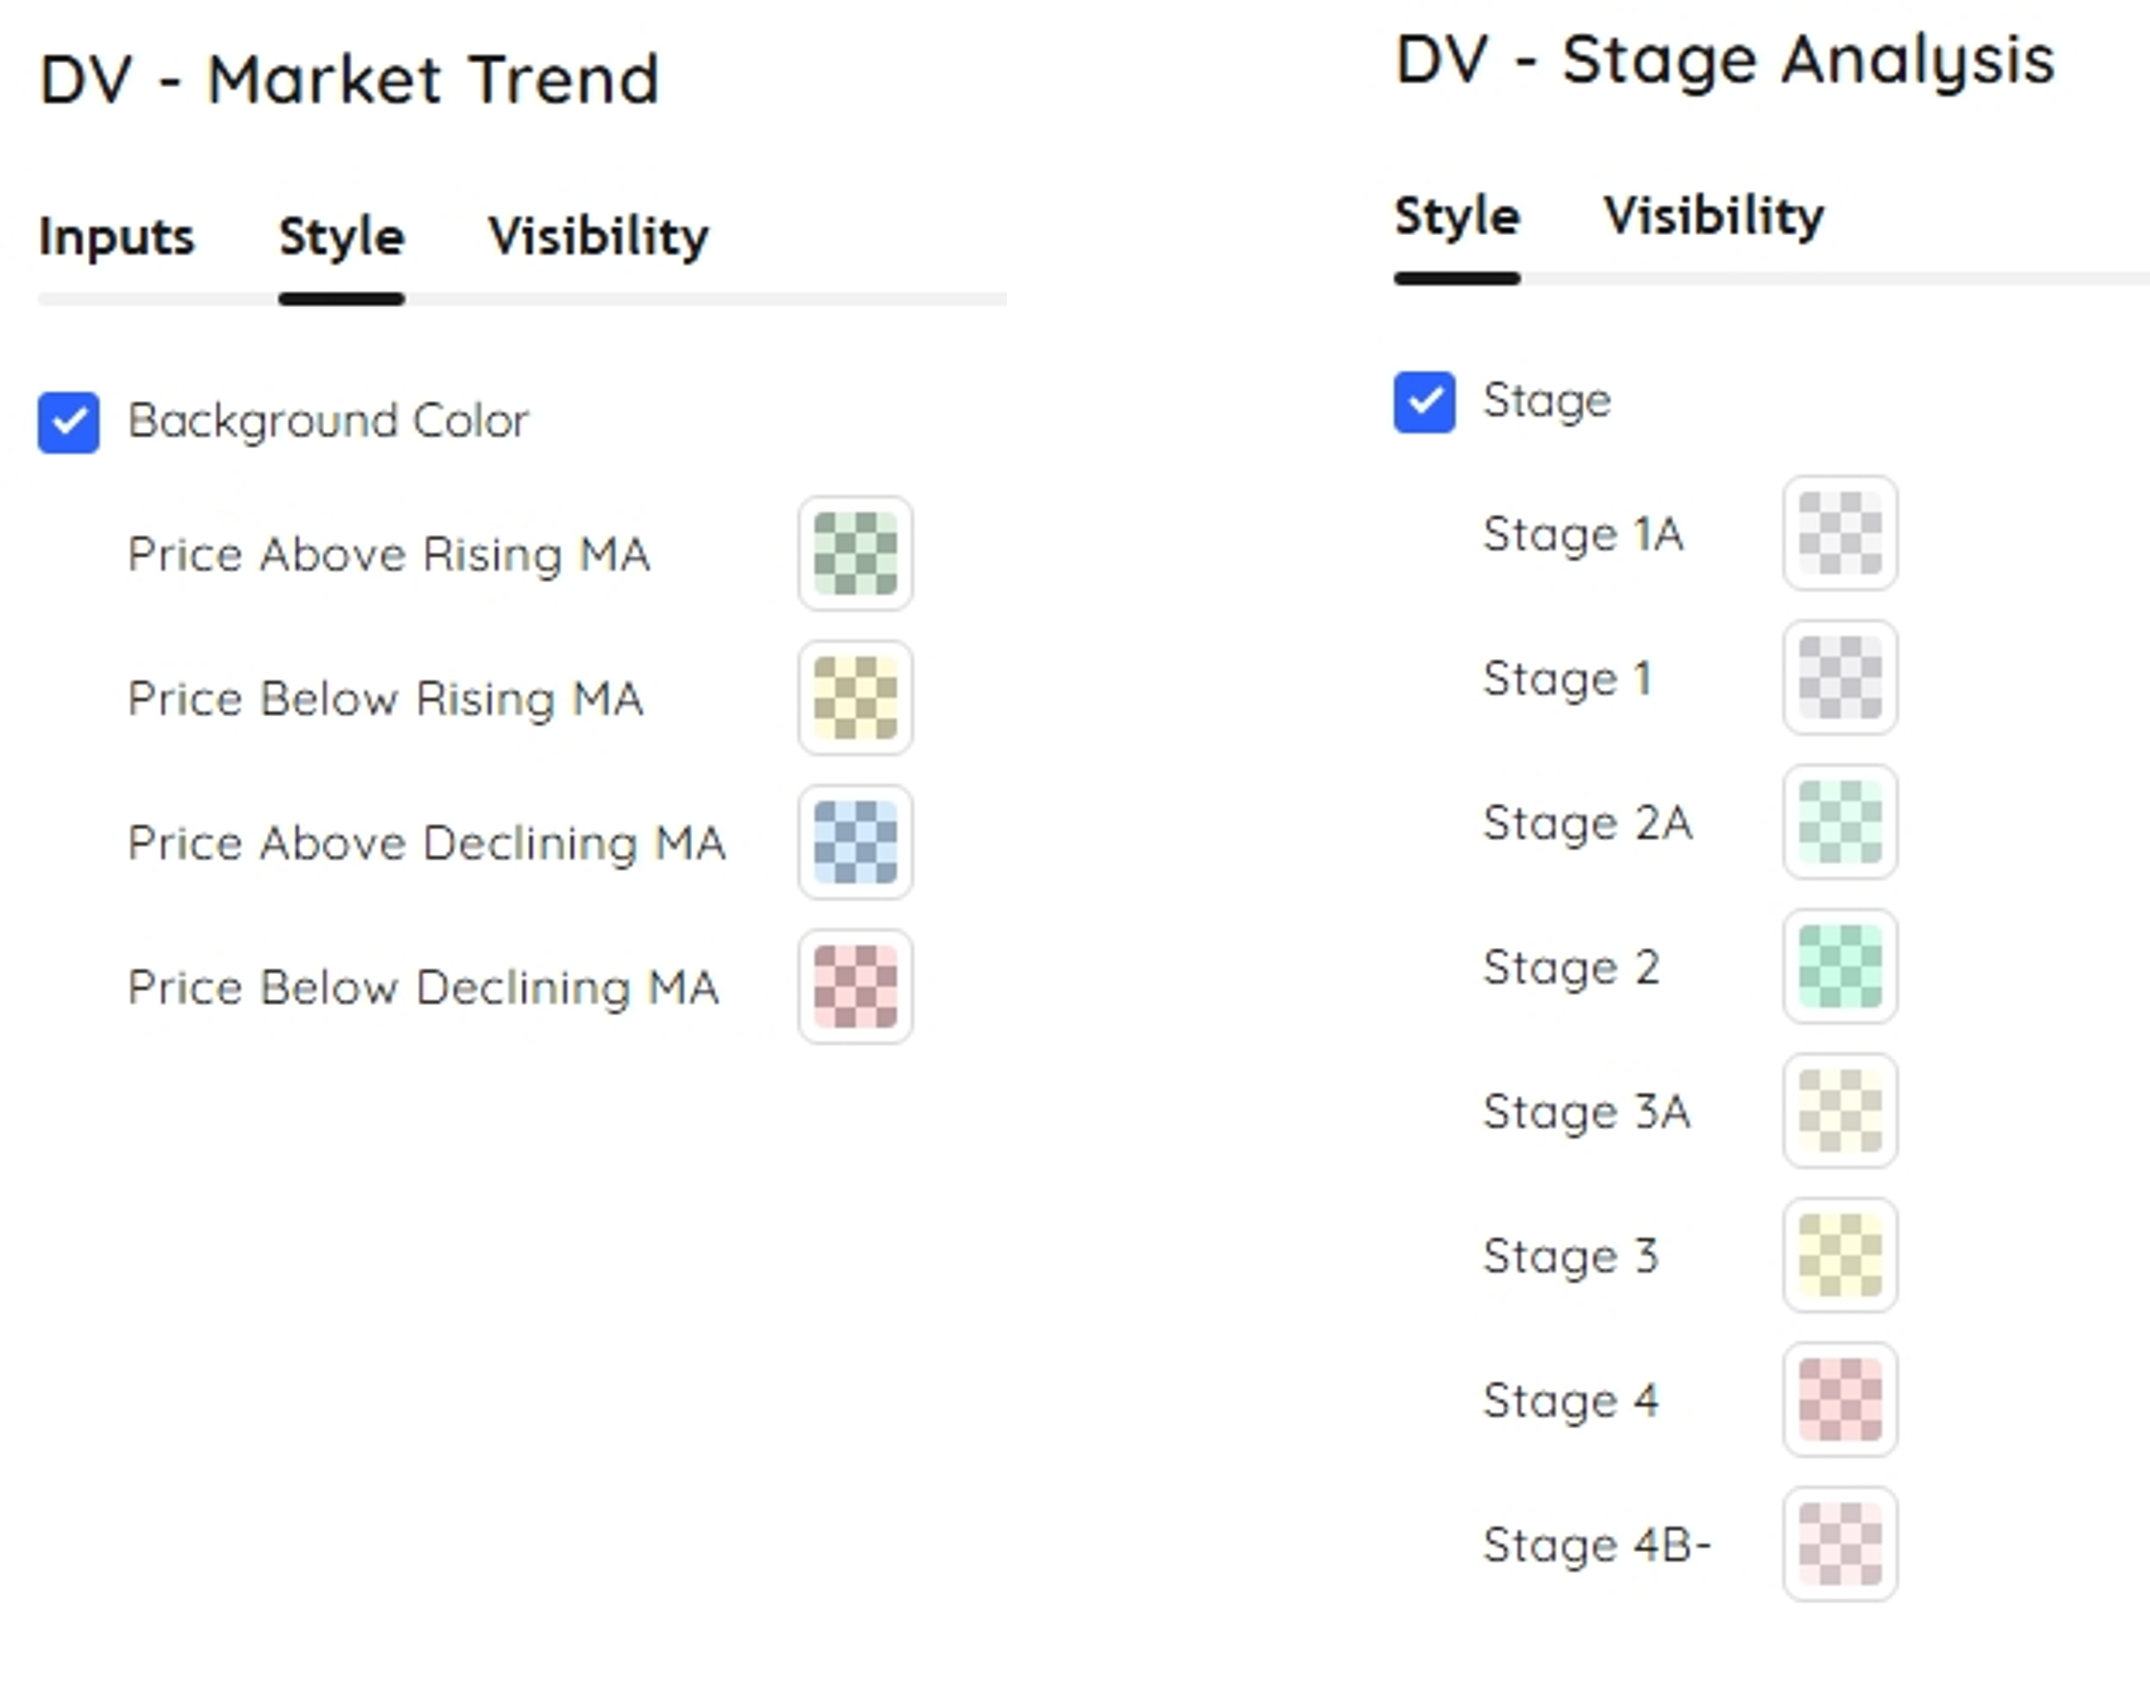
SPY chart with Deepvue market trend analysis
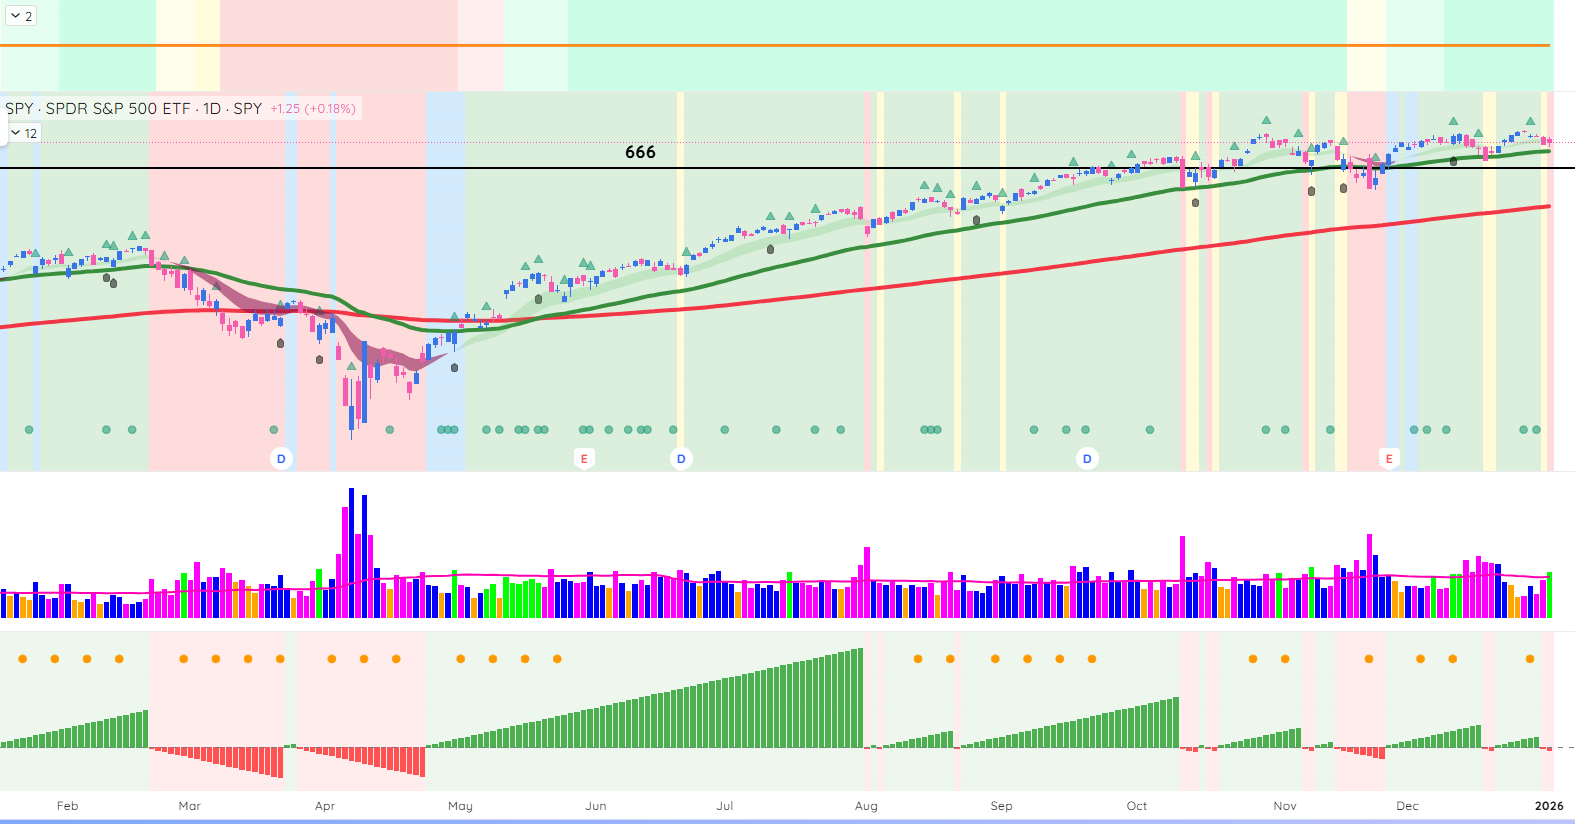
Need to be cautious and wait for the Market Cycle to start…
Weekly- Relative Rotation Graph (RRG)
This chart provides a relative strength and momentum snapshot for all S&P sector ETFs against the SPY over the 5-week period.
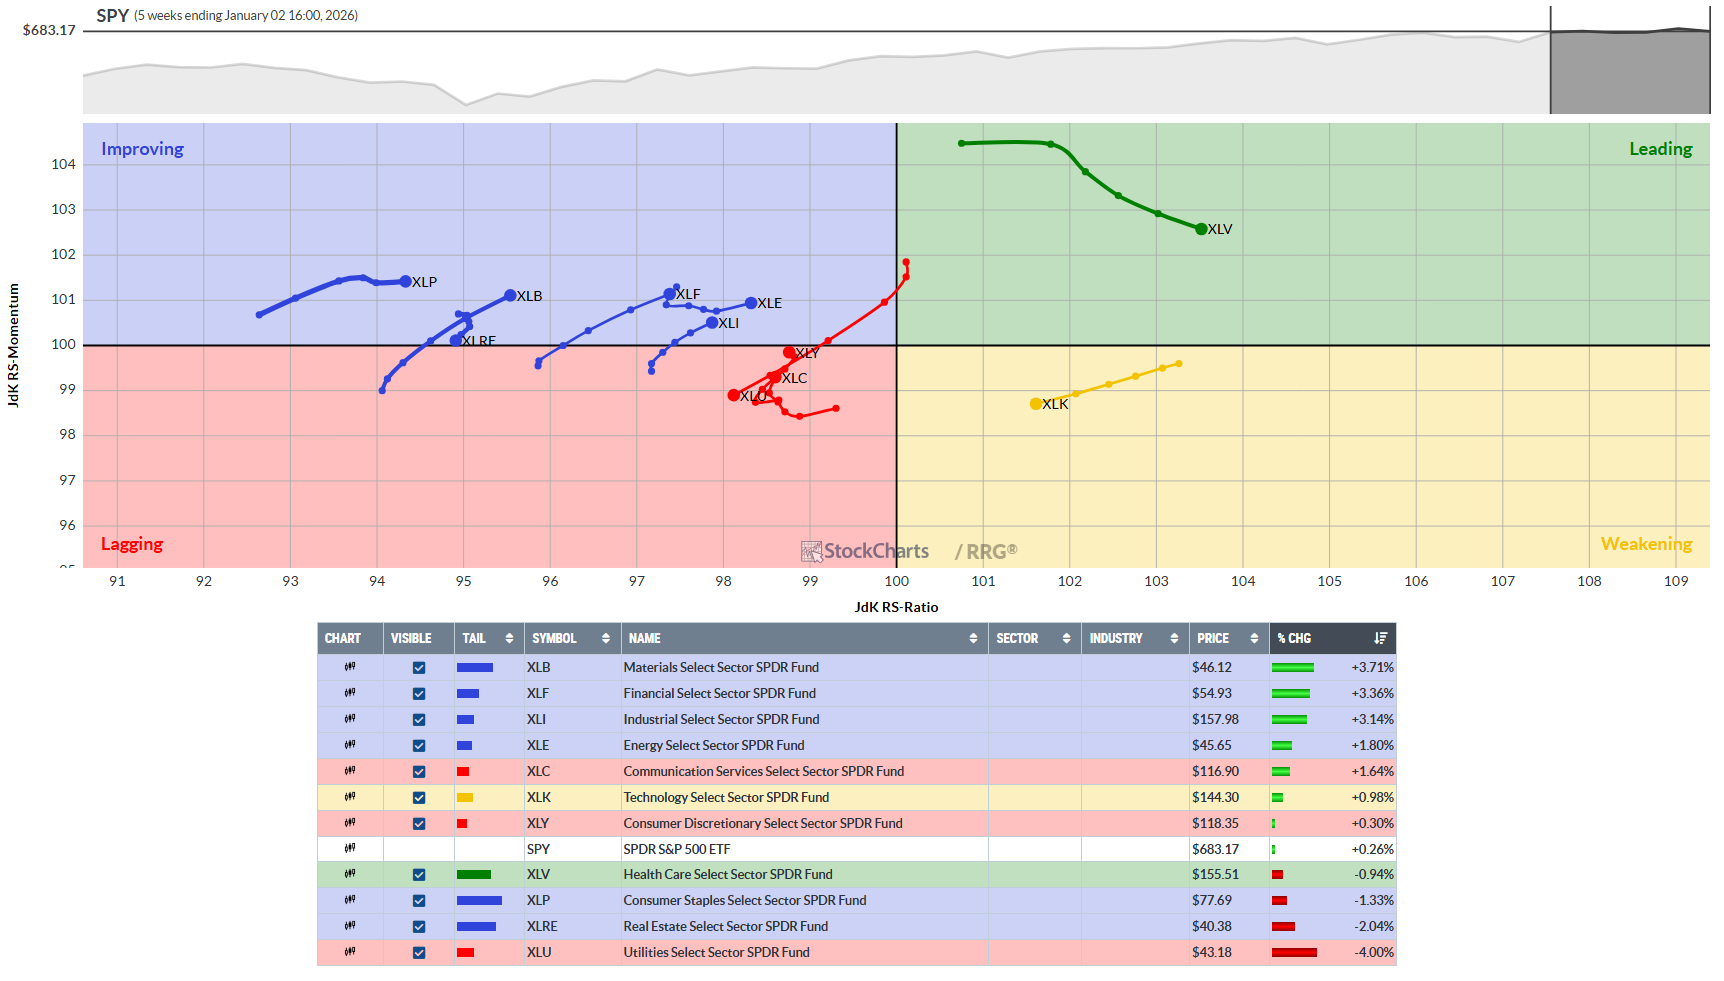
Swing-trade takeaways
High-conviction long bias: XLV as core, with XLF/XLB/XLI as secondary long ideas on pullbacks that hold their rising RS-Ratio trajectories above 100.
Tactical defense: XLP as a low-vol “parking” sector if SPY starts to roll over while its tail remains in or near improving/leading.
De-risk/avoid: Reduce overweight XLK and avoid fresh longs in XLC, XLRE, and XLU while their tails remain in lagging/weakening and RS-Ratio below 100.
Before we look further at the S&P 500 sectors, let’s look at the offensive versus defensive chart below…
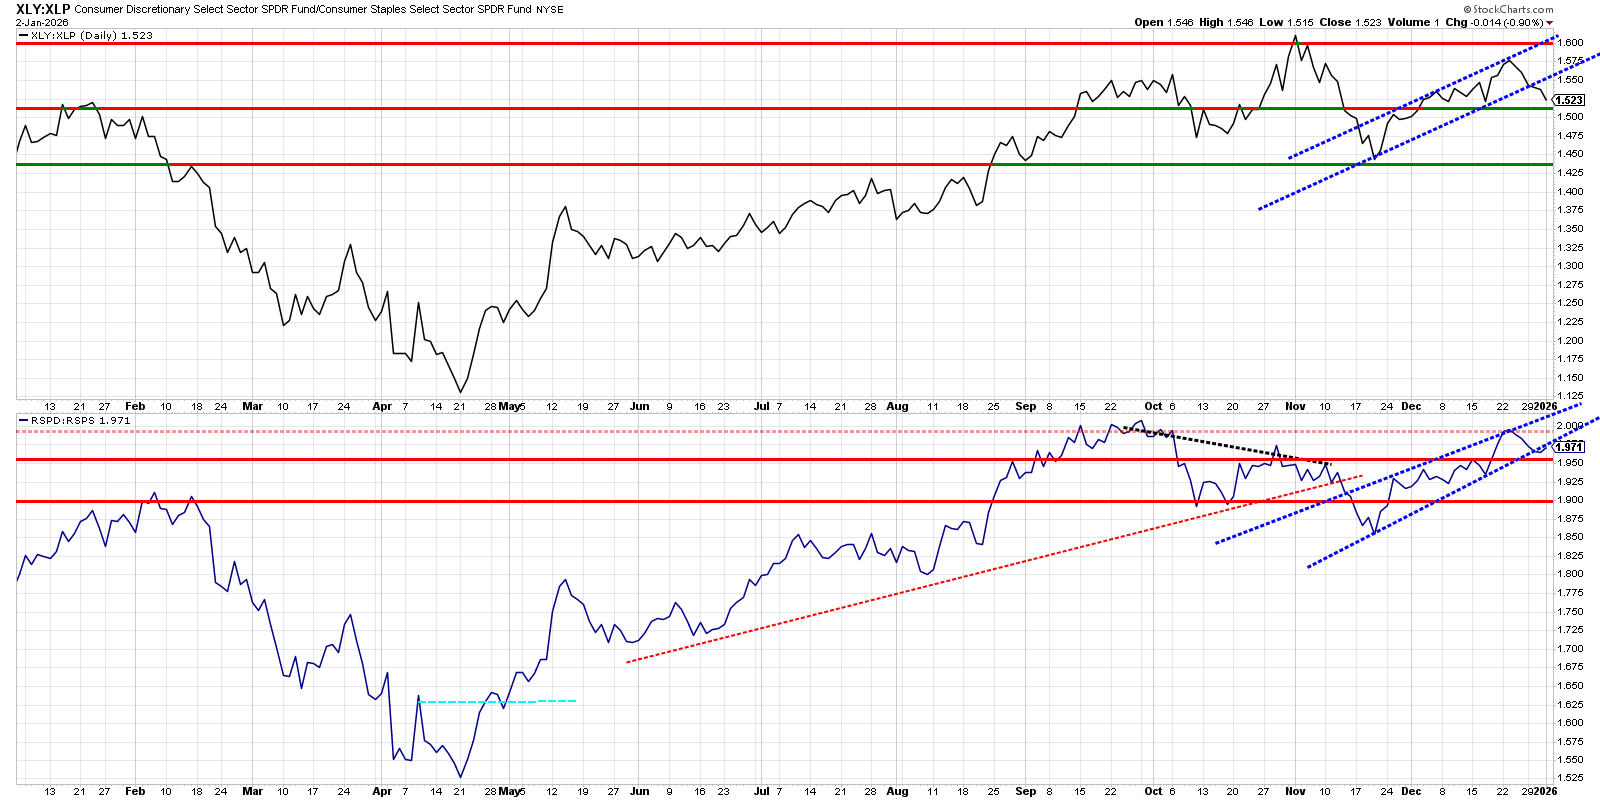
You can see for yourself that defensives are starting to outperform growth…
Growth versus Spy
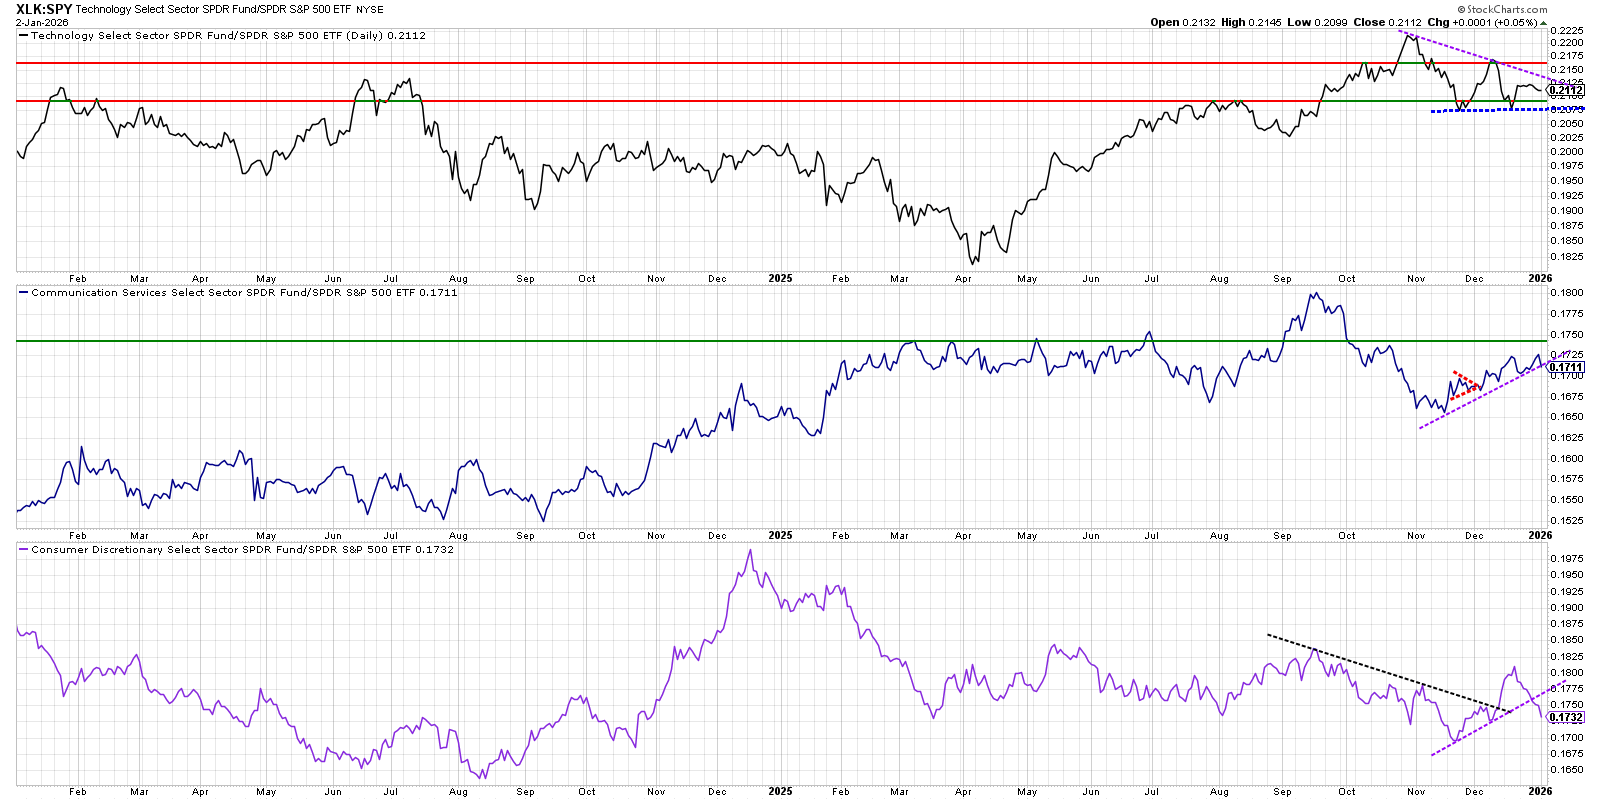
Trading implications
Treat tech as consolidating leadership rather than aggressively expanding it.
GOOGL is holding the line for XLC… If she fails to hold, we go lower in growth IMO…
Value versus SPY
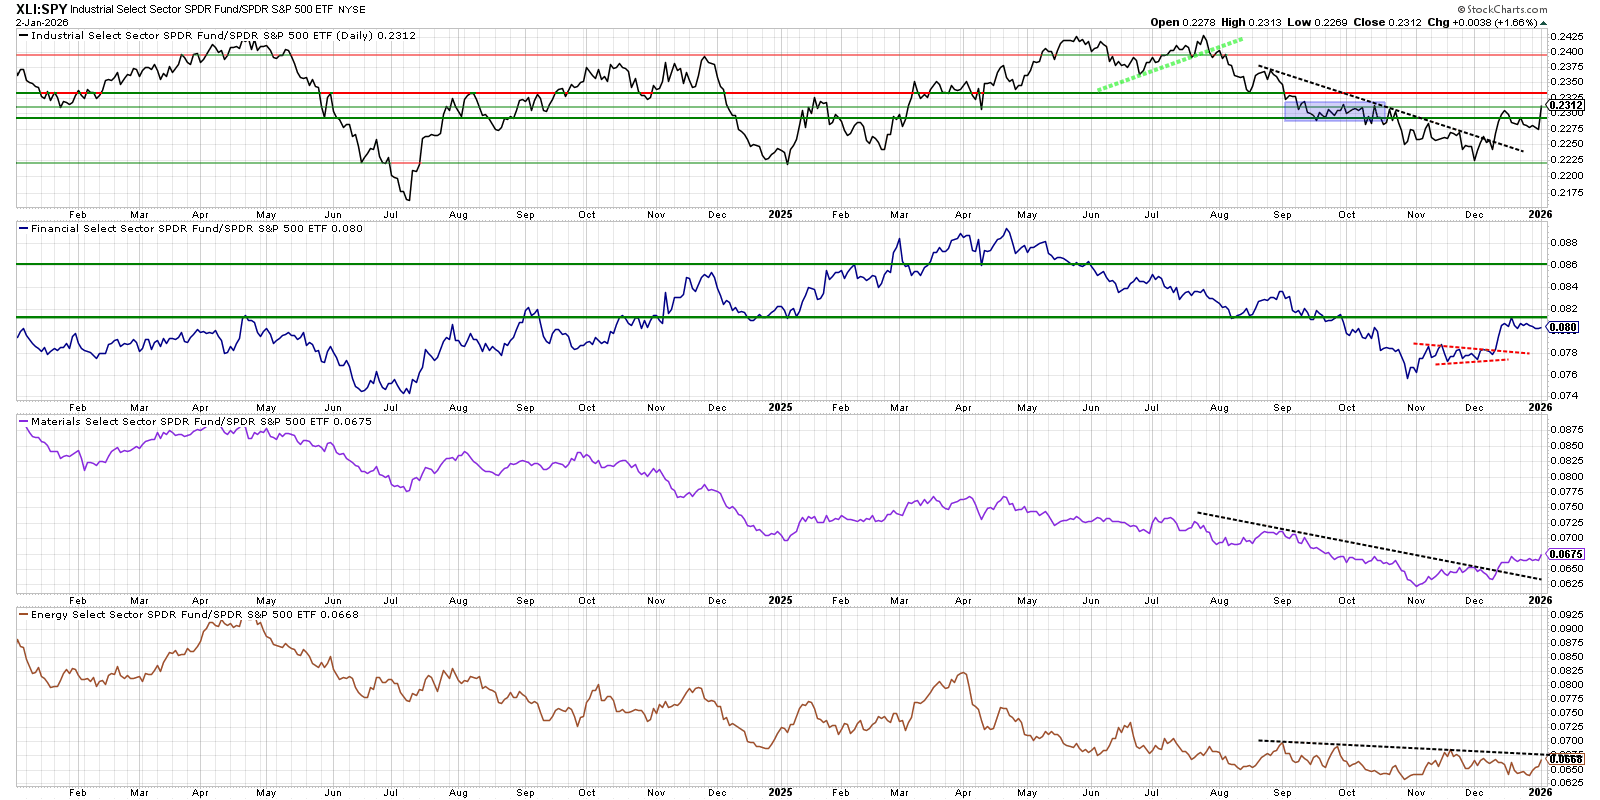
Value trying to make a run…
Industrials leading the way
Defensives versus SPY
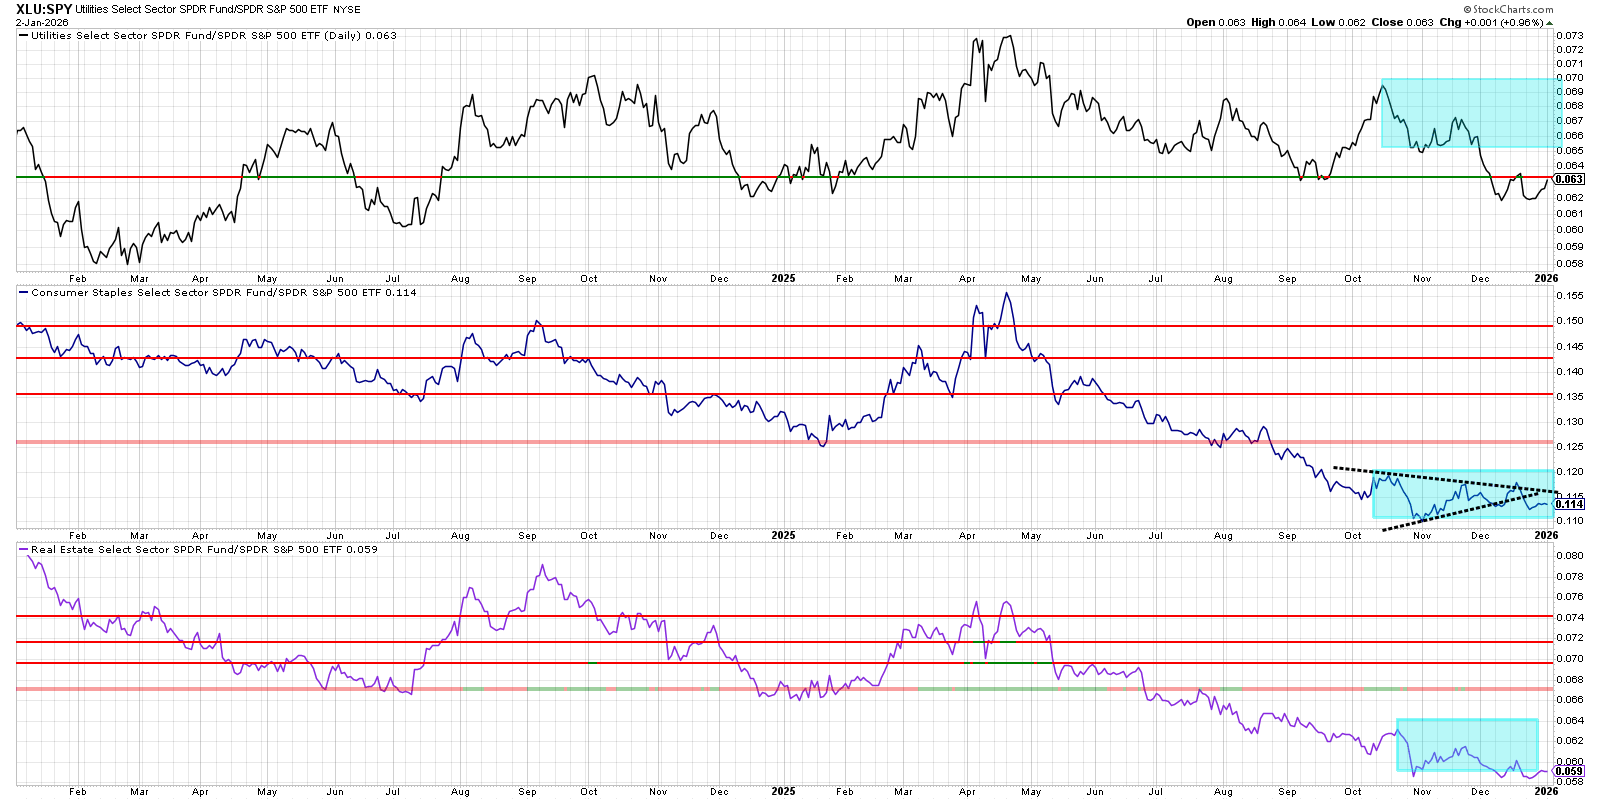
Trading Implications
Could be some movement here but for now it’s all about Industrials/Materials/Financials/Energy
Thoughts this week: I entered the US Investing Championship. My goal is to be on the first page results this year. Maybe even get my pic on the X feed one day…

You can do it, Keep Studying!
Most others don’t post their YTD because they can’t or frankly, they are lying. You better make sure, or you might lose it all…
Stock Talk Insiders discord
If you like this Phat Swing Plan, and you would like to receive alerts for my trades, click this link for the discord Stock Talk Insiders discord and enter the promo code: PHAT to get 10% off all packages for life...

Follow my alerts on Stock Talk Insiders discord Enter code: PHAT for 10% off
Follow my Phatstack for my Phat Swing Plan and updates during the week.
Follow me on X Phatinfantry Trading @Phatinfantry where I post/talk crap when I drink wine and make fun of dumb things.
Follow me on YouTube where I go through my process and review charts Phatinfantry
Interesting observation on how WMT and other defensives are showing that bid while mega-cap growth gets de-risked. The sector rotation here feels like a classic late-cycle playbook where money parks in safer names while waiting for the jobs data to clarify the Fed path. I've been watching similar action in my own watchlist and noticed the same pattern during past transitions where defensive staples outperformed for weeks before either a real correction or a renewed breakout. What's tricky is timing the rotation back into tech/growth once volitility settles, since overstaying in defensives can leave upside on the table when risk sentiment flips again.
Thank You Sir