
Phat Swing Plans and Observations
For the week of 1/12/26


Of note: Apparently, all of fintwit has completely broken down all possible trades from the Trump credit card 10% cap statement and the impacts it will have on the markets… “Warning, warning … Danger, Will Robinson, danger!”
U.S. equities posted solid gains across the board for the week ended Jan 9, 2026, with major indices up 1.5–2.3% and utilities the only S&P sector finishing in the red.
Indexes
S&P 500: Up about 1.6% on the week, closing at a record high.
Nasdaq Composite: Up about 1.9%, supported by growth and semis, also logging a strong first week of 2026.
Dow Jones Industrial Average: Gained roughly 2.3% and ended the week at a new record close.
Sectors
Leadership: Consumer cyclicals (~+5.7%) and basic materials (~+5.5%) were the standout winners, with small caps and cyclicals broadly outperforming.
Laggards: Utilities fell about 1.4% on the week and were the only sector in negative territory; tech was roughly flat (~+0.1%), trailing the broad tape.
Factor / style moves
Size: Small caps rose about 3.7%, outpacing mid caps (~+2.3%) and large caps (~+1.4%), consistent with a pro‑cyclical, “risk‑on” rotation.
Style: Growth gained about 2.2%, value about 1.9%, and blend about 2.8%, with breadth positive (roughly 70% of covered U.S. stocks finished higher on the week).
Macro and rates
Jobs: December nonfarm payrolls came in near but slightly below consensus (about +50k vs +55k expected), while unemployment ticked down to 4.4%, reinforcing the “cool but not cold” labor‑market narrative.
Rates: The 10‑year Treasury yield ended near 4.17%, down about 2 bps on the week, a mild tailwind for equities as markets eye the Fed’s next steps.
Key swing‑trader takeaways
Tape: Strong risk appetite with rotation into cyclicals, materials, and small caps; defensives like utilities are fading and underperforming the index.
Setups: Breakouts and pullback‑buys in leading cyclicals/materials and small‑cap baskets look favored.
The StockCharts Technical Rank (SCTR)
Proprietary ranking score (0-100) by Stockcharts.com that evaluates a stock or ETF’s technical strength compared to its peers, using a blend of multiple timeframes and momentum metrics.
Interpretation and Use
Top 10%: SCTR scores 90–100 indicate strong technical leaders.
Middle Range: Scores between 40–60 represent average technical strength.
Bottom 10%: Scores 0–10 indicate technical laggards.
Scores above 60 generally signal relative technical strength, while scores below 40 highlight weakness.
SCTR is best used for peer comparisons and screening for momentum, rather than as a standalone trading/signal tool.
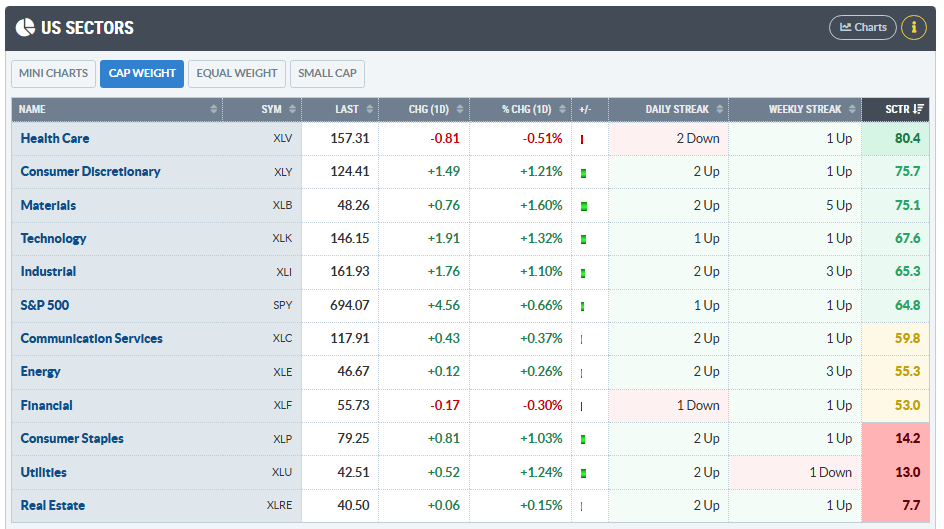
Health care maintains its lead as both cyclicals and materials move past technology which has dropped to 4th on the SCTR rating.

So once again, we see the “Great Rotation” pattern continuing. Only time will tell…
Major Economic Events
For the week of Monday Jan 12 through Friday Jan 16, 2026, markets are focused mainly on US inflation data (CPI, PPI), US retail sales, and key macro out of the UK, China, Australia, and Germany. These releases are central for Fed expectations and global growth/inflation narratives.
Big-picture focus
Key US theme: December CPI and PPI prints plus retail sales, which together update the view on how fast inflation is decelerating and how resilient the consumer is heading into 2026.
Key global theme: Chinese Q4 GDP and activity data, UK labor data, Australian labor data, and final German CPI, giving a read on global demand and the disinflation path in major economies.
Day-by-day highlights (Jan 12–16)
Monday, Jan 12
No major tier-1 macro releases scheduled; lower scheduled data risk.
Tuesday, Jan 13
US Consumer Price Index (Dec) – headline and core CPI at 8:30 ET.
US Real Earnings (Dec) alongside CPI.
UK labor market data (employment/unemployment/wages).
Wednesday, Jan 14
US Producer Price Index (PPI) and US Retail Sales, including the “control group” that feeds GDP, around 8:30–13:30 GMT (morning US).
Chinese industrial production and retail sales data.
Thursday, Jan 15
Australian labor market report (employment, unemployment rate).
Key Chinese macro data (additional activity indicators beyond the prior day’s releases).
Friday, Jan 16
China Q4 2025 GDP release.
Final German CPI, confirming the latest inflation trajectory in the euro area’s largest economy.
Why this matters for swings
US CPI/PPI/retail sales can move rate expectations, the dollar, and duration-sensitive sectors (high-growth tech, REITs, utilities) over a 3–15 day horizon.
China GDP and activity plus German CPI can swing cyclicals, commodities, EM, and global industrials given sensitivity to global growth and trade.
Key earnings for the week
For the week of Mon Jan 12–Fri Jan 16, 2026, earnings season effectively kicks off with large US banks, TSMC, and a few notable cyclicals/financials. This is a financials-heavy week with one big non-US tech print (TSMC).
Headline names by day
Tuesday, Jan 13
JPMorgan Chase (JPM) – major US money-center bank, widely seen as the bellwether for financials.
Delta Air Lines (DAL) – key read on travel demand and consumer/corporate spend.
Bank of New York Mellon (BK) – custody/asset-servicing and markets activity.
Wednesday, Jan 14
Bank of America (BAC) – large diversified consumer and corporate bank.
Wells Fargo (WFC) – US credit/consumer lending tilt, mortgage and main-street exposure.
Citigroup (C) – global credit, markets, and IB read-through.
Thursday, Jan 15
Morgan Stanley (MS) – wealth/investment management and capital-markets skew.
Goldman Sachs (GS) – pure-play-ish on trading and investment banking.
BlackRock (BLK) – asset-management flows risk-on/risk-off gauge.
J.B. Hunt Transport (JBHT) – freight/transport, a proxy for goods demand.
Friday, Jan 16
Taiwan Semiconductor (TSM) – key global semiconductor and AI supply-chain bellwether.
State Street (STT), PNC Financial (PNC), Regions Financial (RF), M&T Bank (MTB), others – broader US banking read across sizes/regions.
Sector read-through
Financials: Most big money-center and investment banks report this week, so XLF/KRE, credit spreads, and yield-curve narratives are in play.
Macro/AI/semis: TSMC’s print and guide will matter for SOX, AI infra, and broader risk sentiment around 2026 capex.
Deepvue Market Themes
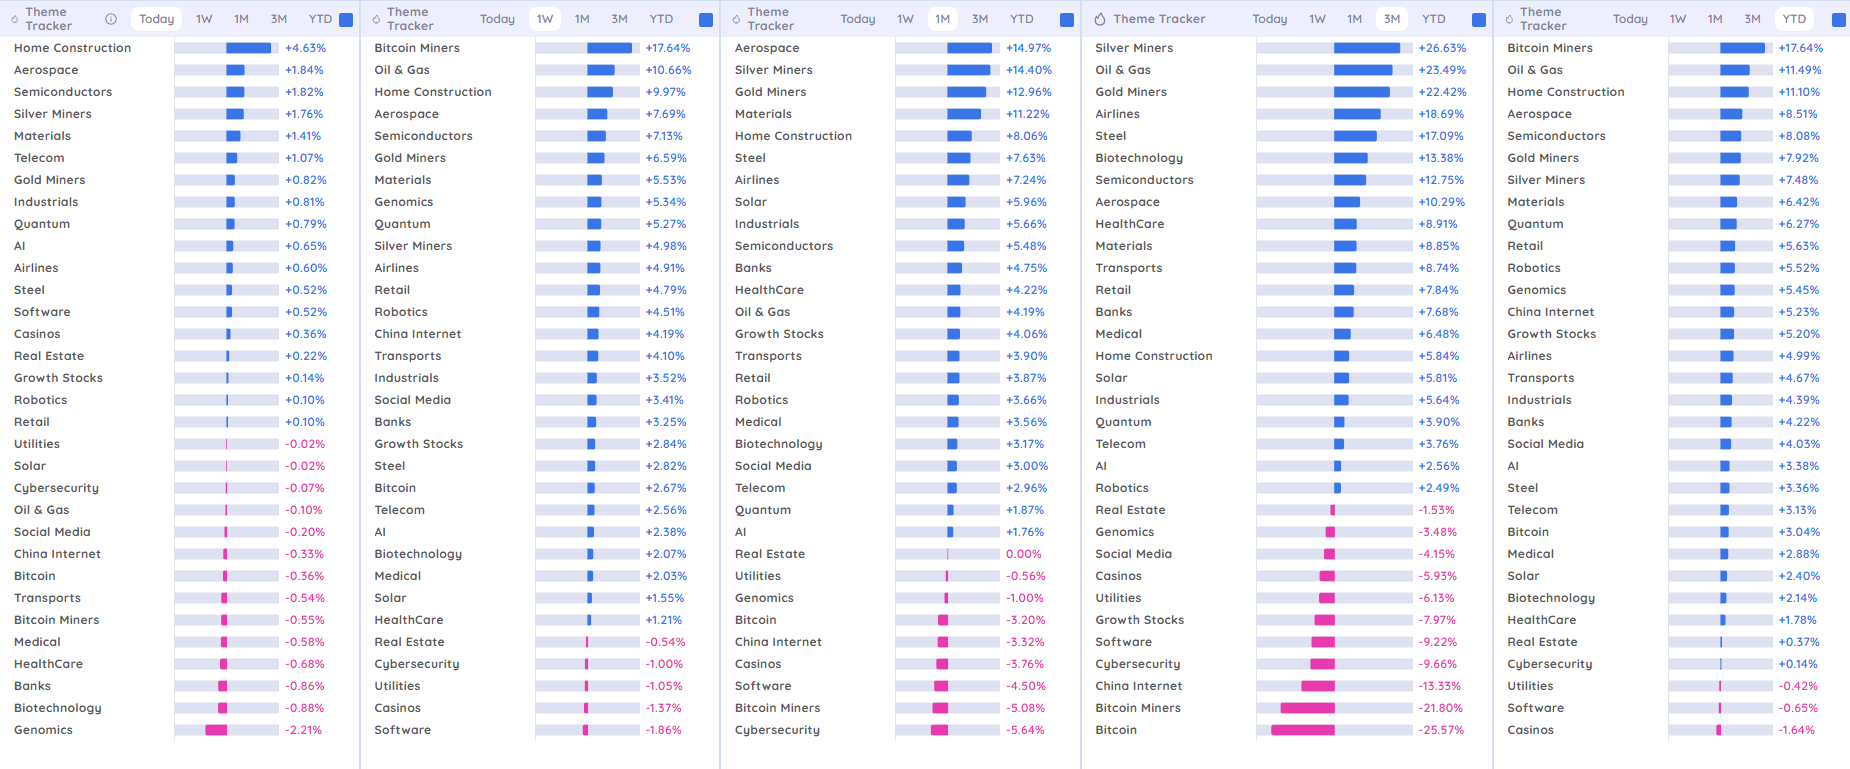
First let’s look at Friday on the far left.
Home Construction leads on the day, followed by Aerospace, Semis, and Silver/Materials, while defensives like Genomics, Biotech, and Banks are at the bottom.
That intraday stack says “early‑cycle / rate‑cut optimism”: housing and cap‑ex sensitive groups are getting bid while long‑duration growth/healthcare lags. Economic data released this past week seems to be leaning traders towards the earlier than later rate cut thesis.
Trading Takeaways for Swings
Long bias: Metals (silver/gold miners), energy (E&Ps, OIH/XOP names), housing, and select industrial/cap‑ex plays align with the multi‑timeframe strength on this board.
Short/avoid bias: Defensive growth (healthcare/biotech/genomics on daily), lagging software/China Internet/Bitcoin on the 1M–YTD views until relative strength and ranks improve.
TradersLab.io Themes
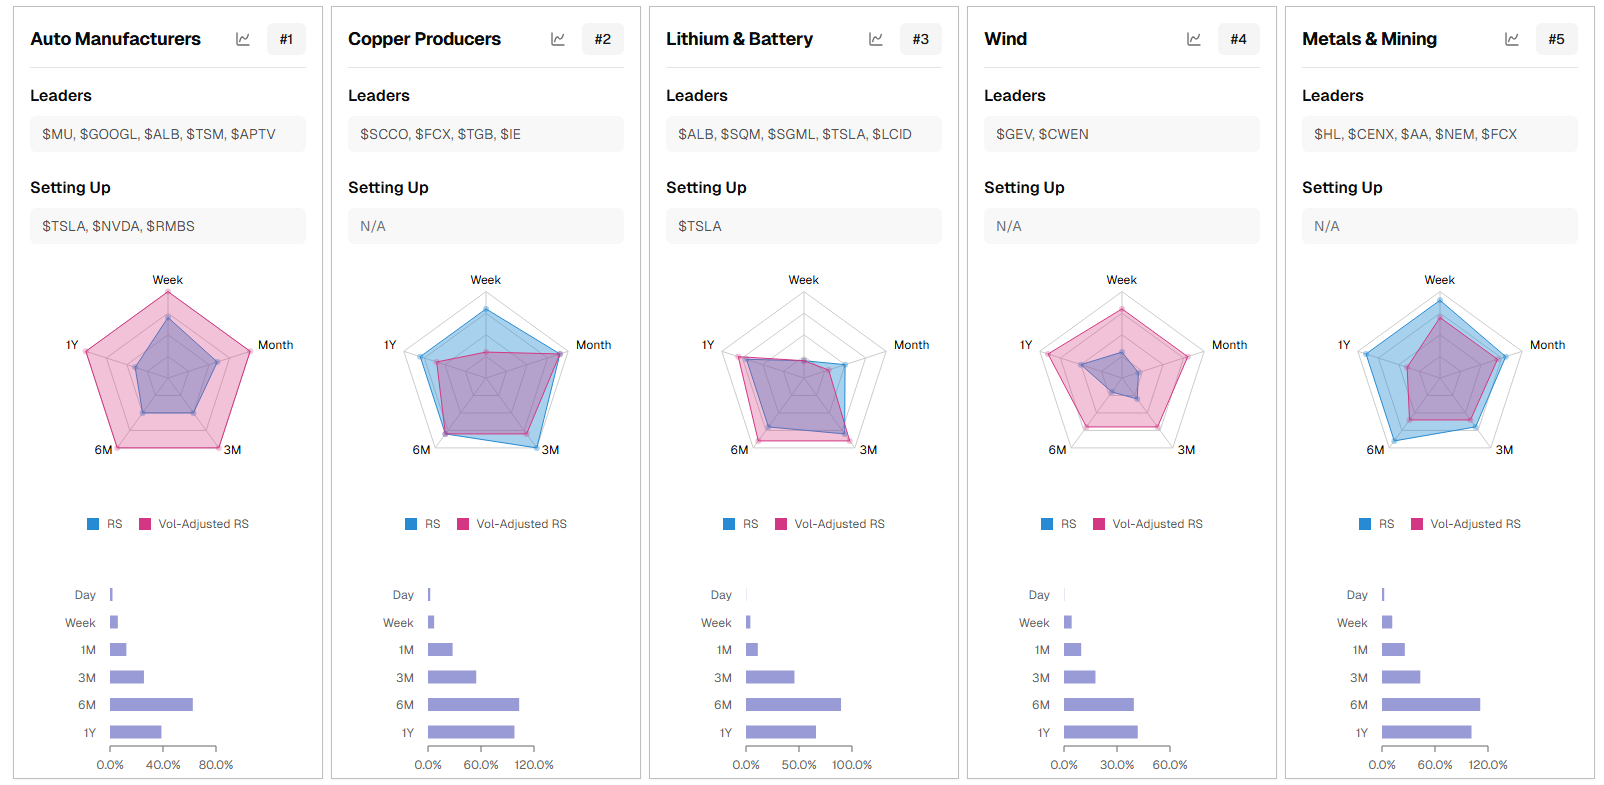
What’s clearly leading
Auto Manufacturers / EV complex: Auto Manufacturers sit at the top of the list with uniformly strong RS across week → 1Y, and volume‑adjusted RS even stronger, which fits with renewed optimism around EV demand into 2026 plus easing rates.
Semis / AI beneficiaries inside themes: MU, NVDA, ASML, LRCX, GOOGL show up repeatedly as “Leaders” across Auto, Robotics, Quantum Computing, and Space panels, confirming that AI infrastructure remains the primary performance engine beneath these themes.
Copper, broad Metals & Mining: Copper Producers and Metals & Mining show broad, balanced RS profiles (all five timeframes lit up), consistent with rising structural demand for copper and critical minerals for data centers, EVs, and grid build‑out.
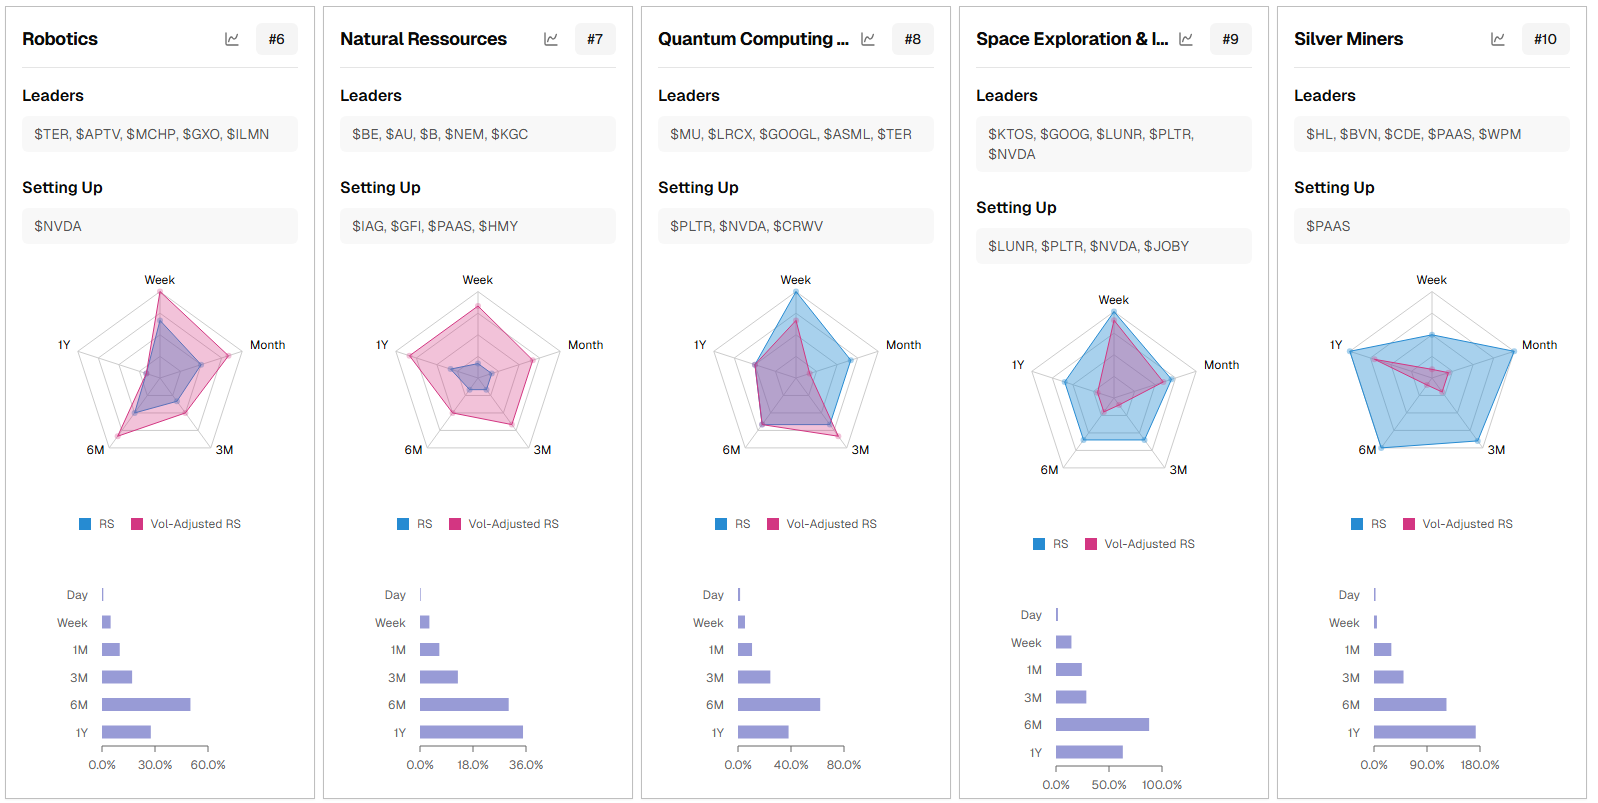
What’s improving or “setting up”
Lithium & Battery: Lithium & Battery has more mixed RS (1Y weaker, shorter‑term improving) with TSLA flagged in both Leaders and Setting Up, which matches a sector that de‑rated in 2024–25 and is now stabilizing into renewed demand from EVs and stationary storage.
Robotics & Wind: Robotics and Wind show solid month–3M RS with slightly less juice on 6M–1Y, i.e., mid‑trend rather than early base‑breakout; they look like secondary beneficiaries of capex and automation rather than the primary leadership group.
Natural Resources (ex‑metals): The Natural Resources card has decent medium‑term RS but less explosive short‑term action, which lines up with a grind‑higher environment in diversified resource names versus the sharper moves in pure‑play copper or silver.
Market Carpet for the week
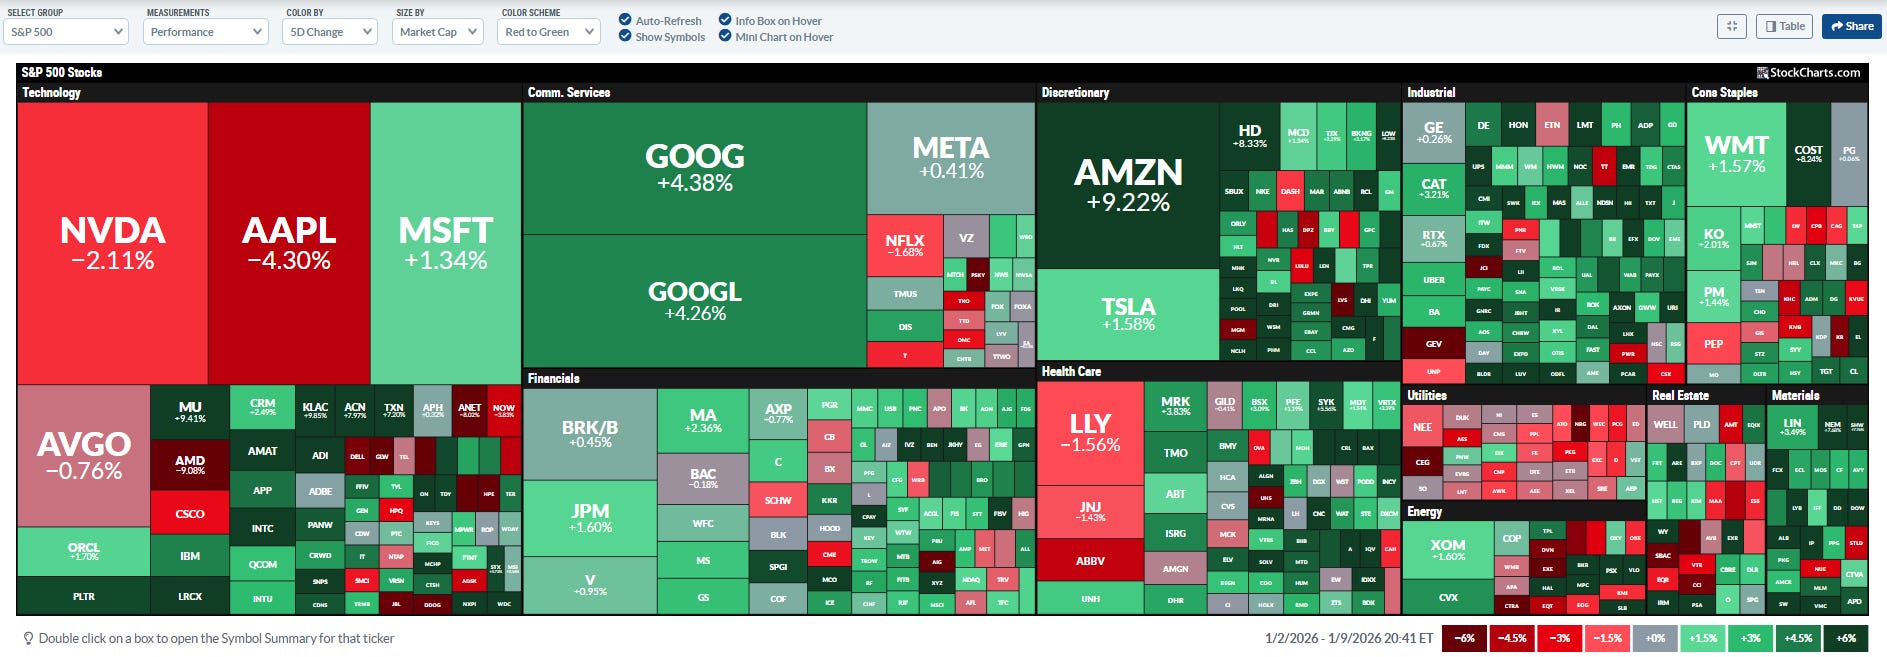
The heatmap shows a strong rotation within the S&P 500 over the last 5 trading days, with mega-cap growth still leading on balance but with notable dispersion under the surface.
Mega-cap tech & comms
Alphabet (GOOG/GOOGL) and Amazon (AMZN) are the clear standouts, both with outsized gains (GOOG/GOOGL ~4%+, AMZN ~9%+), signaling aggressive buying in ad/search and e‑commerce/cloud.
Microsoft (MSFT) is positive, Nvidia (NVDA) and Apple (AAPL) are red, suggesting some profit-taking and factor rotation within the “Magnificent 7” rather than broad risk-off in tech.
Semis and hardware
Micron (MU) and several equipment names (e.g., KLAC, LRCX cluster) are green, contrasting with weakness in AMD and NVDA, hinting at a short-term preference for memory/cycle plays over crowded AI leaders.
Broadcom (AVGO) is only slightly down, which fits a mild consolidation in AI infrastructure after a big run rather than a breakdown.
Consumers: discretionary vs staples
Discretionary is led by AMZN and TSLA green, implying continued risk appetite for growth/consumer cyclicals.
Consumer staples (WMT, KO, PM up) are also green, so defensives are not being sold to fund cyclicals; this looks more like broad participation than a barbell unwind.
Financials, industrials, and cyclicals
Large banks (JPM, BAC, WFC, MA, V) are modestly green, consistent with stable credit/rates expectations and risk-on but not euphoric positioning.
Industrials (GE, CAT, RTX, etc.) show mostly small green moves, aligning with a soft economic-optimism tone rather than an outright reflation spike.
Defensives, health care, and energy
Health care is mixed to slightly negative, with LLY and JNJ red while some smaller names are green, suggesting rotation out of crowded defensives/growth pharma into tech and cyclicals.
Utilities are mostly flat to red, and energy is mixed with XOM slightly up, which matches a backdrop where growth and AI narratives dominate over classic defensives and commodity beta.
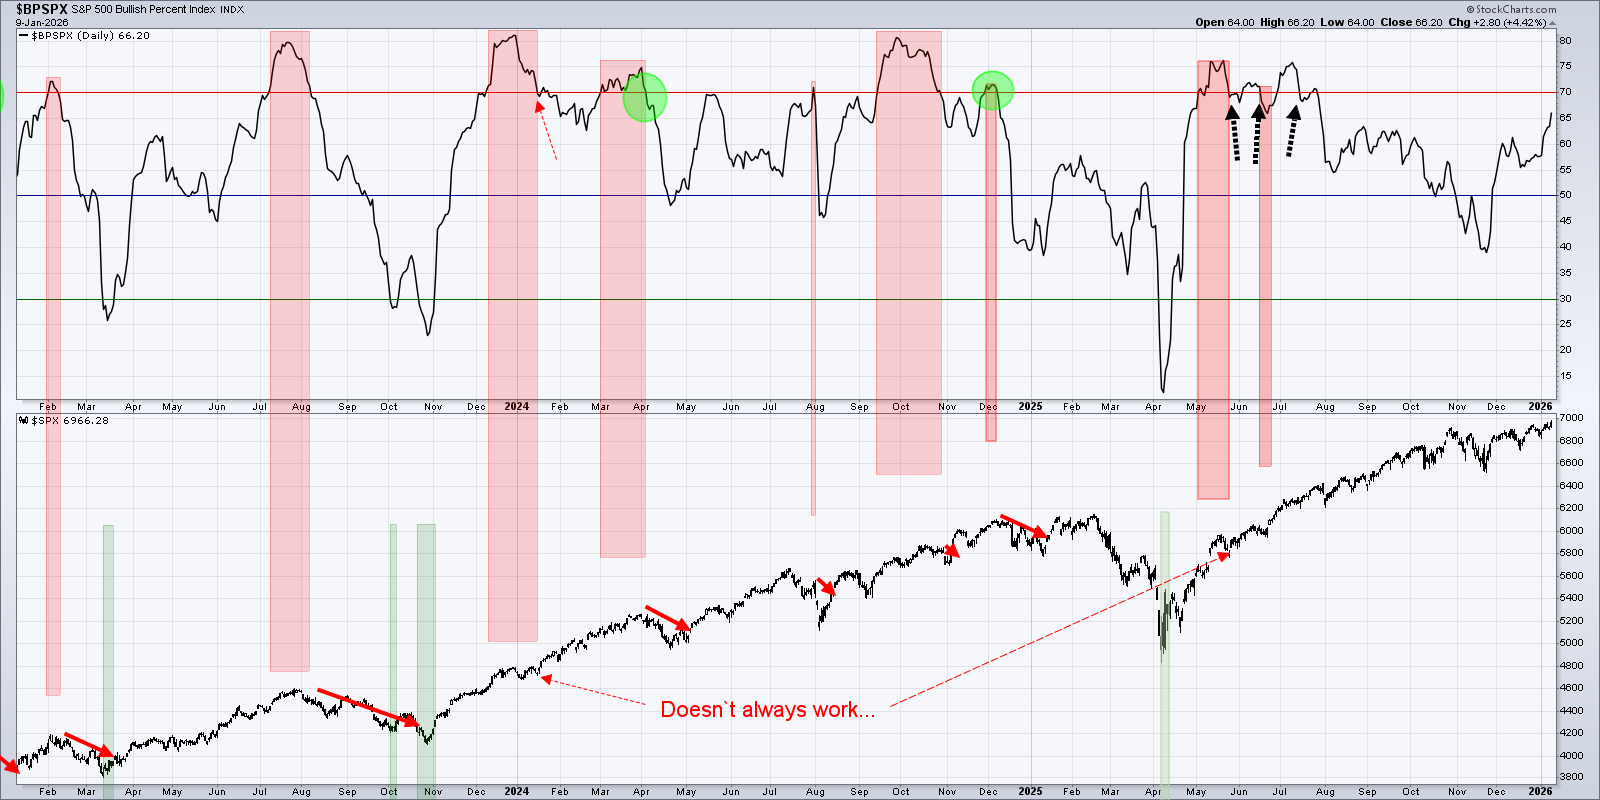
Psych Charts of note
S&P 500 Bullish Percent Index…
Just something to keep an eye on. Not time yet…
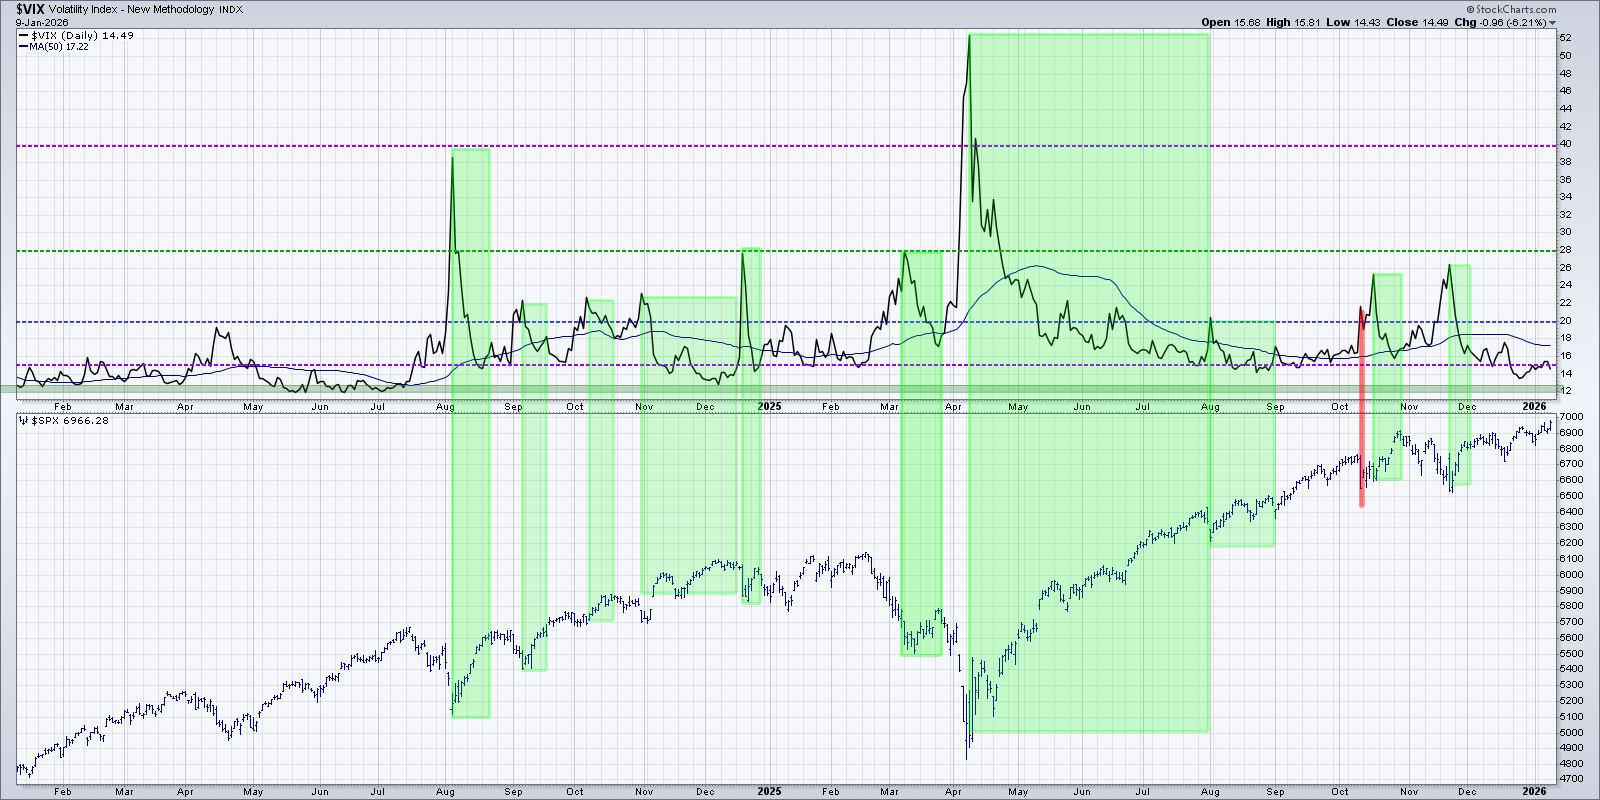
VIX
Continues to show a low volatility environment and that is good for growth plays…
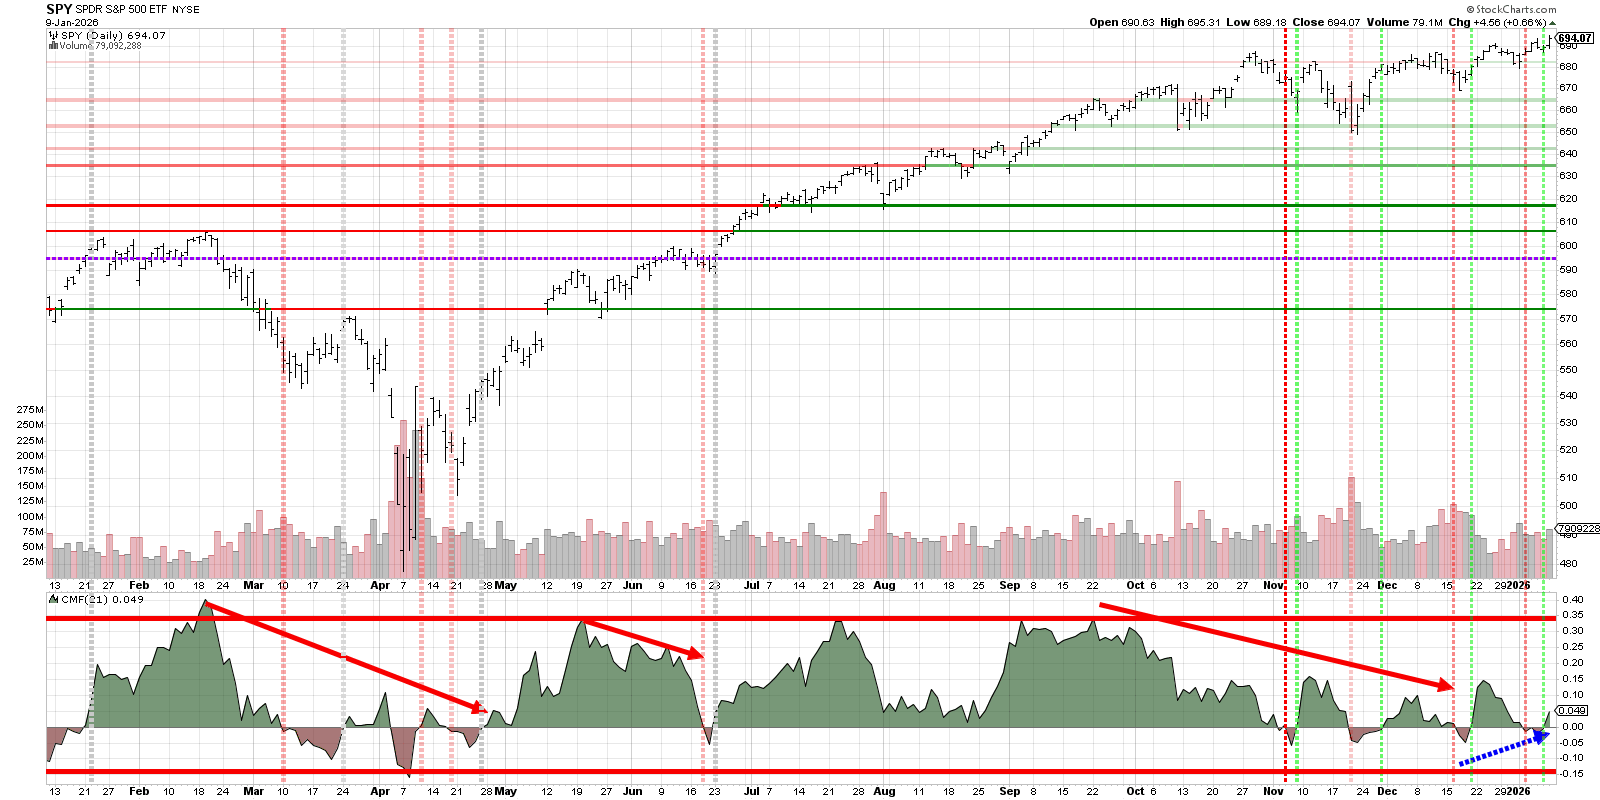
SPY
Back above zero on the CMF… Healthy…
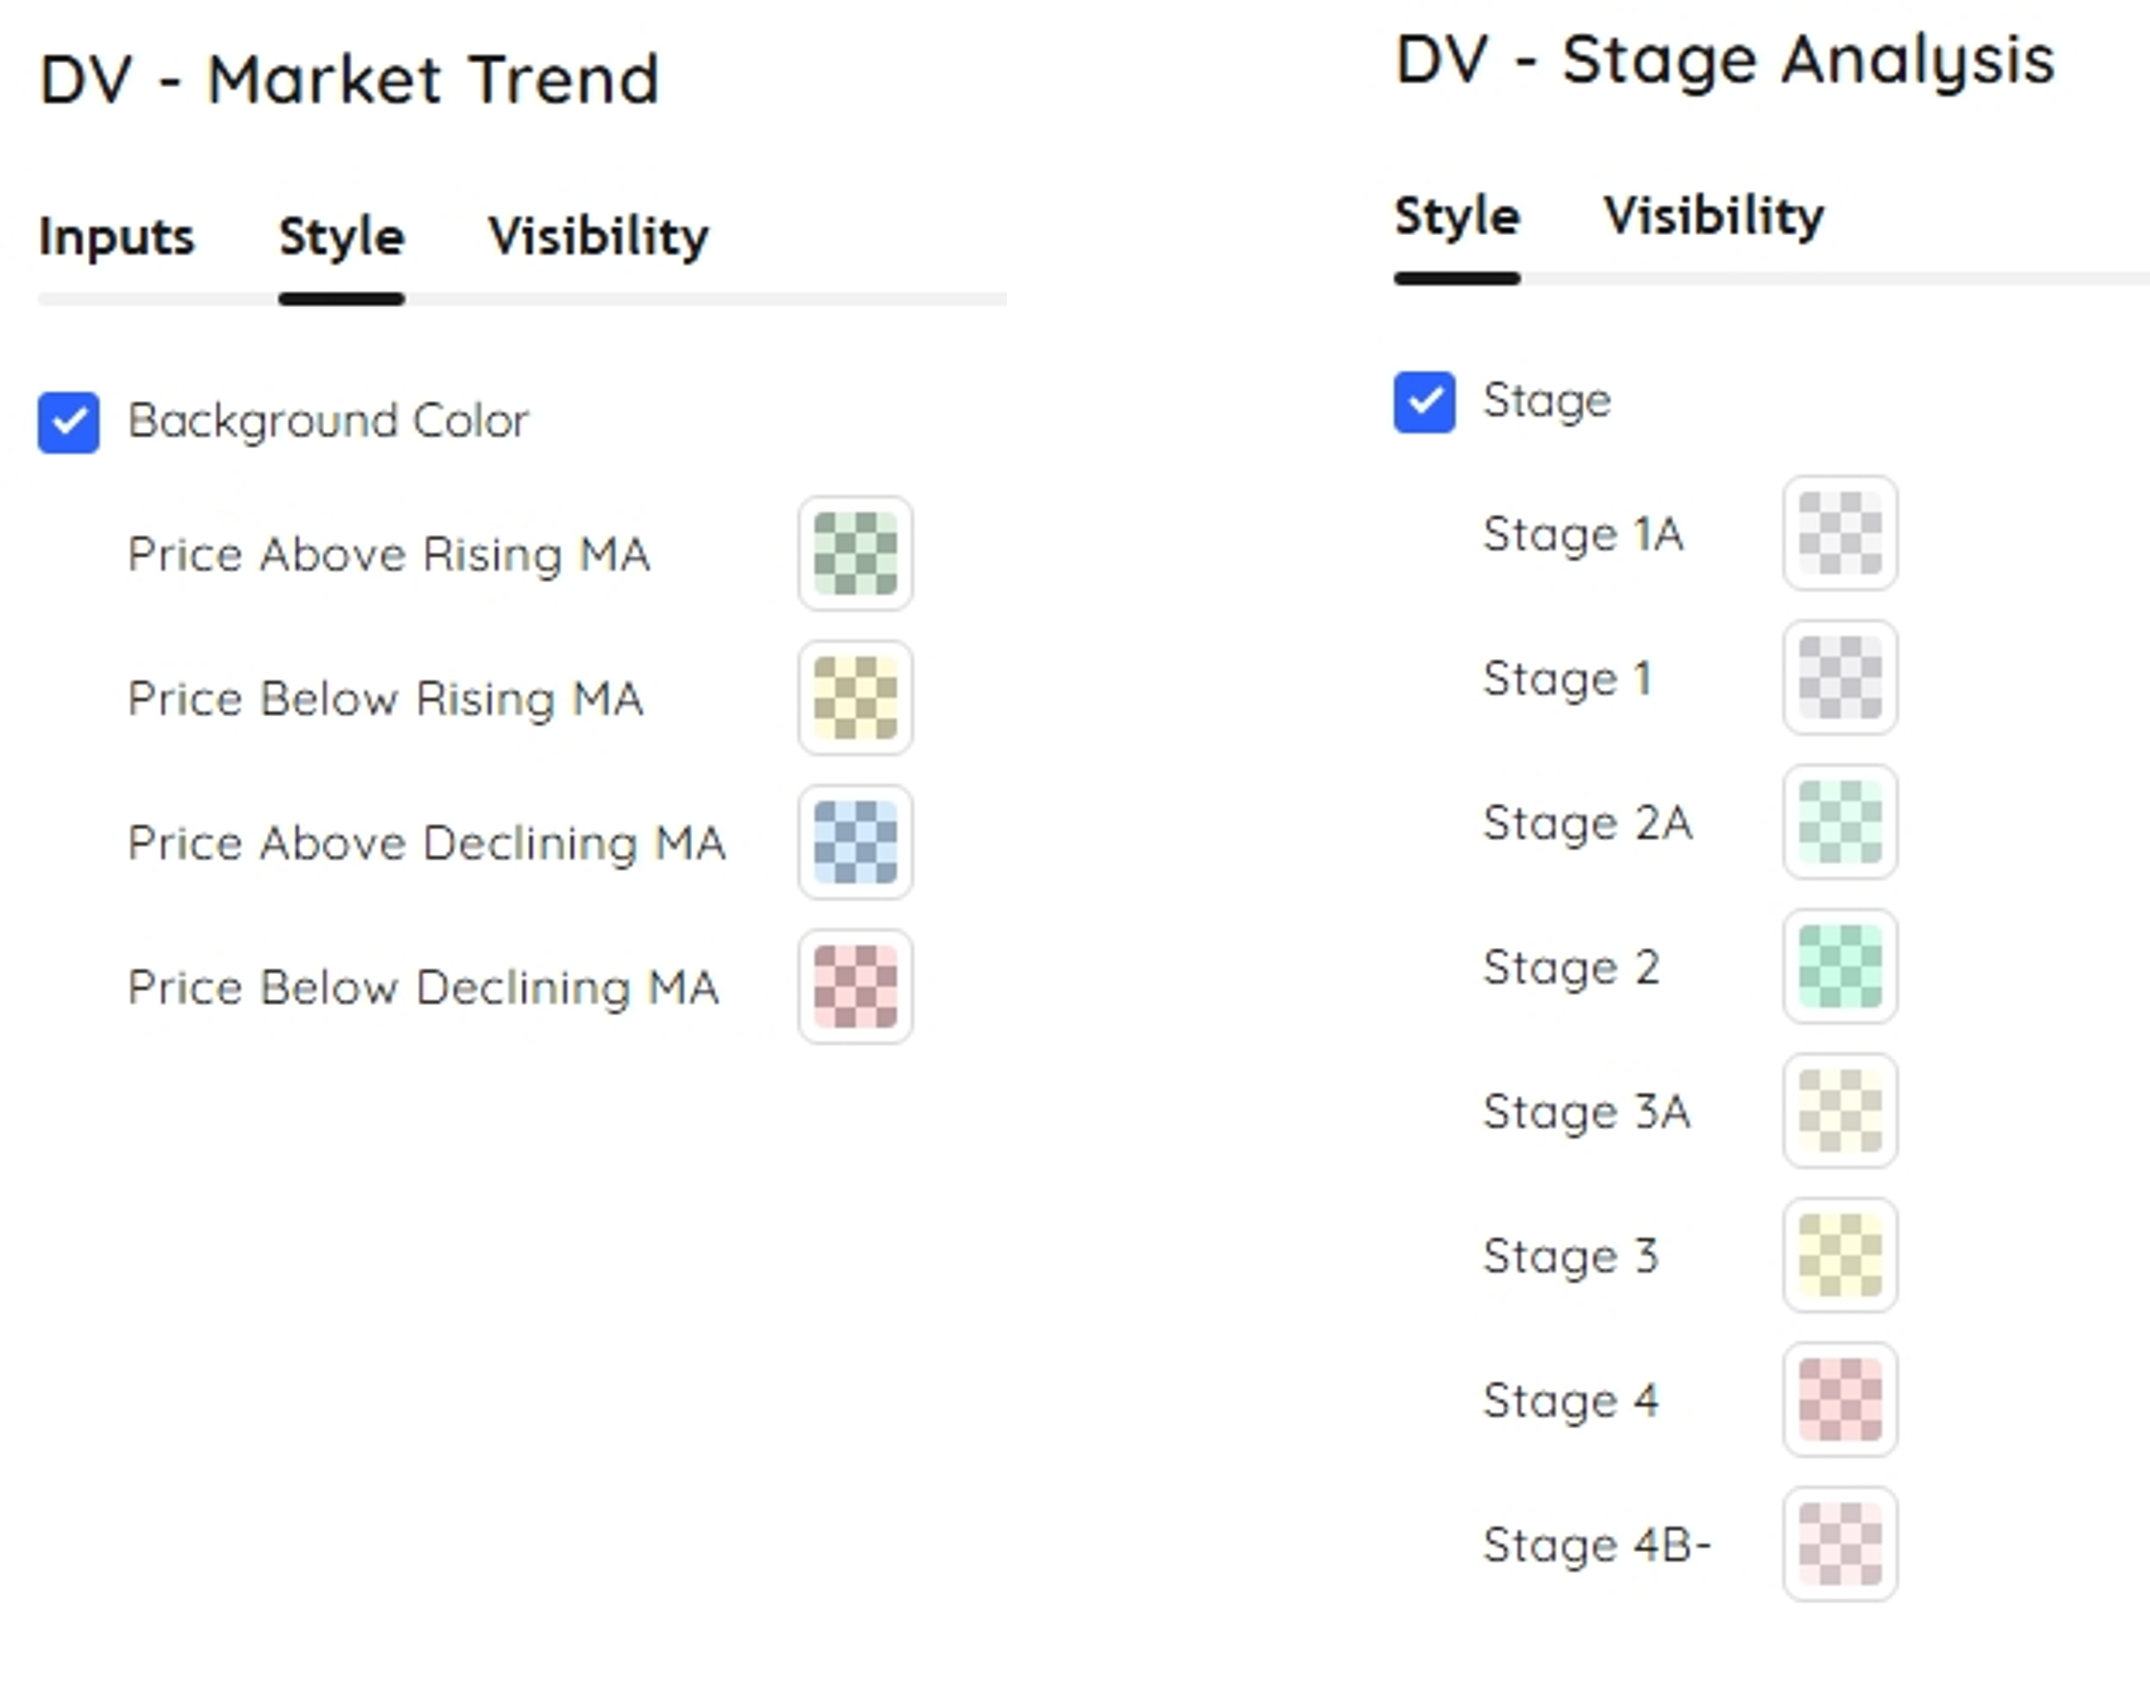
SPY chart with Deepvue market trend analysis
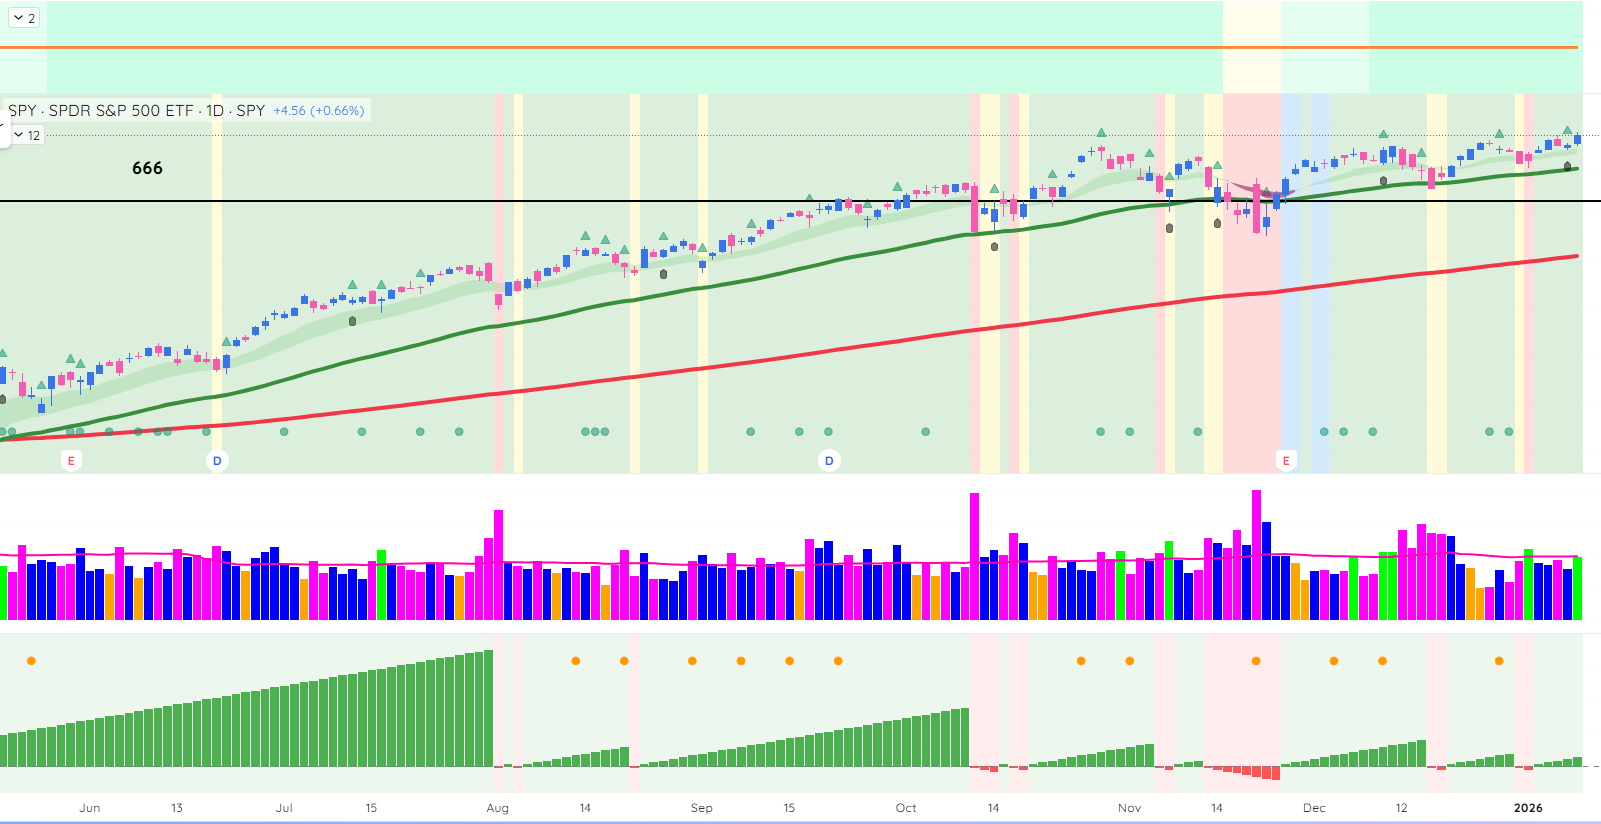
We are Green-Green-Green…
Weekly- Relative Rotation Graph (RRG)
This chart provides a relative strength and momentum snapshot for all S&P sector ETFs against the SPY over the 5-week period.
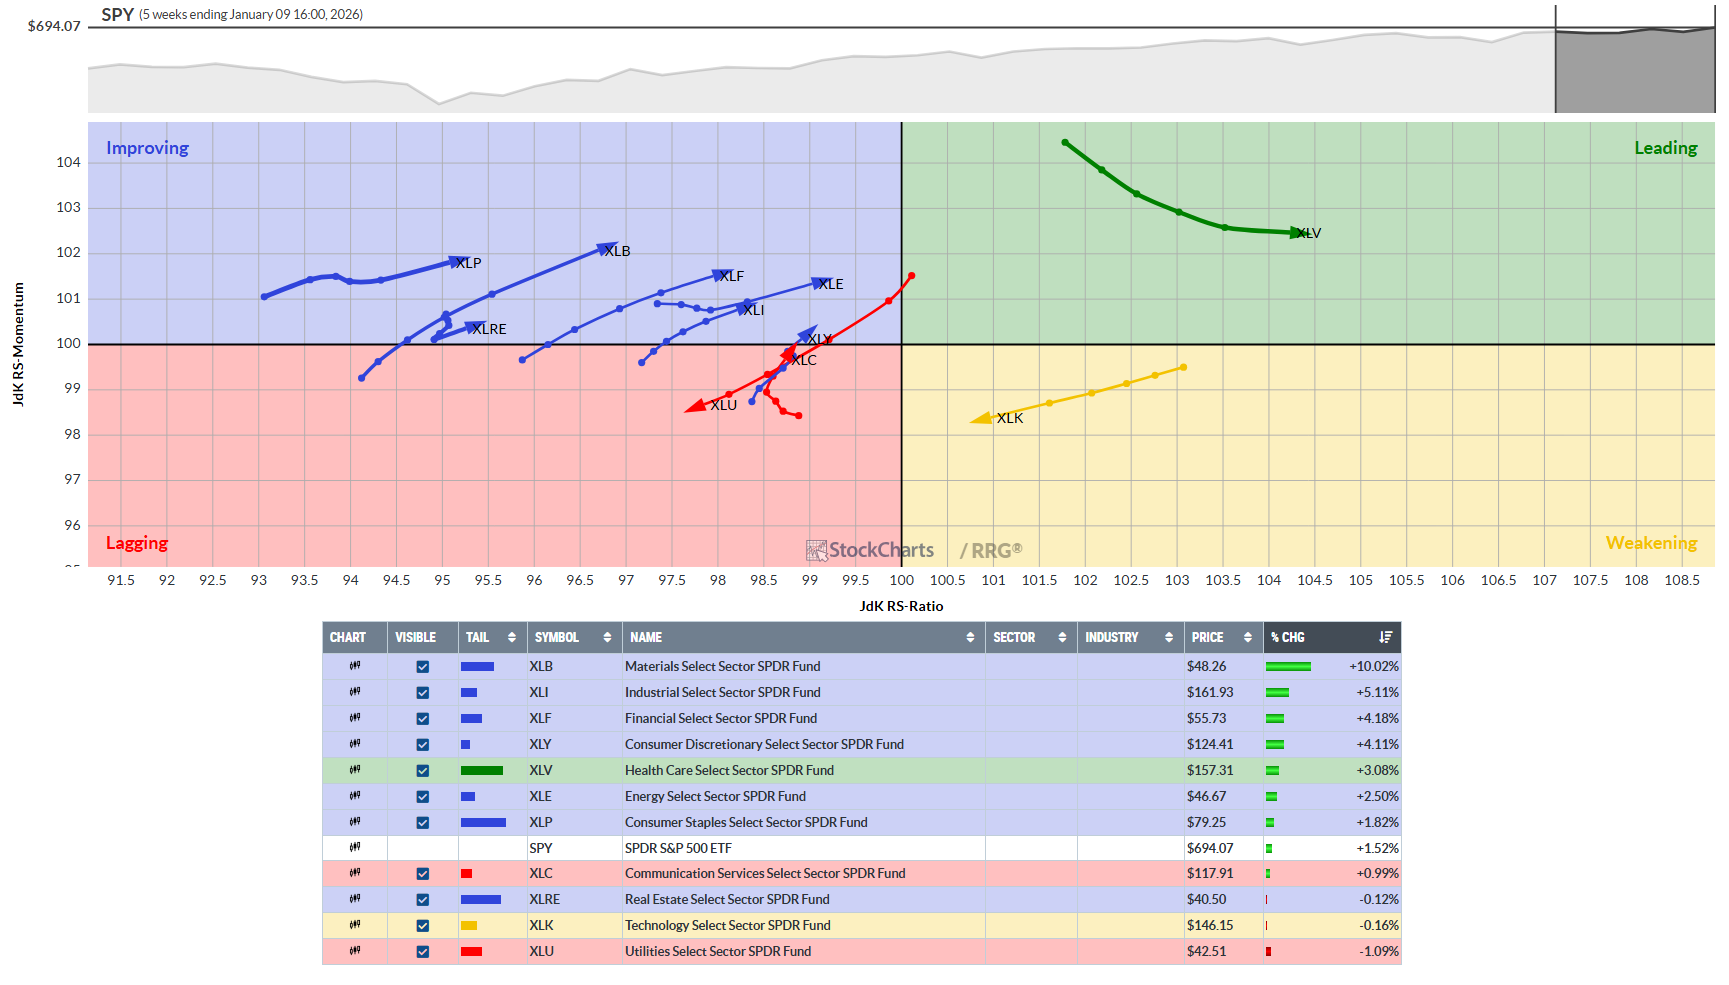
Trading implications for swings
Favor long swings in XLV, XLB, XLI, XLF, XLY, XLP names that also show strong individual relative strength and clear technical patterns (flags, breakouts).
Fade or be selective in XLK, XLC, XLU, XLRE, using them more for short side or pairs against leading sectors if your playbook includes relative value trades.
Before we look further at the S&P 500 sectors, let’s look at the offensive versus defensive chart below…
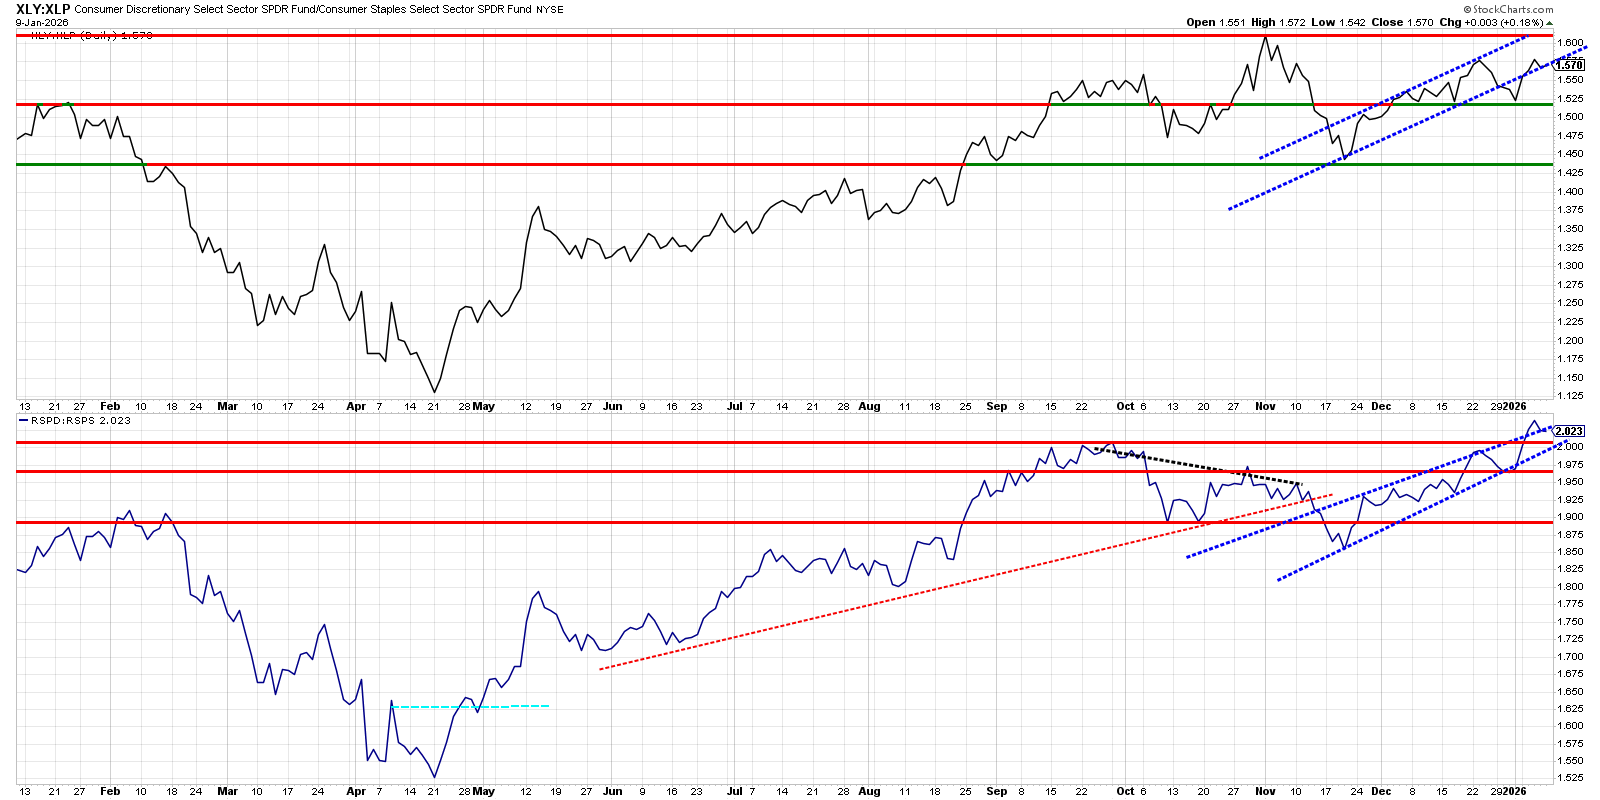
Cross‑signal and swing‑trading takeaways
With both cap‑weighted and equal‑weight ratios trending higher, the message is still risk‑on, but the location at channel highs argues for tightening stops on high‑beta longs and being selective with new exposure.
Growth versus Spy
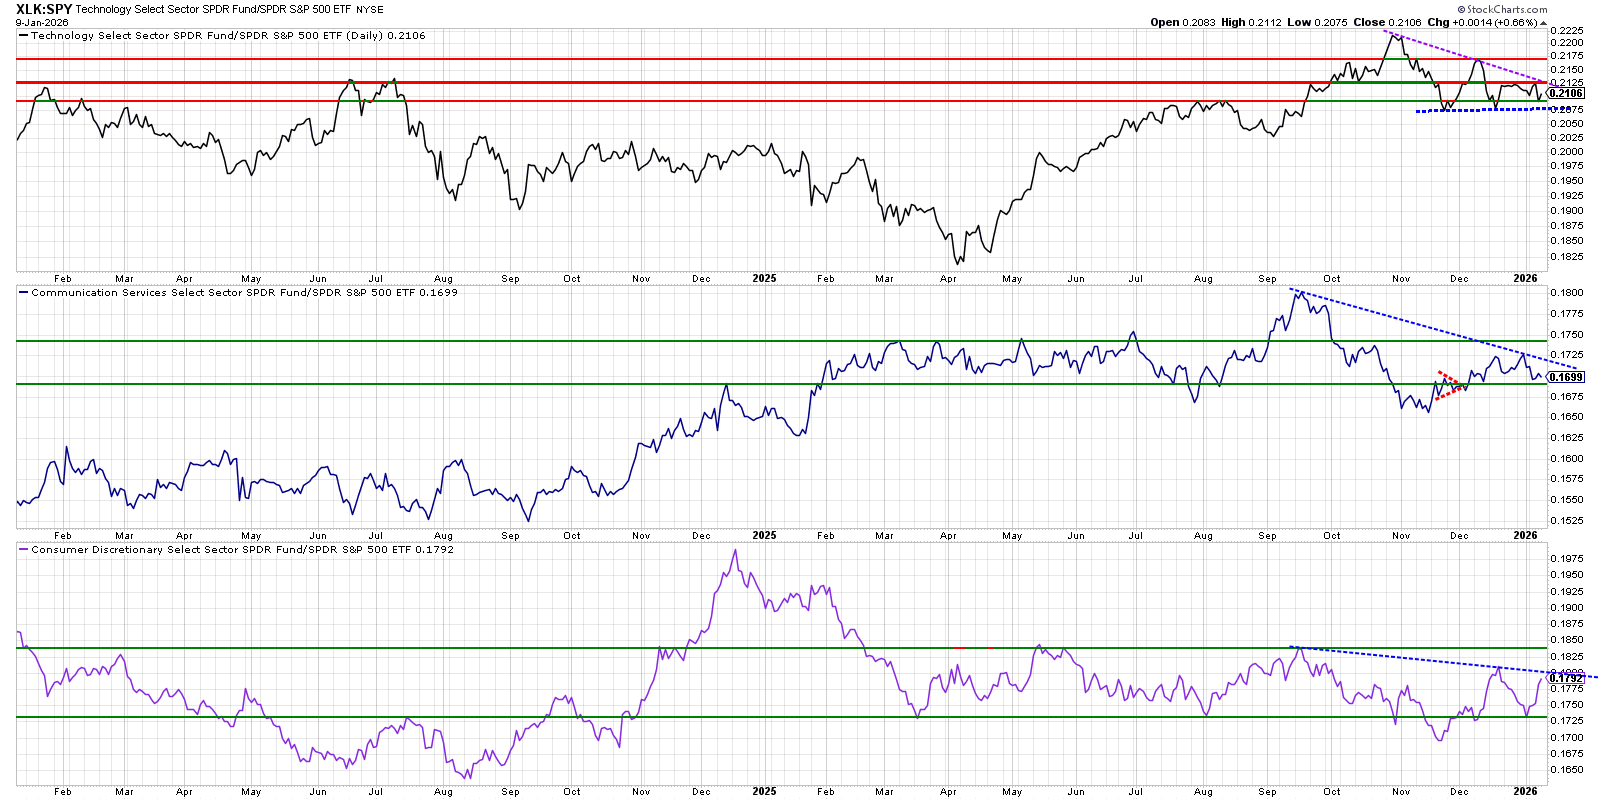
Cross‑sector read‑through
Tech remains the only one of the three with an intact longer‑term uptrend vs SPY, but its short‑term consolidation and lower high warn that leadership is narrowing.
Communications and Discretionary both show distributional patterns vs SPY, which fits a tape where leadership rotates away from high‑beta growth toward other sectors (e.g., value/defensives), favoring more selective long exposure in these groups.
Value versus SPY
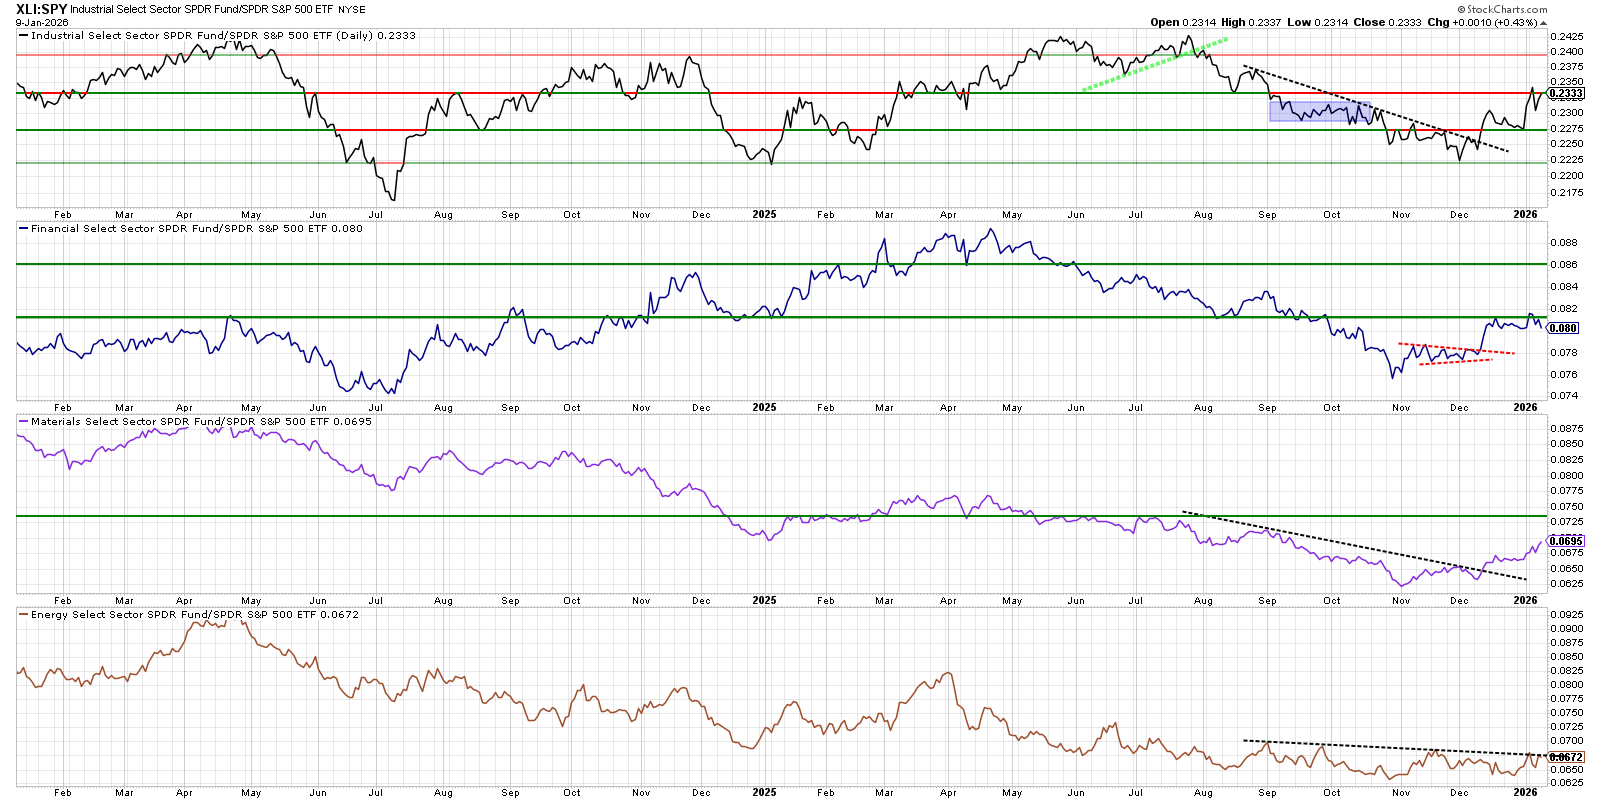
Industrials are leading on a relative basis, while Financials are stabilizing, Materials are attempting a bottom, and Energy remains the weakest but may be basing near lows.
Defensives versus SPY
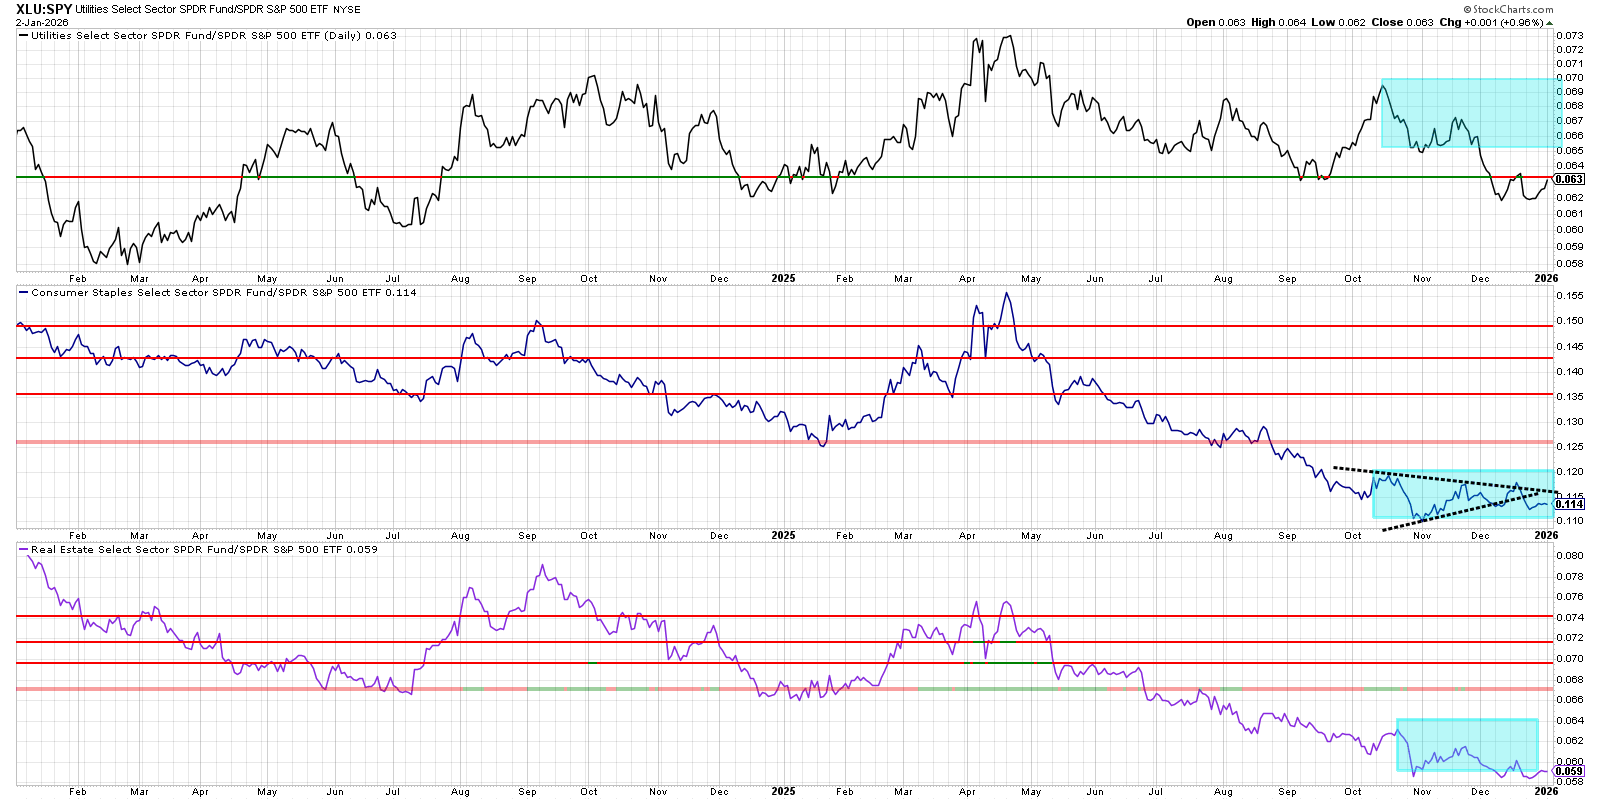
The chart shows all three defensives (Utilities, Staples, Real Estate) still lagging SPY on a relative basis, with only mild stabilization in Staples and continued downtrends in Utilities and Real Estate.
Bullish Relative Rotation Graph (RRG) ETFs of note
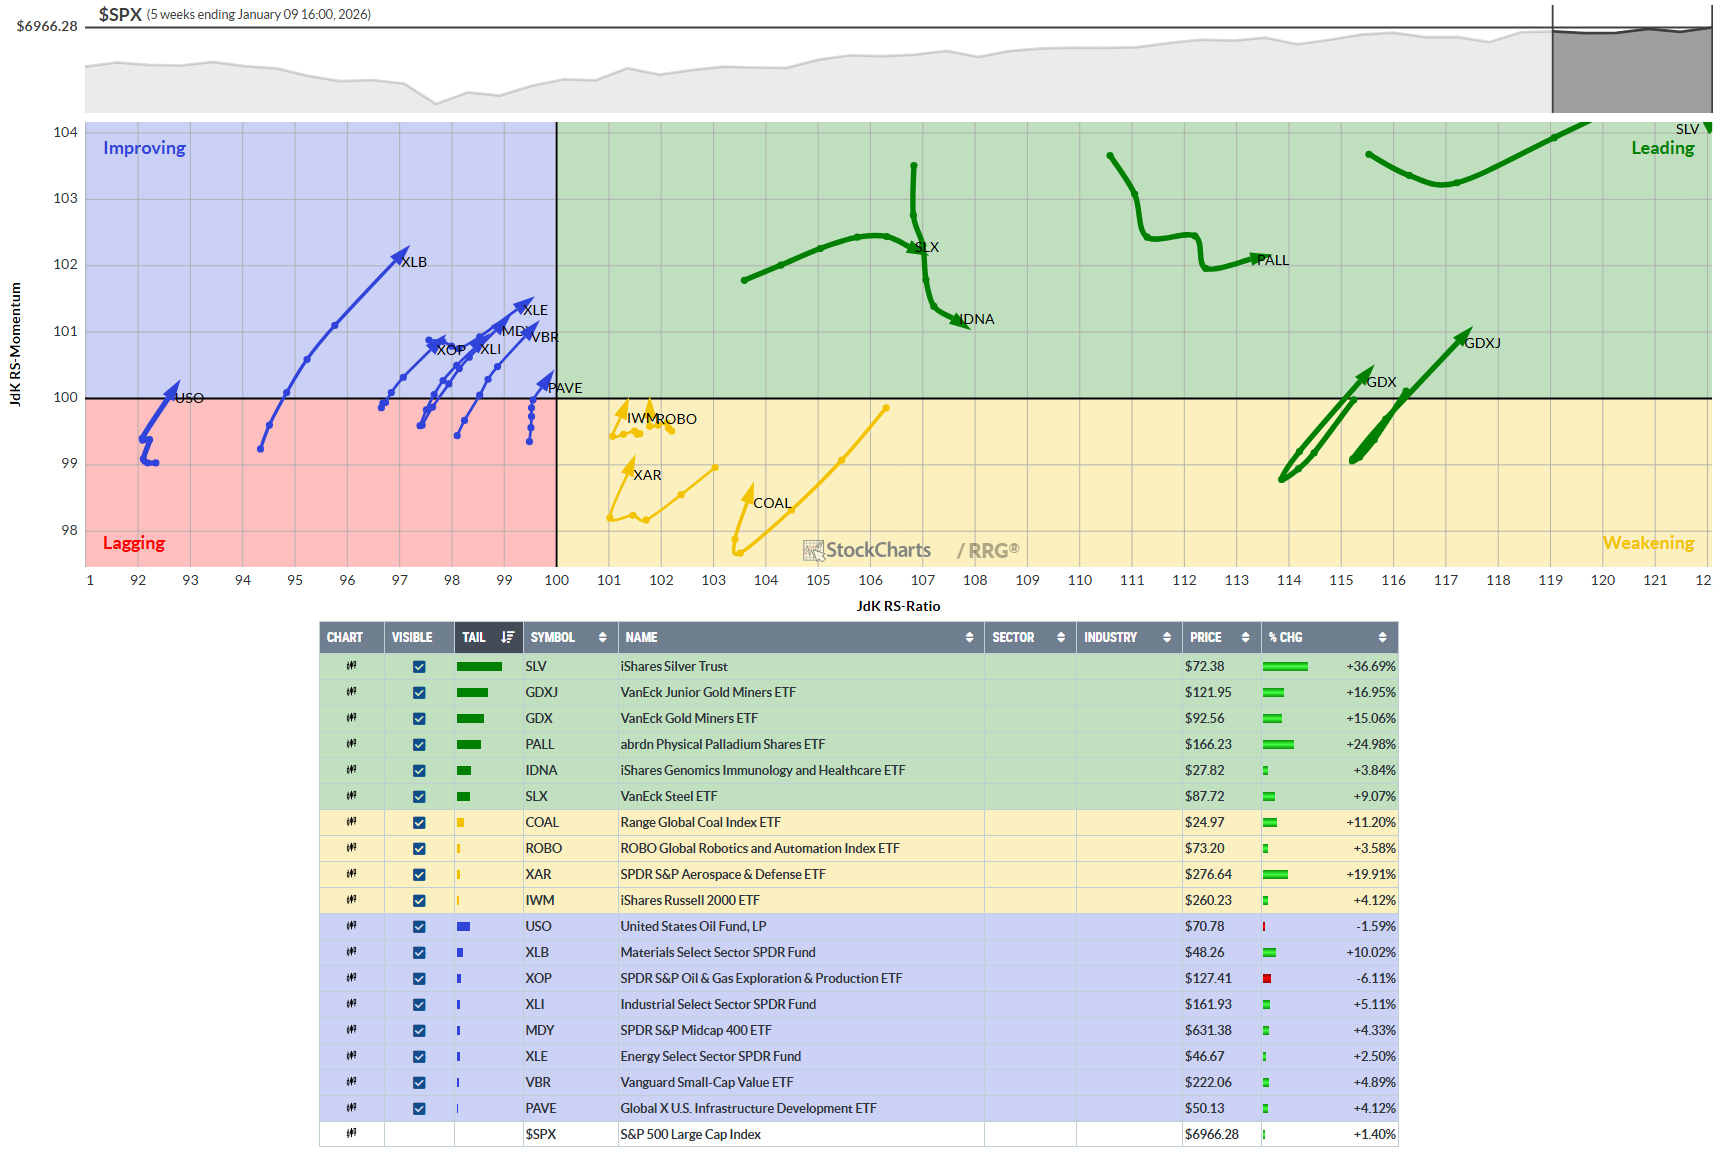
Bullish RRG Tickers: MDY, VBR, XLB, XLI, IDNA, XAR, ROBO, PAVE, IWM, GDX, GDXJ, COAL, USO, XOP, XLE, SLX, SLV, PALL
So, what are swinging?
Auto & EV Complex
Auto and EV remains a primary risk‑on lane, with Tesla still the pace car and GM‑tier suppliers plus auto‑linked semis offering clean 3–10 day continuation out of late‑year momentum bases.
Semis / AI Hardware / Robotics
Semiconductors tied to AI infrastructure, memory, and tools keep printing leadership behavior, with NVDA, MU, TSM, ASML, and MCHP sitting in strong trends supported by persistent AI demand.
Metals, Copper, Silver, Lithium
The metals tape is acting like quiet leadership, with copper, silver miners, and lithium/battery names steadily outrunning the market and building swingable bases that support repeated 3–15 day pushes.
Aerospace, Defense, Space
Defense and space are still a funded trend, with KTOS, GD and space‑adjacent names like LUNR, PLTR, JOBY riding contract flow and modernization spend, giving reliable continuation structure.
Homebuilders & Cyclical Industrials
Home construction and related cyclicals are re‑emerging as a stealth theme, with homebuilders and industrials holding firm multi‑week bases as stabilized rates keep a floor under housing‑linked demand.
Bullish Relative Rotation Graph (RRG) tickers
Tickers: ISRG, C, LGN, INDV, GM, IAC, TSEM, RNA, VERA, CDTX, PLAB, VIAV, COMM, MTSI, RDDT, VZ, APH
Setups for Monday: Unfortunately, nothing is setup…
The best looking one is PLAB from the semis theme…
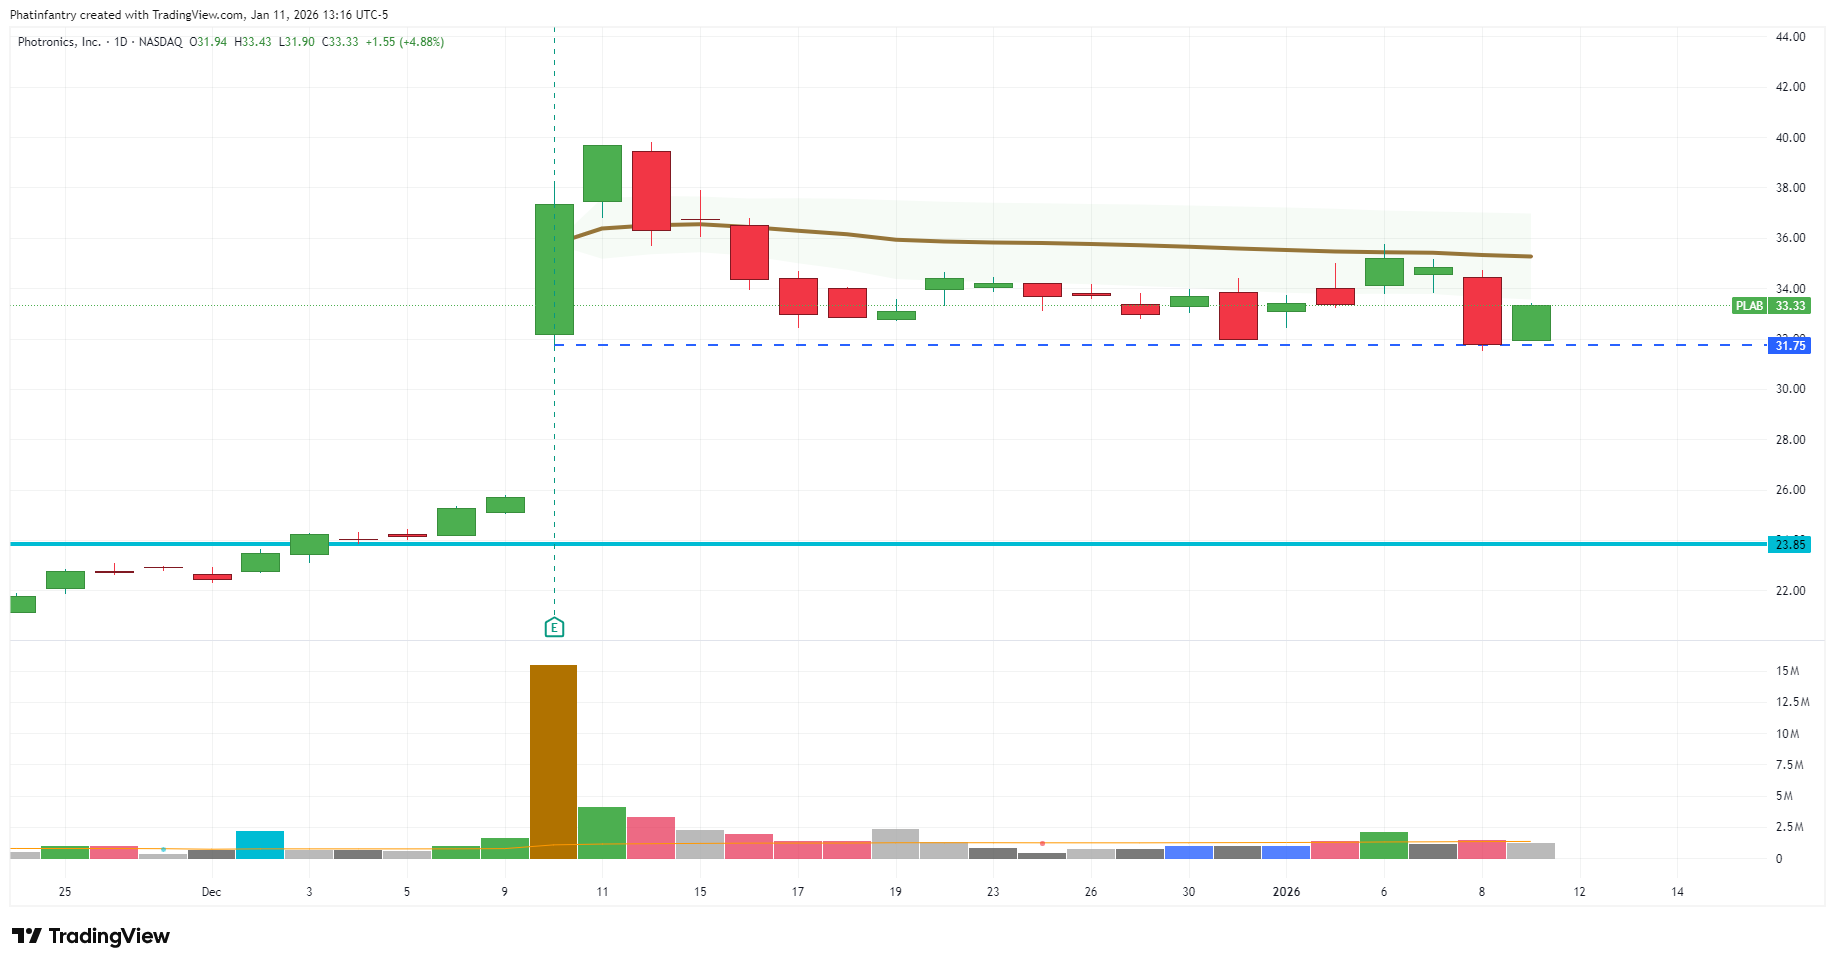
PLAB is a power earnings gap (PEG) play… Risk can be managed just under the mother bar right at the low of day from the PEG day as well. Nice confluence. If we lose or gap down through the low of the PEG day on Monday, watch for a reclaim on volume. If we break to the upside of the inside bar on intraday volume Monday, that is the trigger. Remember things like overall market direction and SOX relative strength all matter too.
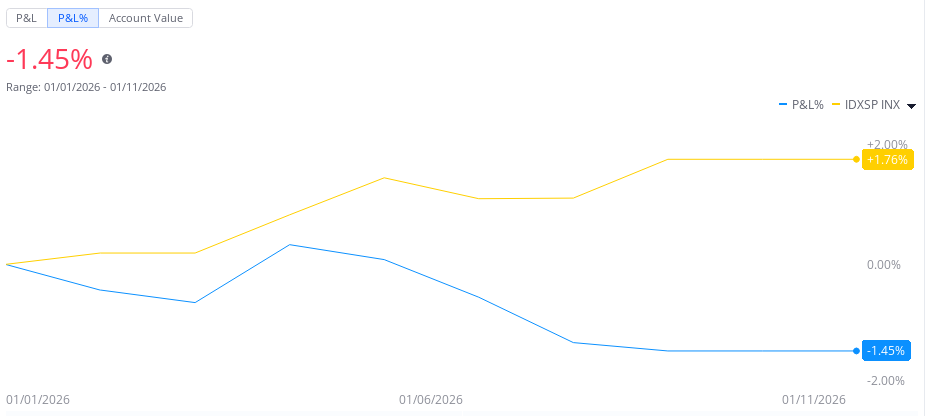
Thoughts this week: Finished even basically on the week. Took a few big swings when ISRG got good lift. Should have just stayed with my alerts… That’s ok, we have a long year ahead…
You can do it, Keep Studying!
Most others don’t post their YTD because they can’t or frankly, they are lying. You better make sure, or you might lose it all…
Stock Talk Insiders discord
If you like this Phat Swing Plan, and you would like to receive alerts for my trades, click this link for the discord Stock Talk Insiders discord and enter the promo code: PHAT to get 10% off all packages for life...

Follow my alerts on Stock Talk Insiders discord Enter code: PHAT for 10% off
Follow my Phatstack for my Phat Swing Plan and updates during the week.
Follow me on X Phatinfantry Trading @Phatinfantry where I post/talk crap when I drink wine and make fun of dumb things.
Follow me on YouTube where I go through my process and review charts Phatinfantry
Thank you for the RR graphs this week. Verry much appreciated.