
Phat Swing Plans and Observations
For the week of 10/20/25

Everybody always talking about “Don’t show your profits to your wife”. I worry more about her seeing the losses…

Market Summary for the week
U.S. markets ended the week of October 13–18, 2025, with solid gains after a volatile start dominated by bank credit concerns and renewed U.S.–China trade fears. Optimism returned late in the week when President Trump signaled talks with China were “back on track.”
Major Index Performance
Wall Street posted a strong comeback in the latter half of the week:
S&P 500 gained 1.7% to close at 6,664.01
Dow Jones Industrial Average rose 1.6% to 46,190.61
Nasdaq Composite surged 2.1% to 22,679.97
Russell 2000 added 2.4% to 2,452.17.
Market Drivers
Trading was dominated by two main narratives — regional bank stress and China trade tensions. Early in the week, markets were pressured after two regional banks disclosed problematic loans, sparking fears about credit quality across smaller lenders. Sentiment stabilized after better-than-expected earnings from Truist Financial, Huntington Bancshares, and Fifth Third Bancorp, which showed that broader financial health remained resilient.
Meanwhile, President Trump’s midweek comments about possible 100% tariffs on Chinese imports initially rattled markets, but his Friday remarks that these tariffs were “not sustainable” for either economy eased investor anxiety and fueled a strong rebound.
Sector Highlights
Technology and consumer discretionary stocks led gains thanks to ongoing enthusiasm around AI and semiconductor names, while financials rebounded late in the week. The energy sector remained relatively flat amid mixed oil price action. Defensive sectors such as utilities and health care were laggards as risk appetite improved.
Economic and Earnings Backdrop
Investors digested a heavy slate of corporate earnings, mostly from financials, which showed better credit discipline than feared. Inflation data earlier in the month suggested moderating price pressures, supporting expectations that the Federal Reserve might maintain its cautious stance.
Upcoming macro focus includes industrial production data and updates from housing and retail sectors expected next week.
Summary
The week closed on a positive note across all major indexes, marking a return to bullish momentum after two weeks of whipsaw volatility. Market confidence improved as fears over bank credit risk subsided and trade relations hinted at stabilization.
Notable Movers
The week of October 13–18, 2025, featured several major stock movers driven by strong tech earnings, speculative runs in biotech and energy small caps, and relief after easing bank-sector fears. Below is a breakdown of standout performers and laggards across the week.
Top Gainers
Australian Oilseeds Holdings (COOT, COOTW): Warrants surged over 321%, and common shares rose 173% after the company announced a major export contract with a Chinese biodiesel producer.
Genprex (GNPX): Gained 232% following FDA clearance to initiate Phase 2 trials for its gene therapy for lung cancer.
enGene Holdings (ENGN, ENGNW): Jumped more than 215% on positive trial data for its gene therapy delivery tech.
Omeros Corp. (OMER): Rose 154% as analysts upgraded it after strong quarterly results and promising pipeline updates.
Liberty Energy (LBRT): Up 28% this week on improved rig activity and rising oilfield service demand.
Disc Medicine (IRON): Climbed nearly 21% after reporting better-than-expected revenues and a strong guidance revision.
AppLovin (APP): Up 7% after regulatory overhangs faded, recovering losses from the prior week’s SEC investigation news.
Advanced Micro Devices (AMD): Rose another 4% after a 24% earlier surge tied to a multibillion-dollar chip deal with OpenAI.
Notable Decliners
Yueda Digital Holdings (YDKG): Collapsed 86%, hit by liquidity concerns and disclosure issues tied to its Hong Kong affiliate.
Aqua Metals (AQMS): Dropped 53% as investors took profits following an earlier speculative rally in battery recycling stocks.
Electra Battery Materials (ELBM): Fell 51% amid soft cobalt prices and funding delays for its Ontario refinery project.
Pixelworks (PXLW): Down 48% on weaker display-chip sales projection.
Largo Inc. (LGO): Declined 43% as vanadium prices slumped and Q3 production forecasts were cut.
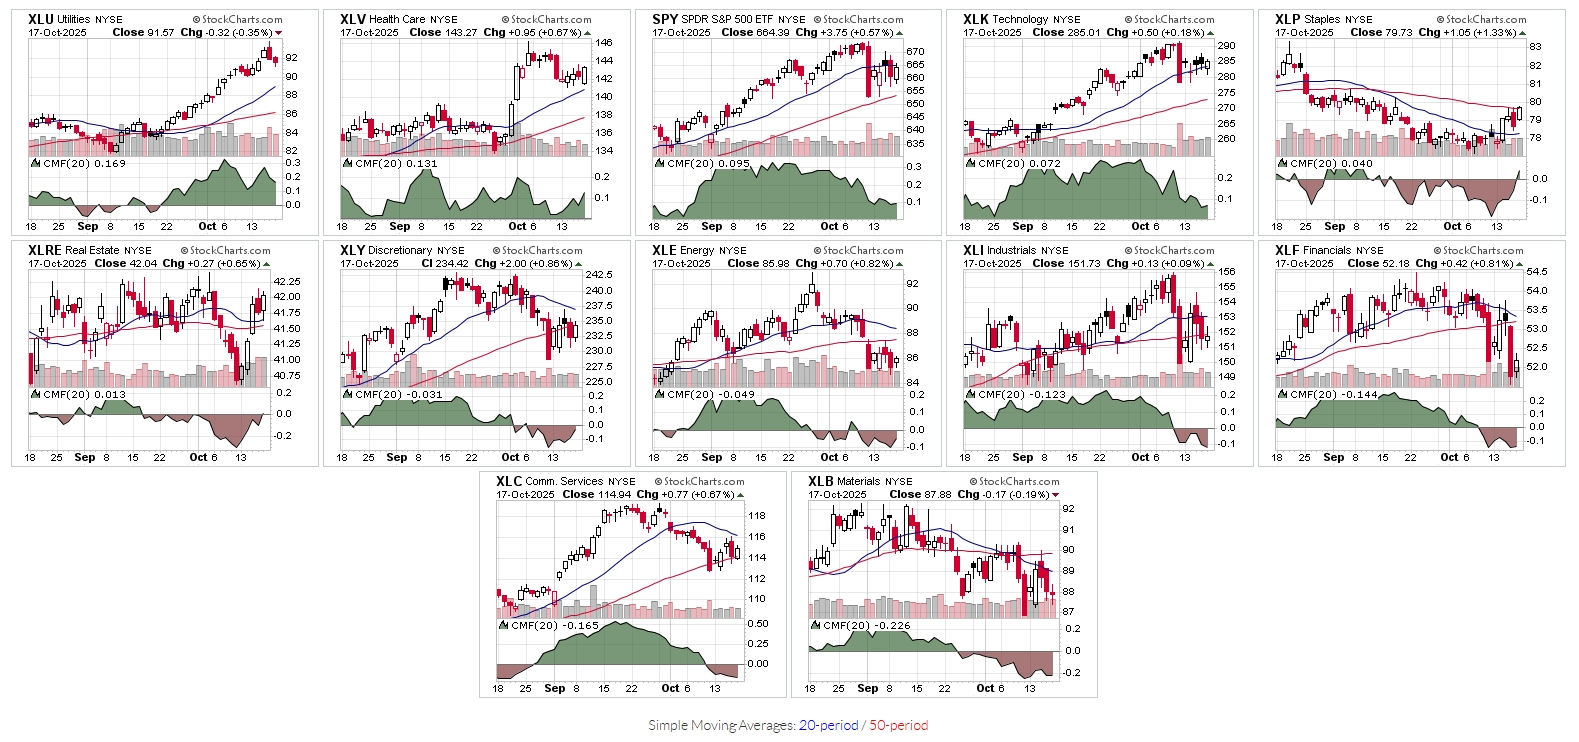
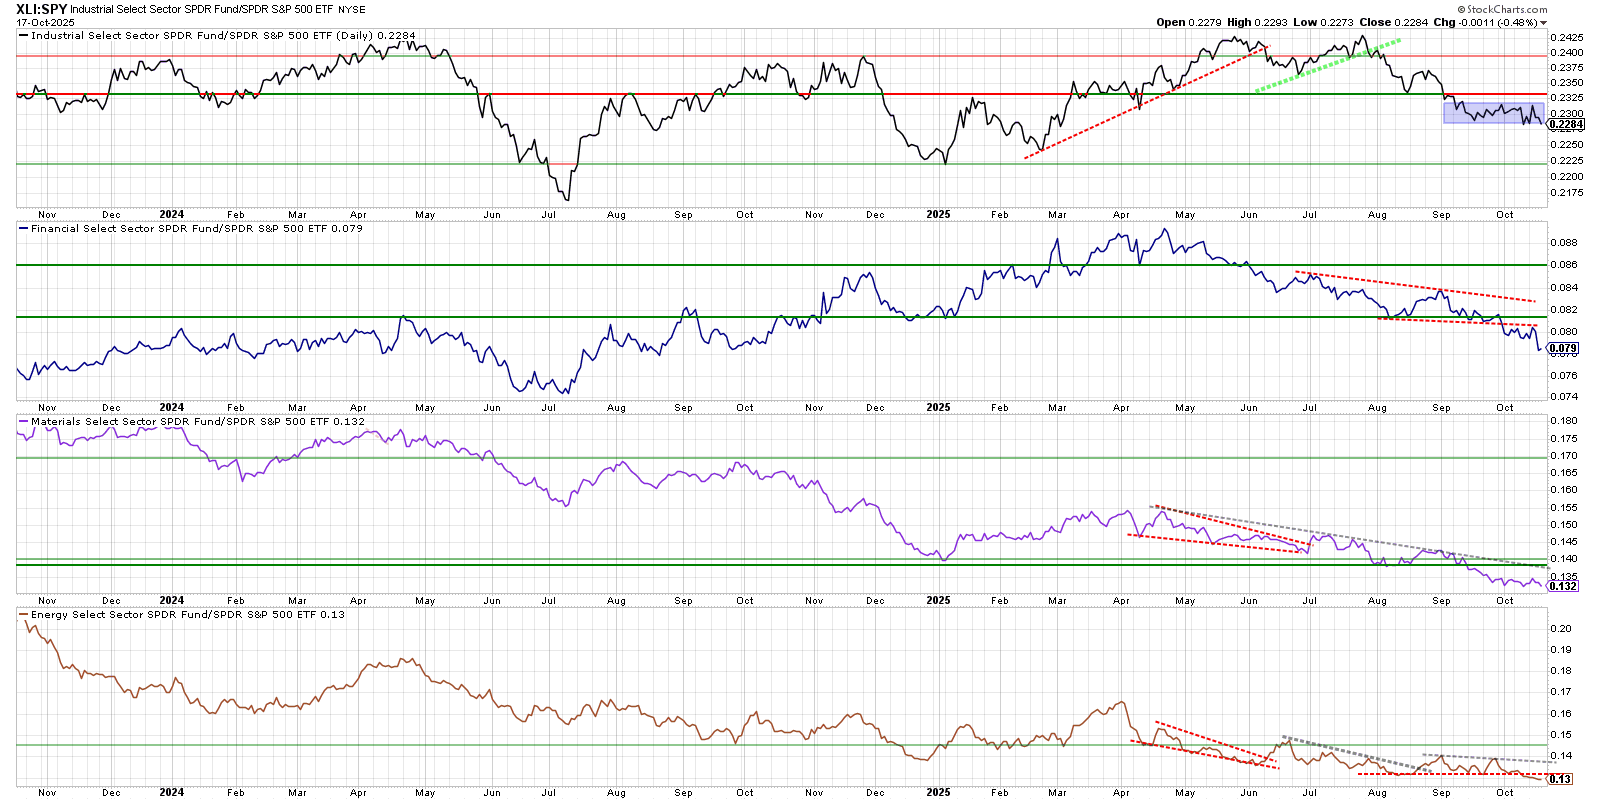
Sectors sorted by Chaikin Money Flow Weighted:
XLU #1 as noted the past several weeks…
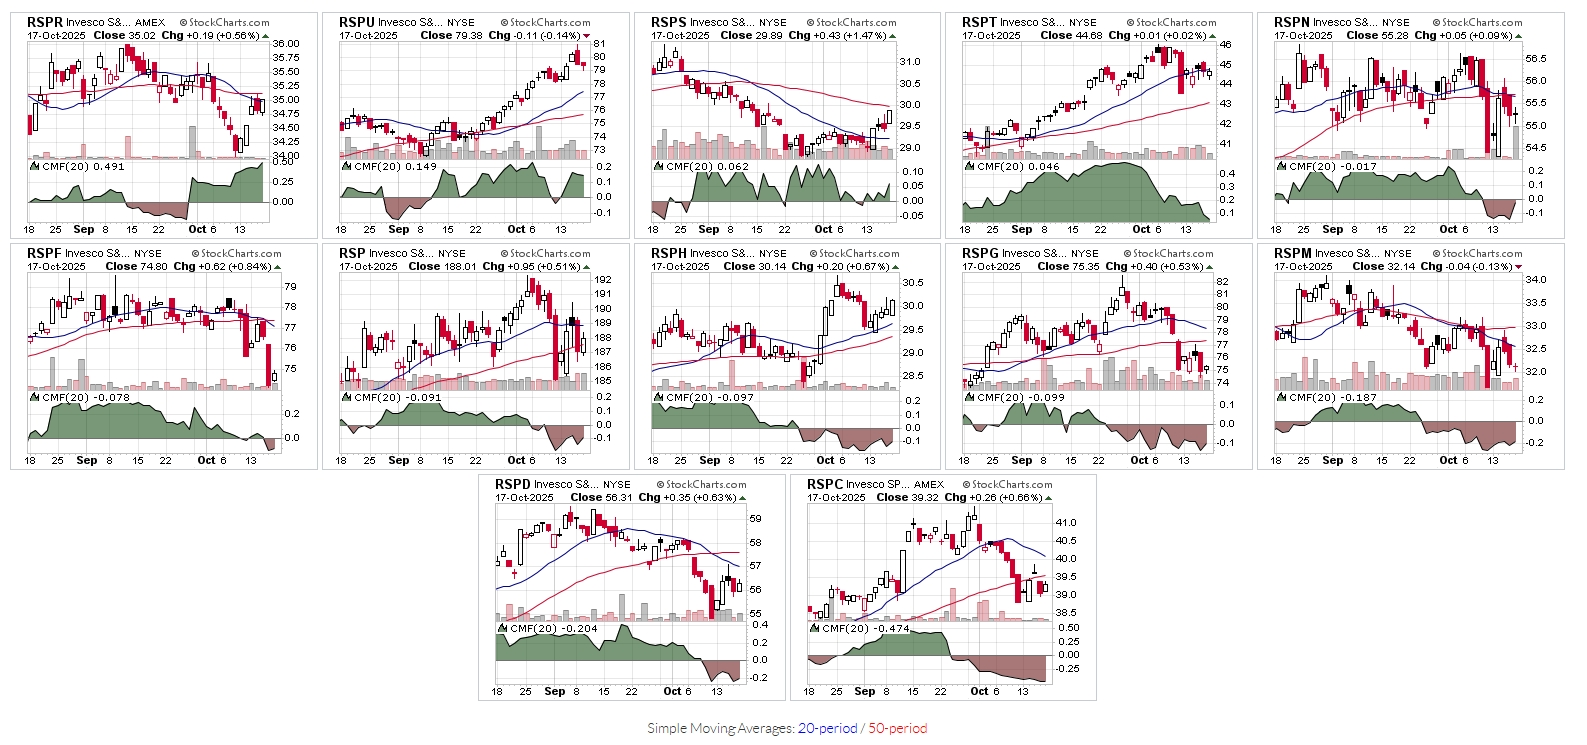
Sectors sorted by Chaikin Money Flow Equal Weight:
*RSPU is now 2nd and looking to take over #1 along with XLU. Nice sign of breadth by utilities
Major U.S. Economic Events
For the week of October 20–24, 2025, markets face a highly active economic calendar dominated by inflation data, global PMI releases, and key central bank decisions amid the ongoing U.S. government shutdown.
Major U.S. Events
Friday, October 24: Inflation data headline the week, with the Consumer Price Index (CPI) expected to rise 0.4% month-over-month and 2.9% year-over-year, alongside core CPI projected at 3.1% YoY.
Friday, October 24: S&P Global PMIs (flash) for manufacturing, services, and composite sectors will update business sentiment for October.
Friday, October 24: Final University of Michigan Consumer Sentiment Index will be released, forecast around 55.1.
Week-long concern: The federal government shutdown continues into its fourth week, threatening to delay or omit official data publications, per economists’ warnings.
Global Highlights
China (Monday, October 20):
Q3 GDP expected to show 4.8% year-over-year growth, the weakest in a year.
Retail sales forecast to slow to 2.9%, with fixed-asset investment nearly flat.
The Communist Party’s Fourth Plenum (Oct 20–23) will offer policy signals on the next Five-Year Plan.
Eurozone (Friday, October 24):
Preliminary PMI data for manufacturing and services will gauge economic momentum ahead of winter.
Consumer confidence numbers also due midweek.
United Kingdom (Wednesday–Friday):
Inflation (CPI) due Wednesday and retail sales Friday, both crucial for Bank of England’s direction.
Japan (Wednesday–Friday):
Releases trade balance and inflation data; core CPI expected up to 2.9%.
October PMI readings will also be monitored.
Canada (Tuesday–Thursday):
CPI on Tuesday and retail sales Thursday.
Turkey & Asia-Pacific:
Turkey’s central bank meeting Thursday and Bank Indonesia’s expected rate cut highlight EM policy moves.
Australia’s Q3 retail sales and New Zealand’s inflation also arrive early in the week.
Market Context
The week unfolds amid heightened sensitivity to inflation prints and policy expectations before the late-October Federal Reserve meeting.
With U.S. data reporting partially disrupted, global releases from China, Europe, and the UK may disproportionately influence market tone.
In short, October 20–24 is dominated by CPI and PMI releases, China’s GDP, and ongoing effects from the U.S. shutdown, shaping global risk sentiment across currencies, bonds, and equities.
Will the CPI and PMI be released with the government shutdown?
Yes, CPI will be released, but PMI data was never affected by the shutdown, since it comes from the private sector.
CPI (Consumer Price Index)
The Bureau of Labor Statistics (BLS) confirmed that the September CPI report is rescheduled for Friday, October 24, 2025, at 8:30 a.m. ET.
Only a small team of BLS staff was recalled to ensure this release happens, primarily because the CPI is needed for Social Security’s annual COLA calculation.
However, if the shutdown extends further, the release could face another delay, although currently it remains on track.
All other federal data (jobs, PPI, GDP, retail sales) remain on hold until funding resumes.
PMI (Purchasing Managers’ Index)
S&P Global’s PMI data is private, compiled independently from government funding, so it will be released as scheduled.
The upcoming flash U.S. Manufacturing and Services PMIs (for October) are still due Friday, October 24, alongside the CPI data.
These PMI updates will be especially influential, as markets rely more on private data during the government blackout.
Summary
CPI: Yes, expected October 24 via BLS (delayed from earlier date).
PMI: Yes, on schedule via S&P Global (unaffected by shutdown).
Other federal data: Still suspended.
In short: both CPI and PMI will be published this week, but CPI carries a risk of further delay if the shutdown worsens.
Upcoming FOMC Meeting
The next Federal Reserve FOMC policy meeting is scheduled for October 28–29, 2025, and is widely anticipated due to building expectations for another rate cut.
Earnings notables
Several major companies across multiple sectors are reporting earnings this week (October 20–24, 2025), marking one of the busiest periods of the Q3 earnings season. Key releases span technology, automakers, financials, and consumer goods, many of which could drive significant market moves.
*Earning could have an outsized impact with less government macro data…
Monday, October 20
Cleveland-Cliffs (CLF)
Steel Dynamics (STLD)
W.R. Berkley (WRB)
Tuesday, October 21
The Coca-Cola Company (KO)
General Electric Aerospace (GE)
General Motors (GM)
Lockheed Martin (LMT)
Halliburton (HAL)
RTX Corporation (RTX)
3M (MMM)
Philip Morris International (PM)
Netflix (NFLX)
Intuitive Surgical (ISRG)
Capital One (COF)
Elevance Health (ELV)
Danaher (DHR)
PulteGroup (PHM)
Wednesday, October 22
AT&T (T)
Vertiv Holdings (VRT)
Tesla (TSLA)
IBM (IBM)
Lam Research (LRCX)
GE Vernova (GEV)
Crown Castle (CCI)
Thursday, October 23
Intel (INTC)
T-Mobile (TMUS)
Honeywell (HON)
Ford Motor (F)
American Airlines (AAL)
Southwest Airlines (LUV)
Friday, October 24
Procter & Gamble (PG)
Booz Allen Hamilton (BAH)
General Dynamics (GD)
Sanofi (SNY)
HCA Healthcare (HCA)
These reports will provide insight into macroeconomic themes such as AI-driven demand, consumer resilience, and industrial spending trends, with TSLA, NFLX, INTC, and PG among the week’s headline catalysts shaping market sentiment.
Earnings Tickers: CLF, STLD, WRB, KO, GE, GM, LMT, HAL, RTX, MMM, PM, PHM, NFLX, ISRG, COF, ELV, DHR, T, VRT, TSLA, IBM, LRCX, GEV, CCI, INTC, TMUS, HON, F, AAL, LUV, PG, BAH, GD, SNY, HCA
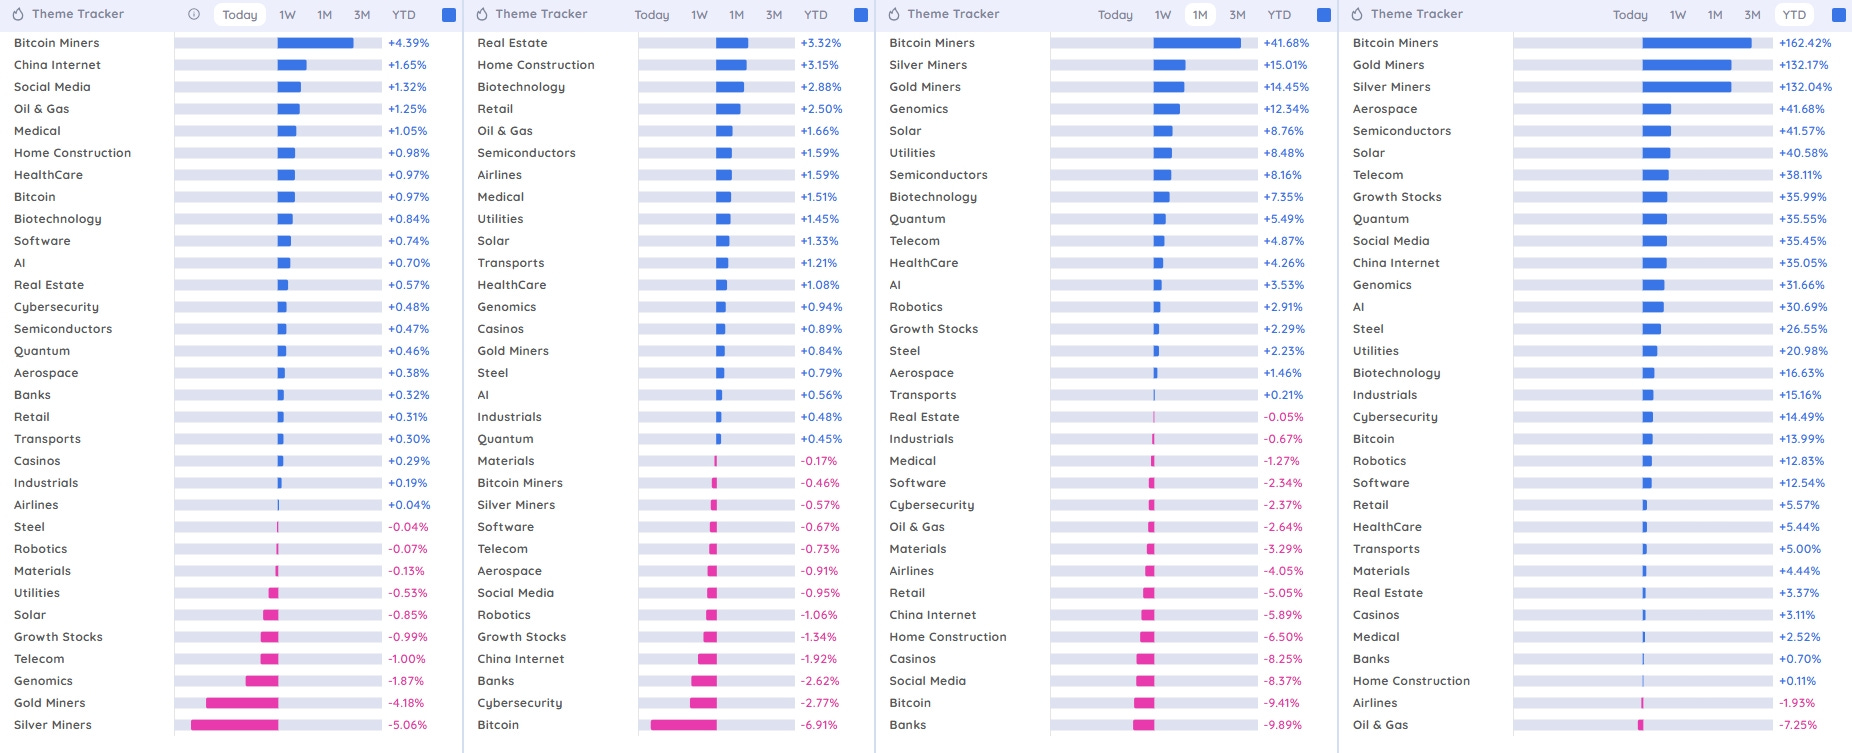
Deepvue Market Themes
Conclusion
Sector leadership is very dynamic, with high-beta speculative themes (crypto, metals, certain tech) dominating over the month and year but experiencing sharp volatility and intermittent short-term reversals. Real estate and homebuilders are notable recent winners, while classic defensives are only steady, not aggressive outperformers. Your focus on swing trading and technical setups on volatile leaders like bitcoin miners, AI/semiconductors, and precious metals remains well supported by these trends. Monitoring sector momentum and rotation remains key for swing candidates.
TradersLab.io Themes, Sectors, and Sub Markets
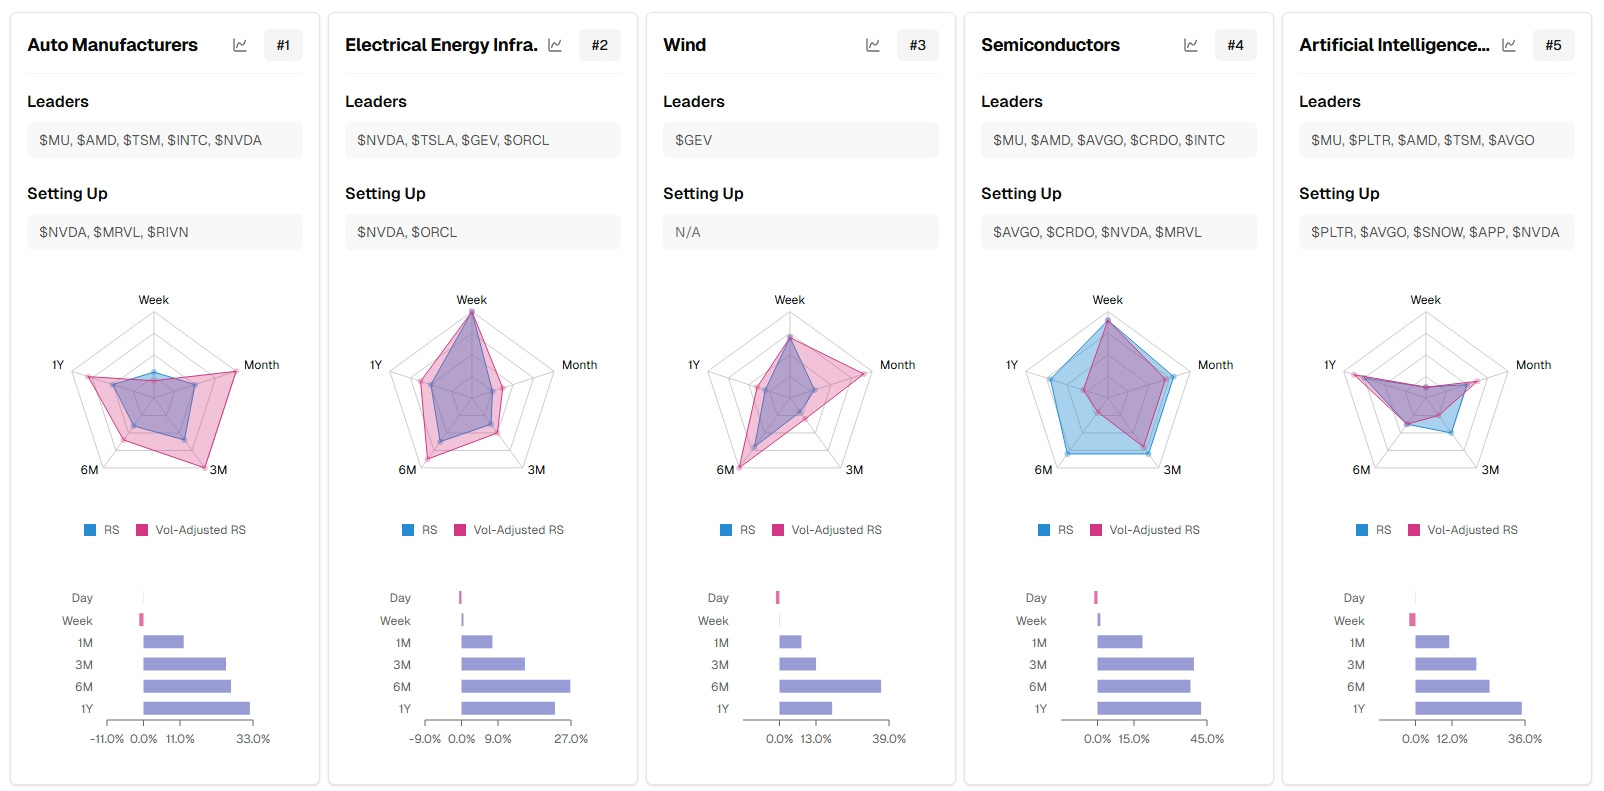
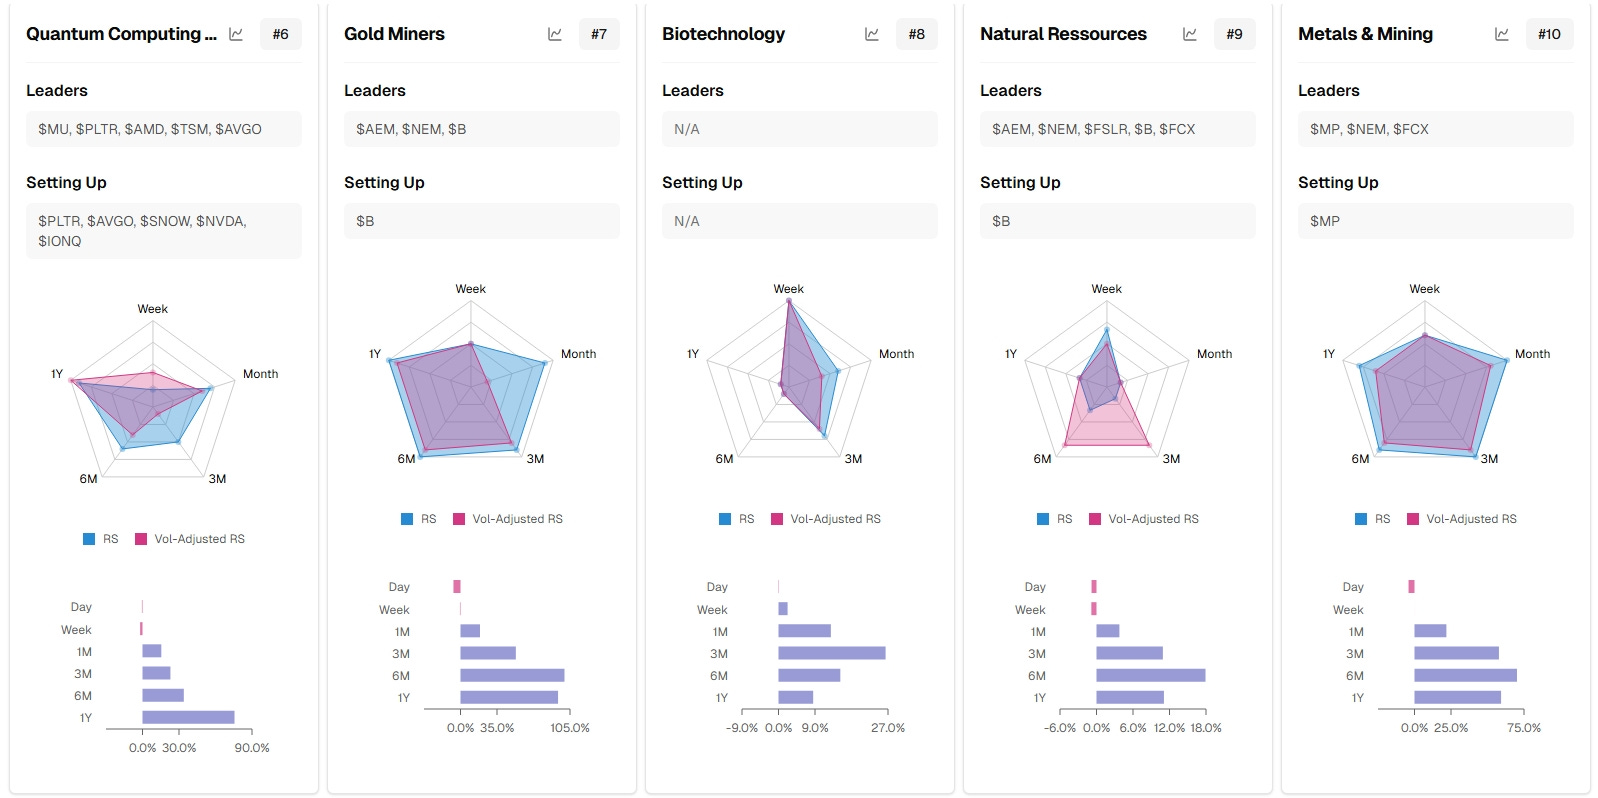
For swing trading, the current sector leadership analysis suggests a strong focus on technology, innovation, and select resource sectors. High RS and volume-adjusted RS confirm broad market participation, supporting bullish setups.
Top Swing Trading Sectors
Tech Innovation:
Semiconductors, Artificial Intelligence/ML, Quantum Computing, and Auto Manufacturers lead across timeframes, showing sustained momentum and increased trading activity.Resource Plays:
Gold Miners and Metals & Mining offer strong long-term RS, indicating position trade potential in cyclicals.
Key Swing Candidates
Cross-sector leaders for swing setups include:
$MU, $AMD, $TSM, $NVDA, $PLTR, $AVGO, $AEM, $FCX.“Setting Up” tickers highlighted for immediate watch:
$PLTR, $AVGO, $SNOW, $NVDA, $IONQ, $MRVL, $APP, $B.
Market Carpet for the week
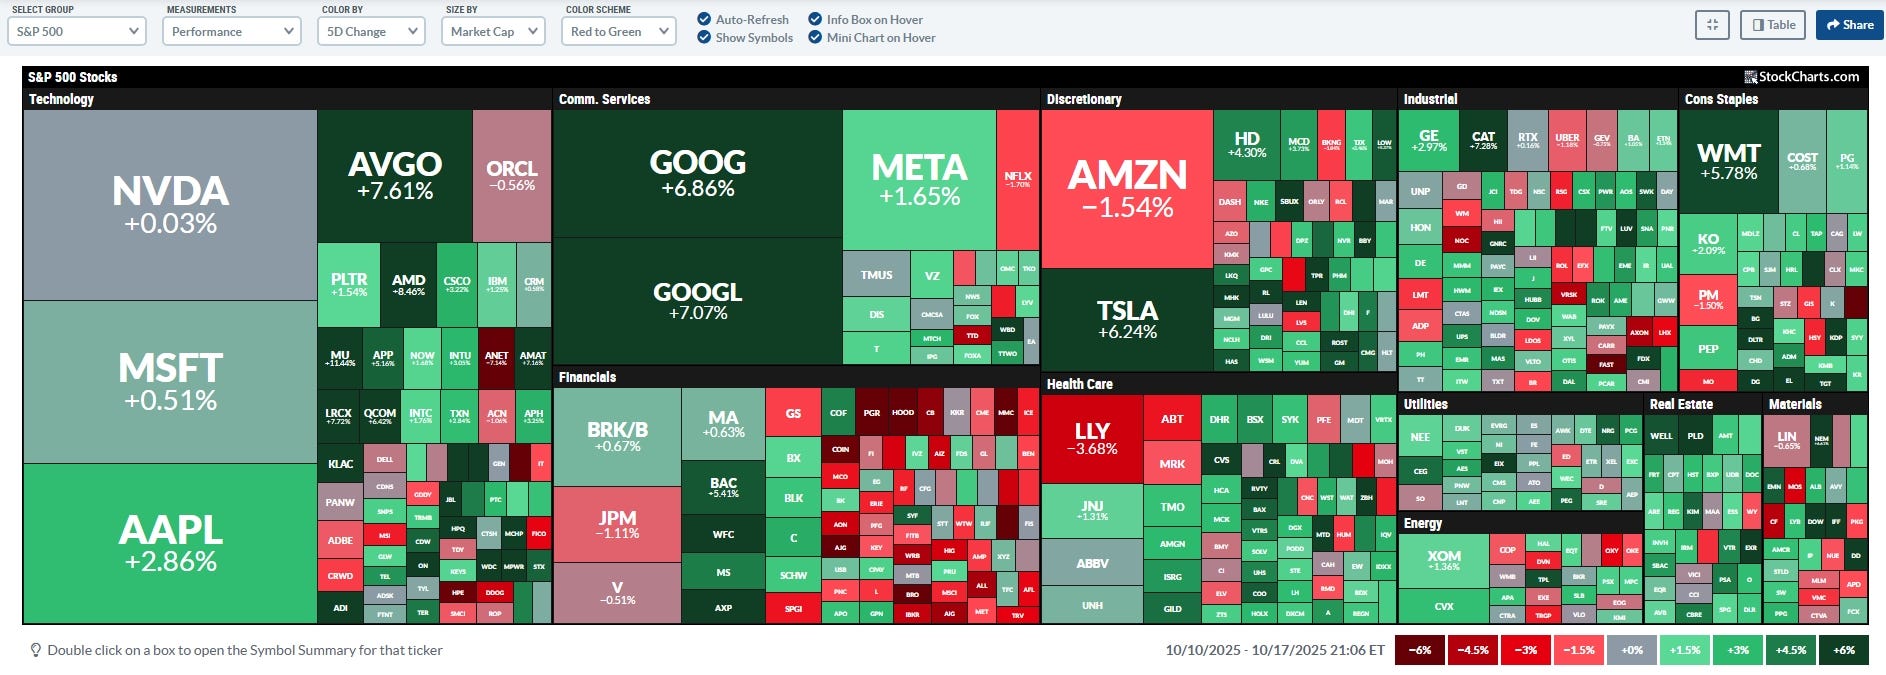
Key Market Themes
Outperformance in high-growth tech and select semiconductors, likely fueled by positive earnings and AI optimism.
Rotation toward mega-caps but broadening into some cyclicals like industrials and energy.
Discretionary and healthcare saw sweeps both ways, reflecting an ongoing tug-of-war between defensives and growth.
Major laggards were absent in tech, but some health care names and staples saw profit taking.
Psych Charts of note
RSP and QQE Newer Dow Theory.
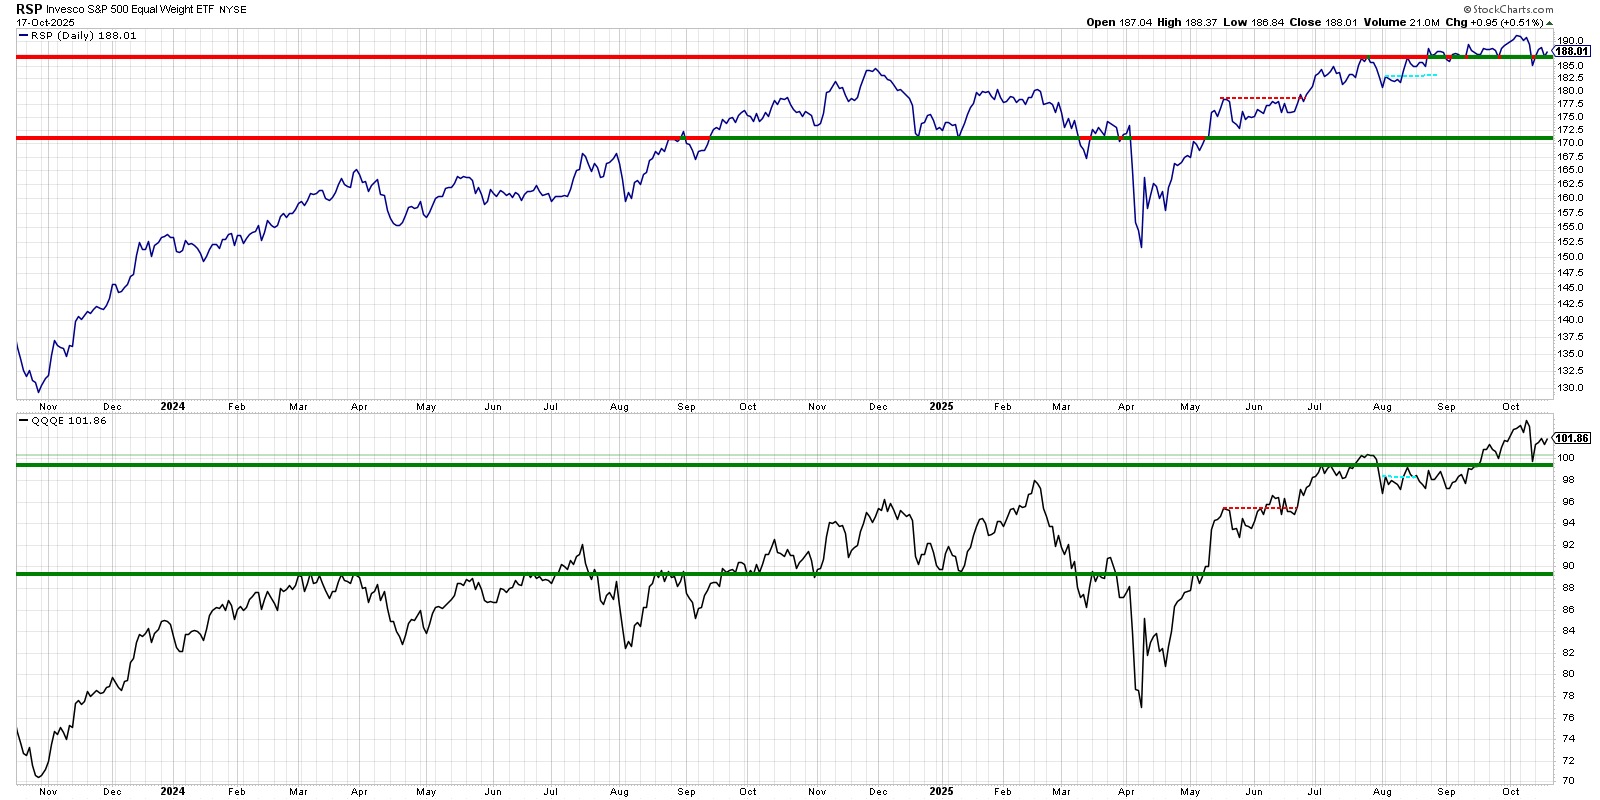
Looking good. Held Key Levels. Those two levels remain key too watch.
SPY
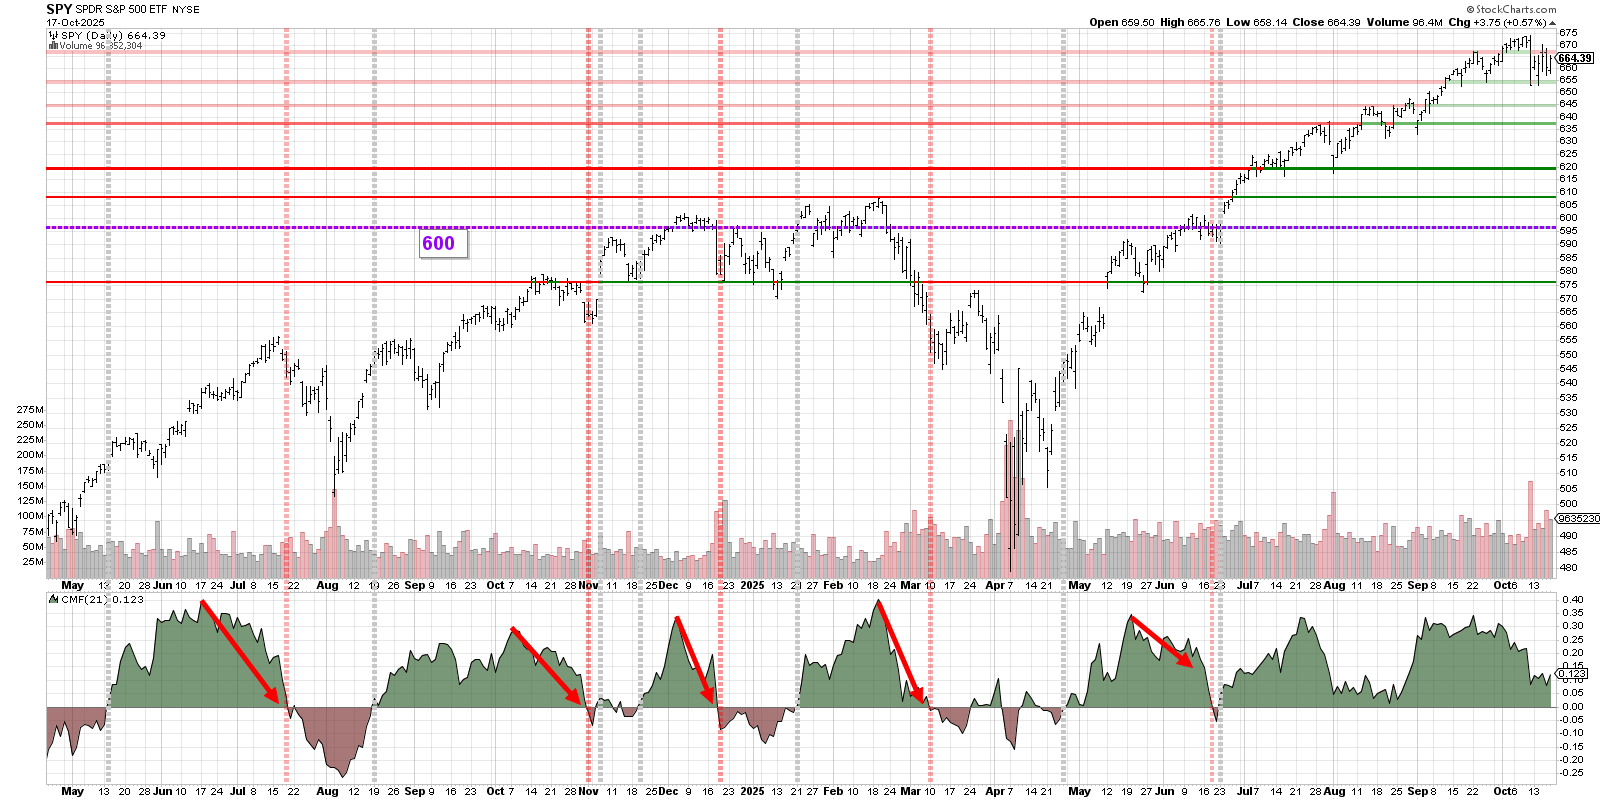
Trading Implications
Trend remains bullish, but CMF weakness and clearly a range off the October 10th high and low.
A healthy correction toward the 630-650 zone would provide a higher probability swing entry if buying pressure resumes.
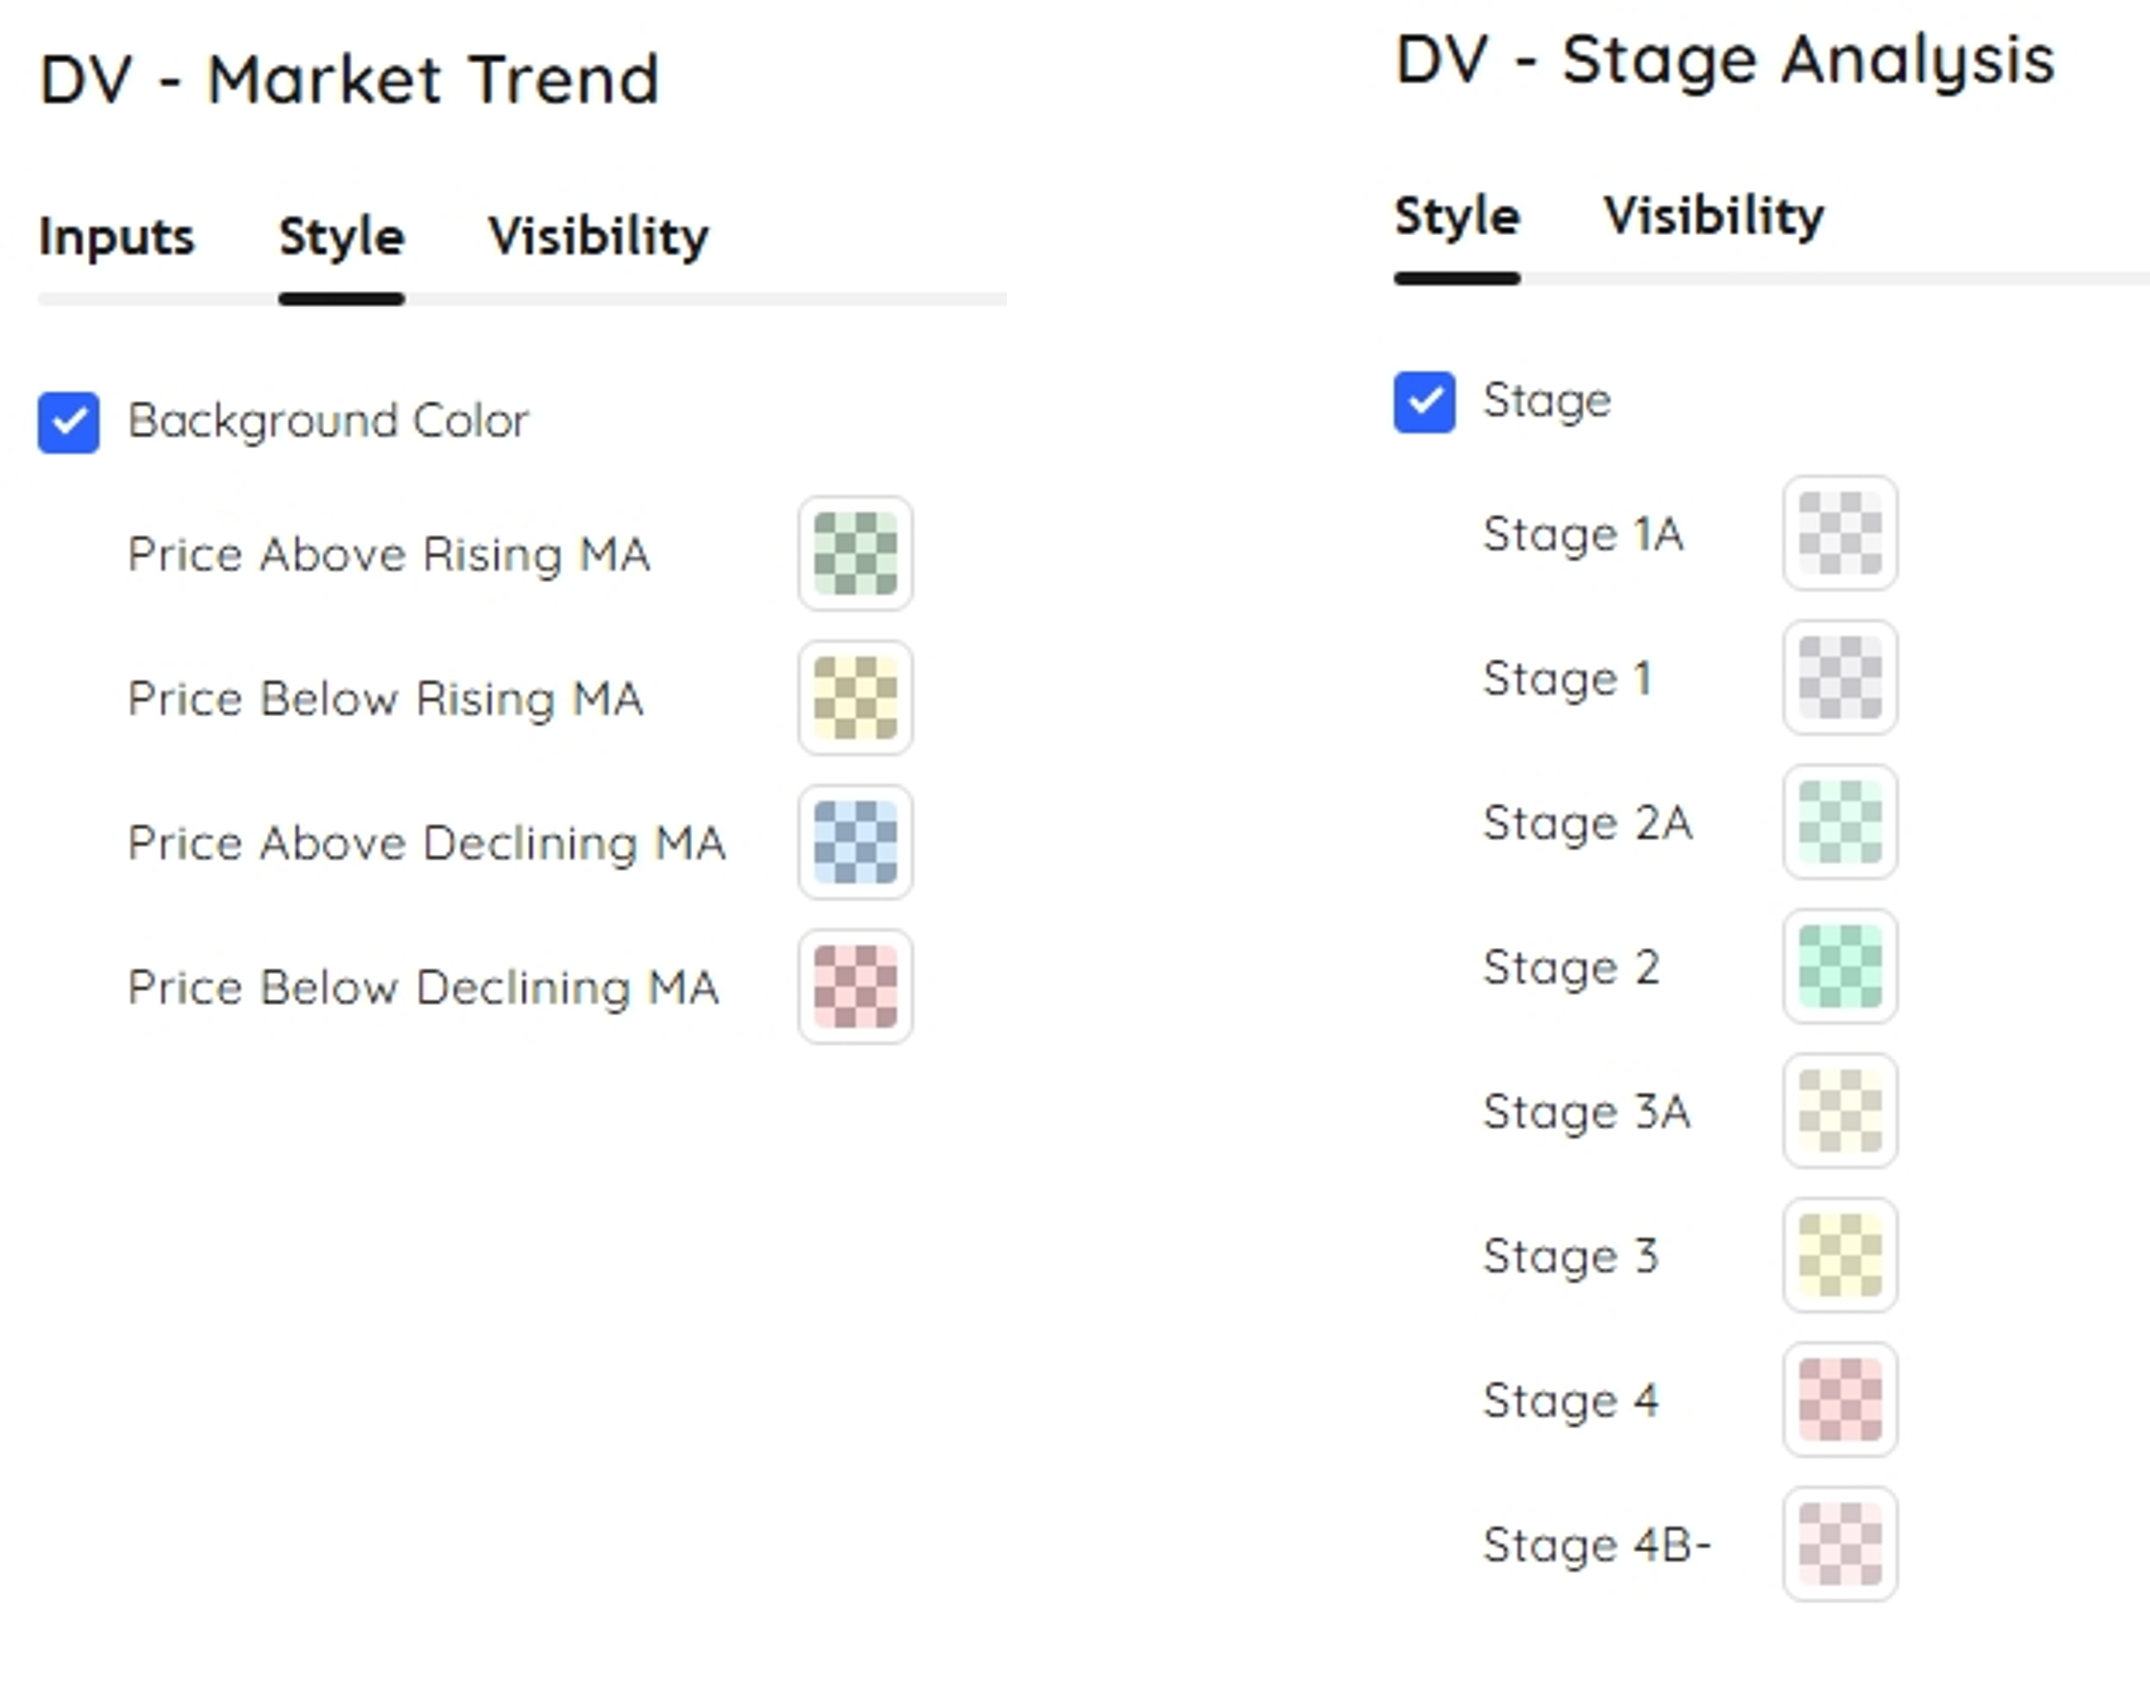
SPY chart with Deepvue market trend analysis
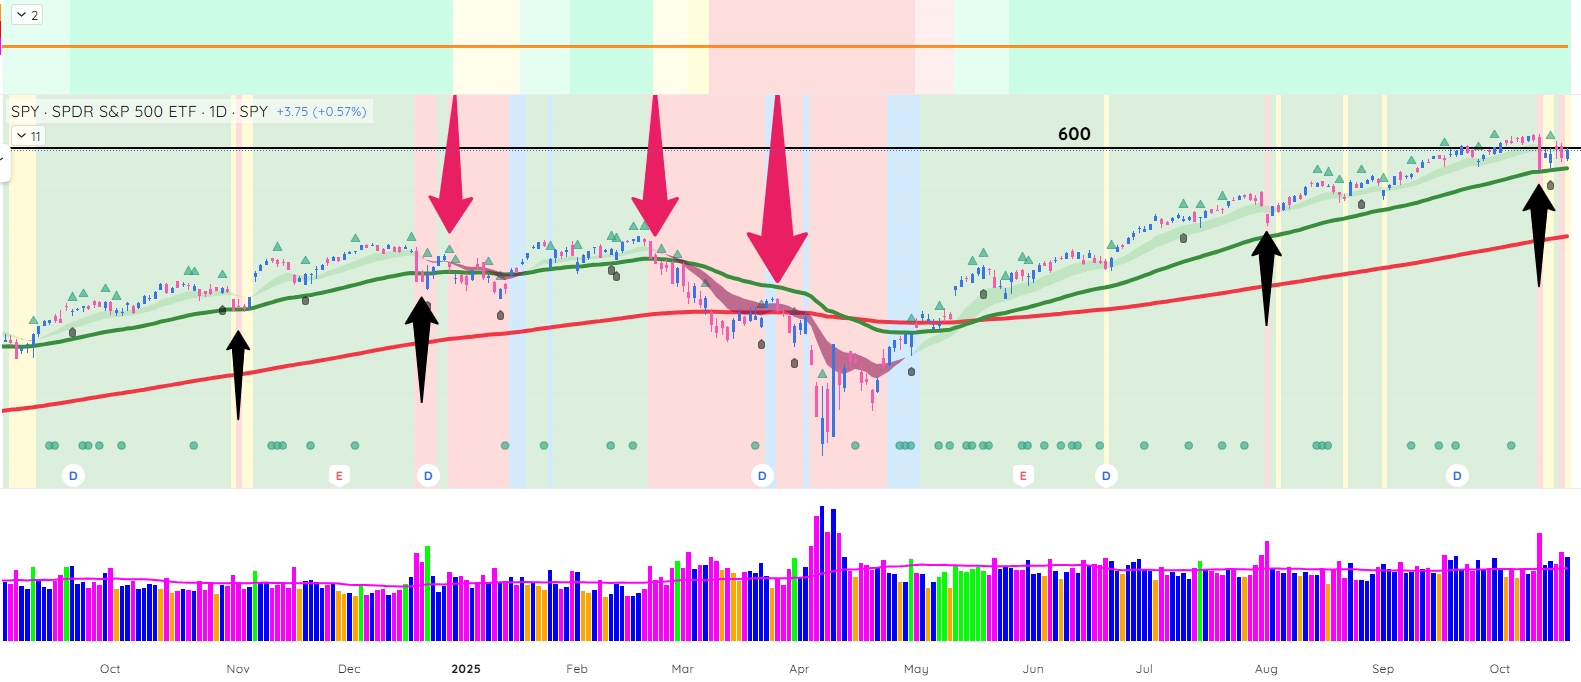
We are still Green Stage 2 Analysis but of course that could change soon. But reading it like that, we are looking for dip buys. We turned red on the Deepvue Market Trend for a second time recently this week. Certainly prudent to use some caution.
Weekly- Relative Rotation Graph (RRG)
This chart provides a relative strength and momentum snapshot for all S&P sector ETFs against the SPY over the 5-week period.
Leading and Weakening Sectors
Technology (XLK) remains the clear leader, found deep in the “Leading” quadrant, but its trajectory suggests early signs of momentum cooling as it starts curving toward the “Weakening” quadrant. The strong price return (+5.35%) and high RS-ratio confirm its leadership, but watch for potential trend deceleration.
Consumer Discretionary (XLY) and Communications (XLC) are in the “Leading” quadrant but have flattened/ticked down, illustrating waning relative strength. Both reported slightly negative returns over this 5-week span, confirming weakness despite their quadrant positions.
Improving and Strong Risers
Health Care (XLV) shows the most dramatic improvement, with a robust northeast trajectory from “Lagging” into “Improving,” driven by strong price performance (+4.21%) and surging momentum. This outperformance suggests rotational interest and could prelude a new leadership phase.
Energy (XLE) also exhibits pronounced improvement, with a steep path upward in “Improving,” though its price return is negative (-2.13%), indicating that relative momentum is rising even as absolute price lags. This sector could be watched for a reversal if momentum strength continues.
Utilities (XLU) has punched into “Improving” territory, supported by a strong price gain (+7.82%). This might suggest defensive rotation, especially if broad market conditions remain uncertain.
Lagging and Losing Sectors
Consumer Staples (XLP), Industrials (XLI), Real Estate (XLRE), Materials (XLB), and Financials (XLF) remain clustered in the “Lagging” quadrant, with nearly all showing negative 5-week returns except Real Estate (slightly positive). Their tail directions reflect continued relative underperformance and persistent loss of momentum, signaling little near-term attraction for swing setups.
Tactical Insights for Swing Traders
The best rotational setups often occur at quadrant transitions—XLV and XLU are both advancing strongly, offering swing opportunities as they approach “Leading”.
XLK may require close monitoring for signs of trend exhaustion or reversal as its momentum cools; profit-taking or hedging could be considered.
Watch for surprise reversals in “Improving” or sharp rallies out of “Lagging”; relative strength changes can precede price shifts.
This RRG snapshot identifies sector rotation dynamics, spotlighting XLV and XLU as momentum leaders and suggesting caution on sustained sector outperformers like XLK, while laggards continue to underperform for now.
Before we look further at the S&P 500 sectors, let’s look at the offensive versus defensive chart below…
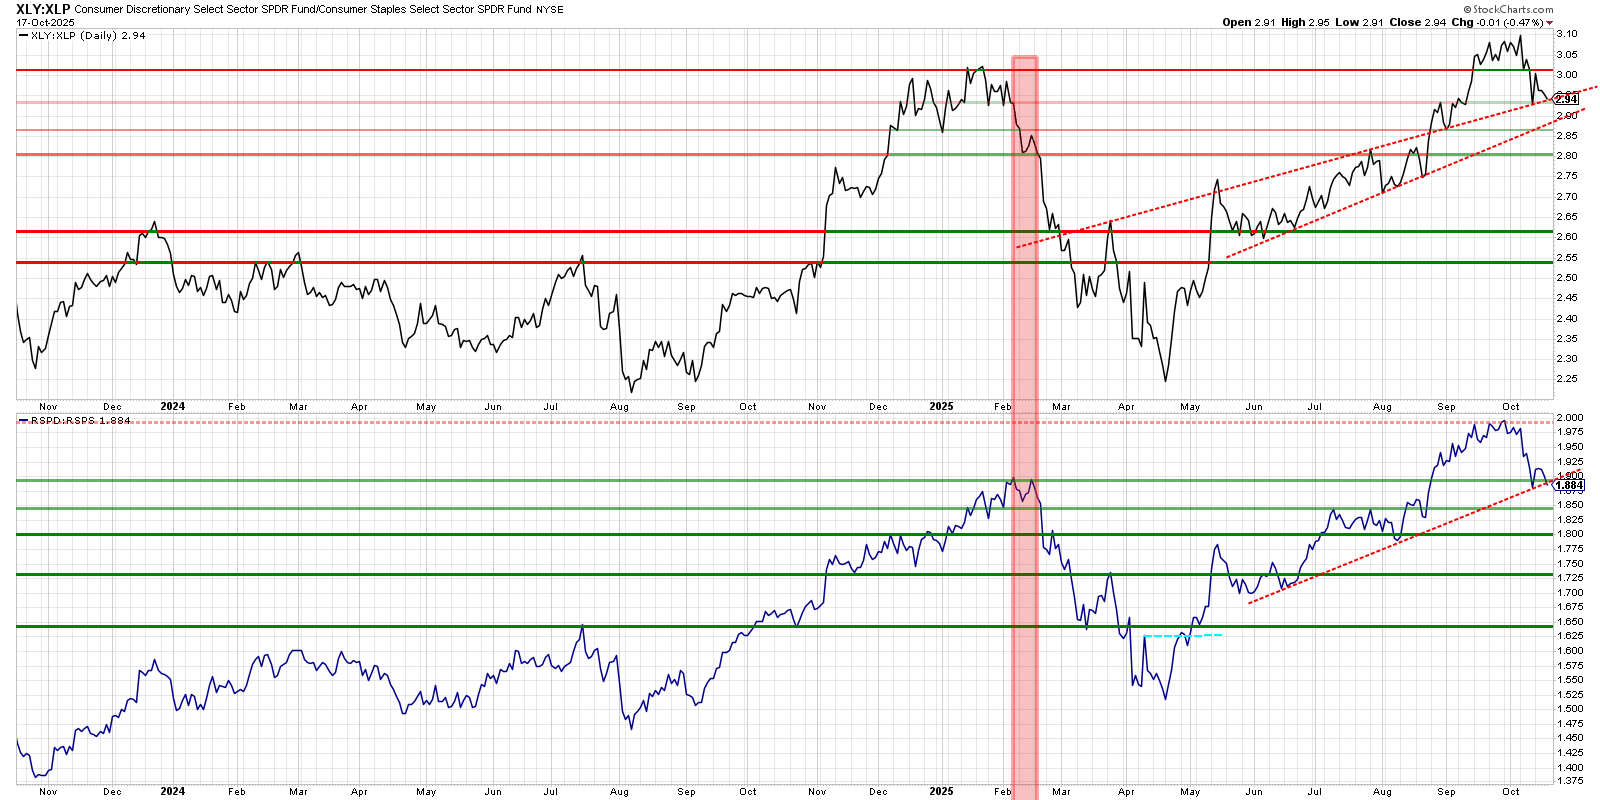
Both ratios are at inflection points (Key ascending and horizontal levels): holding above support favors continuation of risk-on, cyclical sector strength; breaking below shifts to a defensive stance.
Growth versus Spy
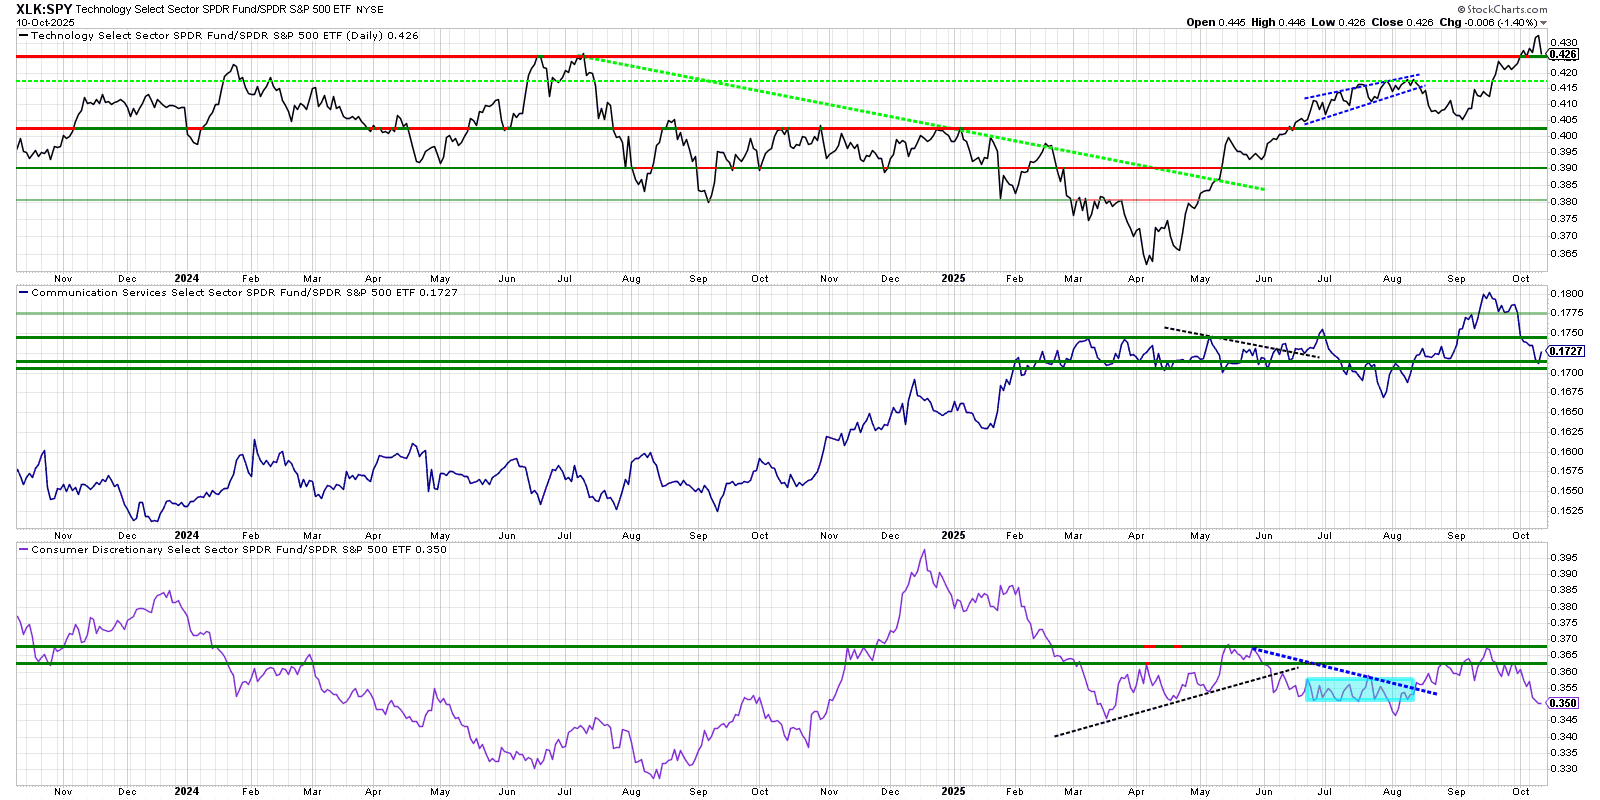
Takeaway for Swing/Relative Strength Traders
XLK is favored for swing/RS trades as its breakout and momentum align with classic sector rotation strategies.
Watch for confirmation in XLC; a bounce from these pullback levels or a reclaiming of relative highs could signal a second leadership wave.
Avoid or underweight XLY until it reclaims resistance and demonstrates improved RS structure.
Summary
Technology (XLK) as the primary overweight sector, with XLC as a watchlist candidate and XLY as an underperformer within growth sector thematics for late 2025.
Value versus SPY
Overall Takeaway
Industrial, financial, materials, and energy sectors are all underperforming SPY as of October 2025, signaling continued sector rotation away from cyclical areas and little sign of leadership from these groups. This suggests traders should focus on other sectors showing relative strength or wait for evidence of sector reversals.
Defensives versus SPY
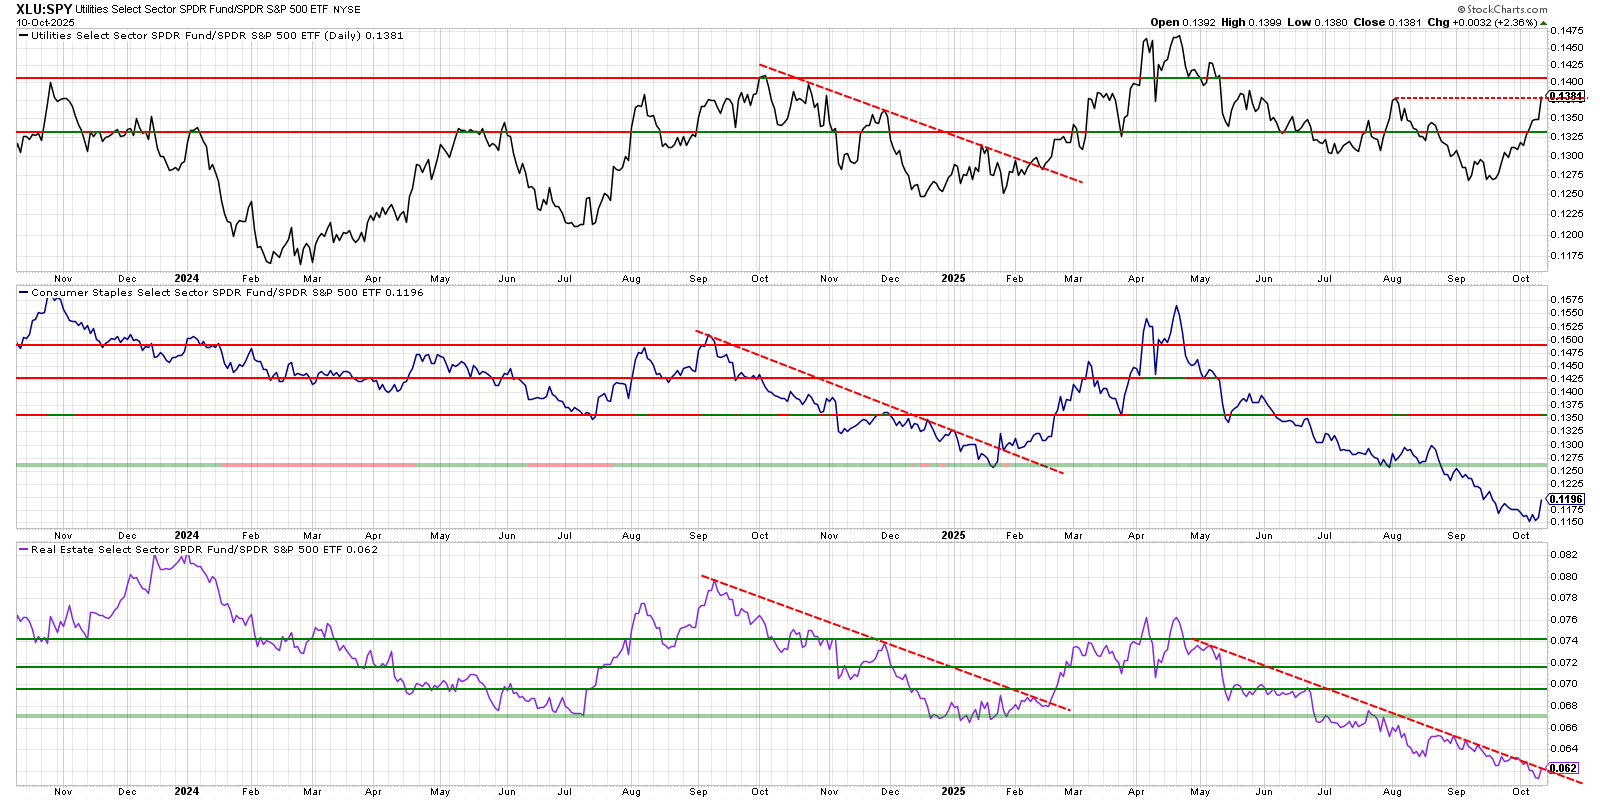
Chart Structure & Sector Rotation???
All three defensive sectors have been underperforming the S&P 500 during most of the period, with clear downward trends over the past year.
The recent rebound in utilities could indicate early risk-off or defensive rotation, especially if the ratio sustains a break above resistance.
Consumer staples and real estate are still showing chronic underperformance, though consumer staples may be stabilizing.
Trading Considerations
Potential theme: defensive sector rotation is trying to emerge, led by utilities.
Watch for confirmed breakouts above resistance for XLU:SPY, as this could signal broader market risk aversion.
XLP and XLRE remain laggards and would require significant improvement in their ratios for a sustained rotation signal.
This analysis suggests the early stages of a shift toward safety, but confirmation will require follow-through in sector strength, especially in utilities.
Thoughts this week: I FAFO this week… I started chasing heavy with SPXL and SPXS this week because I felt it would be easy to ride the volatility… My dumbass lost over 5% of my account this week. I finally stopped Friday and took a break Saturday to reflect. Everybody always wants the market to flush. Sometimes you have to flush yourself...
You can do it, Keep Studying!
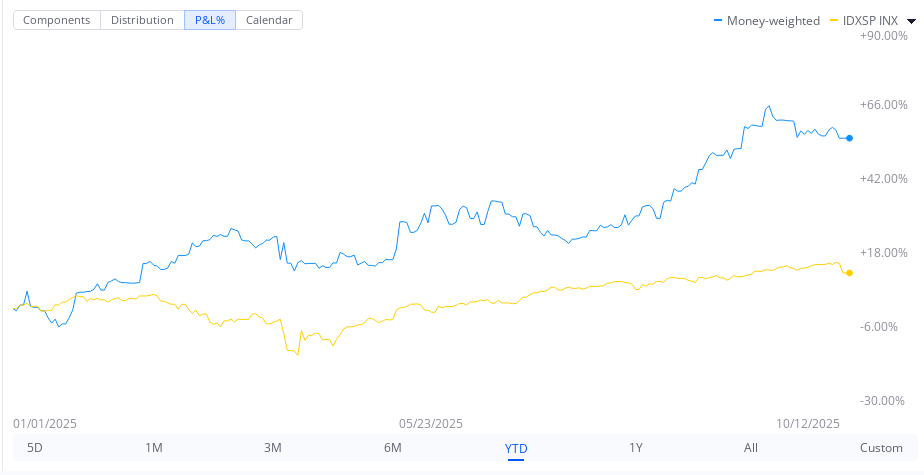
Most others don’t post their YTD because they can’t or frankly, they are lying. You better make sure, or you will lose it all…
Stock Talk Insiders discord
If you like this Phat Swing Plan, and you would like to receive alerts for my trades, click this link for the discord Stock Talk Insiders discord and enter the promo code: PHAT to get 10% off all packages for life...

Follow my alerts on Stock Talk Insiders discord Enter code: PHAT for 10% off
Follow my Phatstack for my Phat Swing Plan and updates during the week.
Follow me on X Phatinfantry Trading @Phatinfantry where I post/talk crap when I drink wine and make fun of dumb things.
Follow me on YouTube where I go through my process and review charts Phatinfantry
I resonate with what you wrote about the personal side of market swings; my partner definately has a sharper eye for unexpected expenses than I do sometimes. It makes me wonder what the market would look like if AI models were mature enough to truly account for and maybe even pre-empt the impact of sudden policys shifts, like those tariff threats.