
Phat Swing Plans and Observations
For the week of 3/9/26

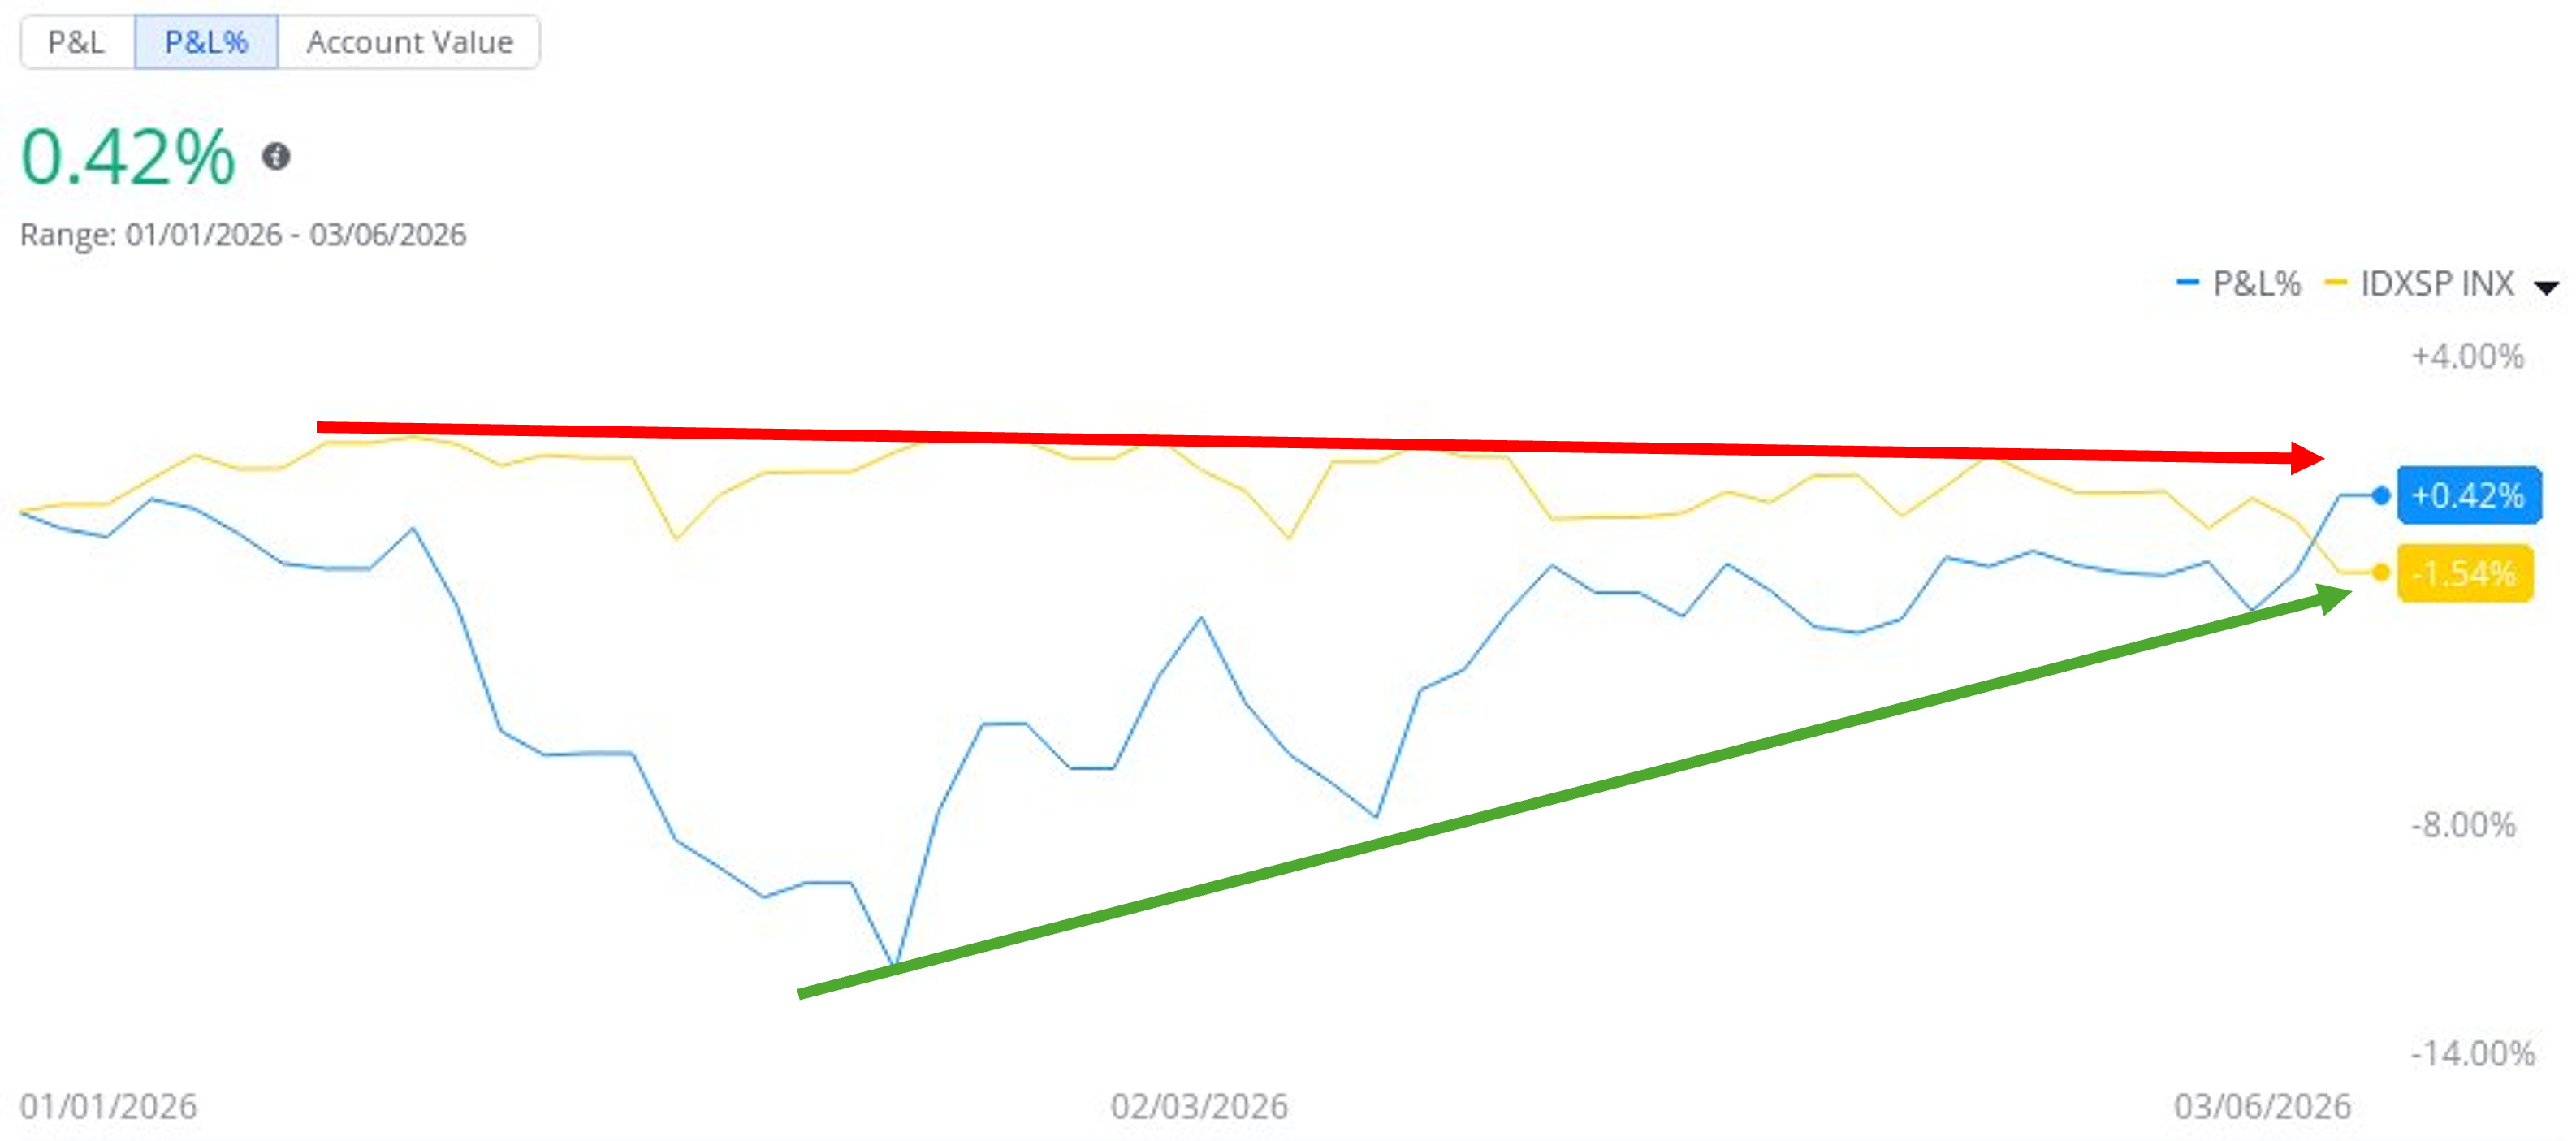
While others are down Phat is up…
Market Summary for the week
U.S. equities head into Mar 9–13 in a choppy, risk‑off but rotational tape, with large‑cap indexes stuck in a range while small‑cap value, energy, and materials continue to quietly lead on the year.
Big picture and indices
For the week ended Mar 6, the S&P 500 fell about 0.4%, the Dow about 1.3%, and the Nasdaq about 1.0%, extending February’s downside as AI fears, inflation worries, and Middle East tensions kept volatility elevated.
Year‑to‑date, small‑cap value is up roughly 8.9% while large‑cap growth is down about 4.8%, and energy and materials sectors are up about 25% and 17.8% respectively versus only about 0.7% for the cap‑weighted S&P 500, underscoring the shift toward cyclical/value leadership.
Index snapshot (last week)
S&P 500: -0.4% Primary trend still up, but price is oscillating in the 6,800s–6,900s without a clean break either way.
Nasdaq: -1.0% Underperformed on renewed tech/software pressure despite some rebounds, still negative year‑to‑date.
Dow: -1.3% Hurt by banks, industrials, and tariff/geopolitical worries.
Sector and style rotation
YTD, information technology in the S&P 500 is down about 5.5%, while energy and materials have rallied around 25% and 17.8%, and the equal‑weight S&P 500 is up about 7.1% versus only 0.7% for the cap‑weighted index.
Last week’s late‑week selloff hit staples, materials, and industrials on Thursday, but the broader pattern remains: investors are rotating away from mega‑cap growth and into small caps, value, energy, and cyclicals as they seek areas with better upside/downside tradeoffs.
For swings, that keeps commodity‑linked value (energy/materials) and small‑cap value in favor on pullbacks, while tech/software and mega‑cap growth remain more tactical, short‑term trading vehicles.
Macro calendar: what matters
Markets will juggle two big themes: Middle East war risk (oil above 90 and headline risk) and a fresh round of U.S. inflation and growth data (CPI and PCE, plus Q4 GDP revision and jobs/JOLTS) that will shape expectations for Fed cuts later in 2026.
A weaker‑than‑expected February jobs report already showed payrolls falling by 92,000 versus expectations for an increase of 58,000 and unemployment rising to 4.4%, even as wages grew faster than expected, complicating the growth‑versus‑inflation trade‑off.
Macro event calendar (ET)
Wednesday, Mar 11, 2026 – 8:30 a.m CPI (Feb); 8:30 a.m Core CPI (Feb).
Friday, Mar 13, 2026 – 8:30 a.m Core PCE, PCE (Jan), personal income/spending, Q4 GDP revision, durable goods, JOLTS; 10:00 a.m U. Michigan sentiment (Mar prelim).
These are the main volatility windows; everything else this week is secondary compared with the inflation and growth cluster.
Earnings: summary for the week
Earnings season is past peak but still has some high‑beta catalysts, including Oracle (ORCL) and Nio (NIO), plus a handful of other tech, consumer, and EV names that can move sectors more than the broad indexes.
With AI, tariffs, and macro dominating, traders are likely to treat these reports as stock‑specific swing opportunities rather than primary index drivers, unless guidance radically changes the AI or EV narratives.
Earnings calendar
ORCL – key for enterprise software and cloud sentiment
NIO – important for EV and China‑related risk appetite.
Trading implications for the week
Tape: We’re in a volatile range environment rather than a clean trend—S&P still making lower highs under the 7,000 area, with fast swings driven by inflation, oil, and geopolitical headlines.
Leadership: The rotation toward small‑cap value, energy, and materials suggests swing longs in those groups on orderly pullbacks, while treating mega‑cap tech/software as short‑term trades around levels and catalysts, not core holdings.
Event risk: Plan around Wednesday CPI and Friday’s data cluster at 8:30 a.m
using the reaction in yields and the dollar to confirm whether to lean further into value/cyclicals or rotate back into growth for tactical bounces.
Deepvue Market Themes
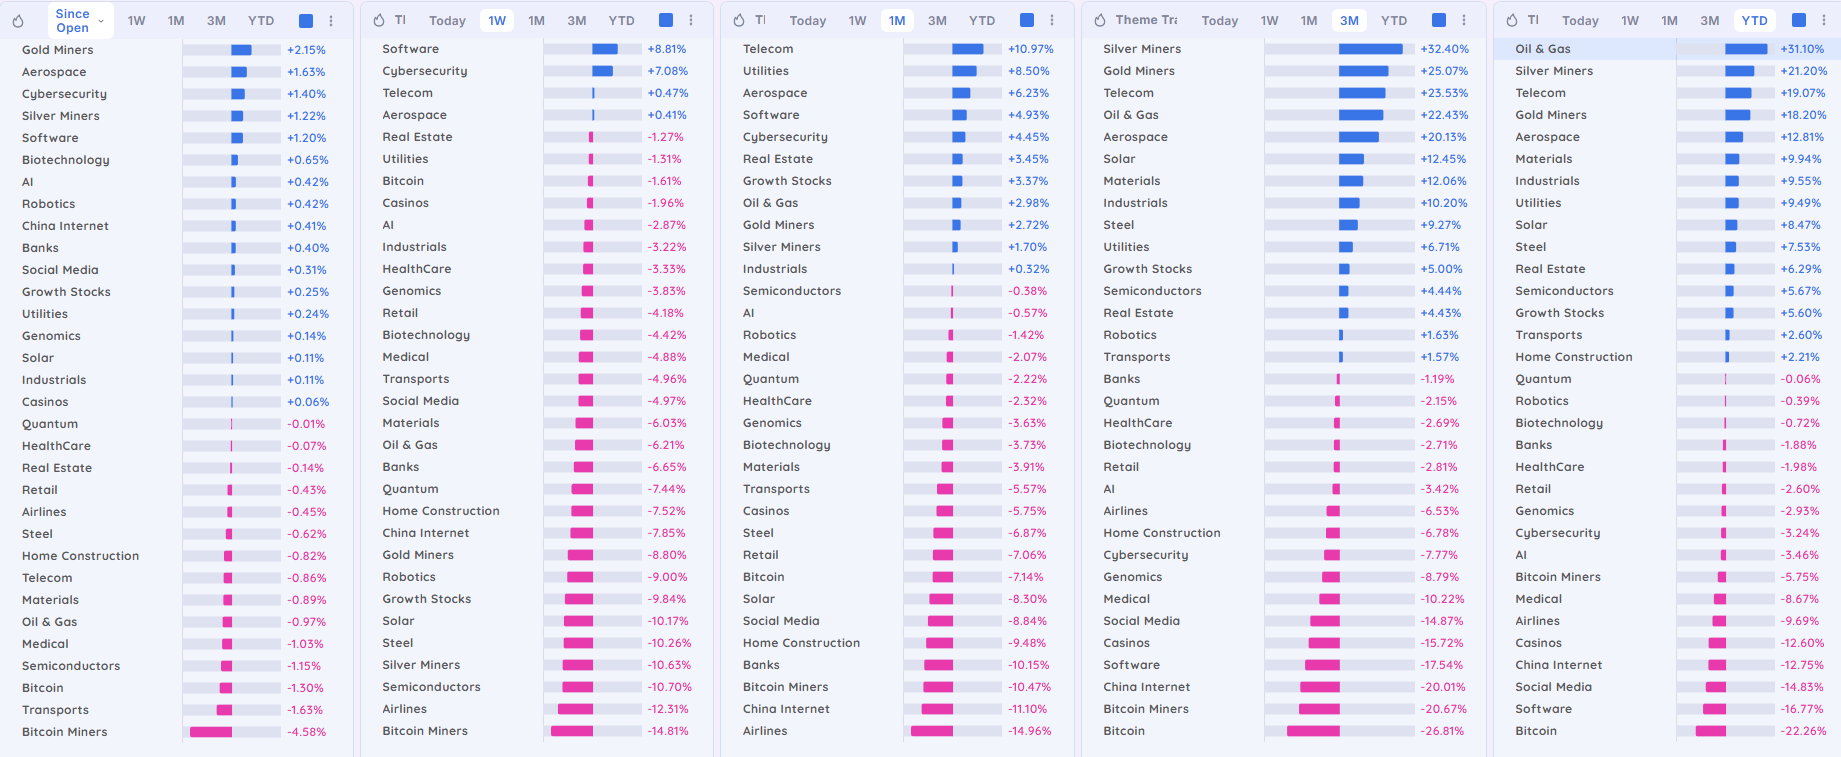
Swing trading implications
“Leaders”: tickers inside Oil & Gas, Metals, Telecom, Aerospace, Materials, Industrials, Utilities.
“Improving tech”: strongest Software/Cybersecurity/AI names.
“Avoid”: Bitcoin complex, China Internet, Casinos, weak Retail/Home Construction.
TradersLab.io Themes
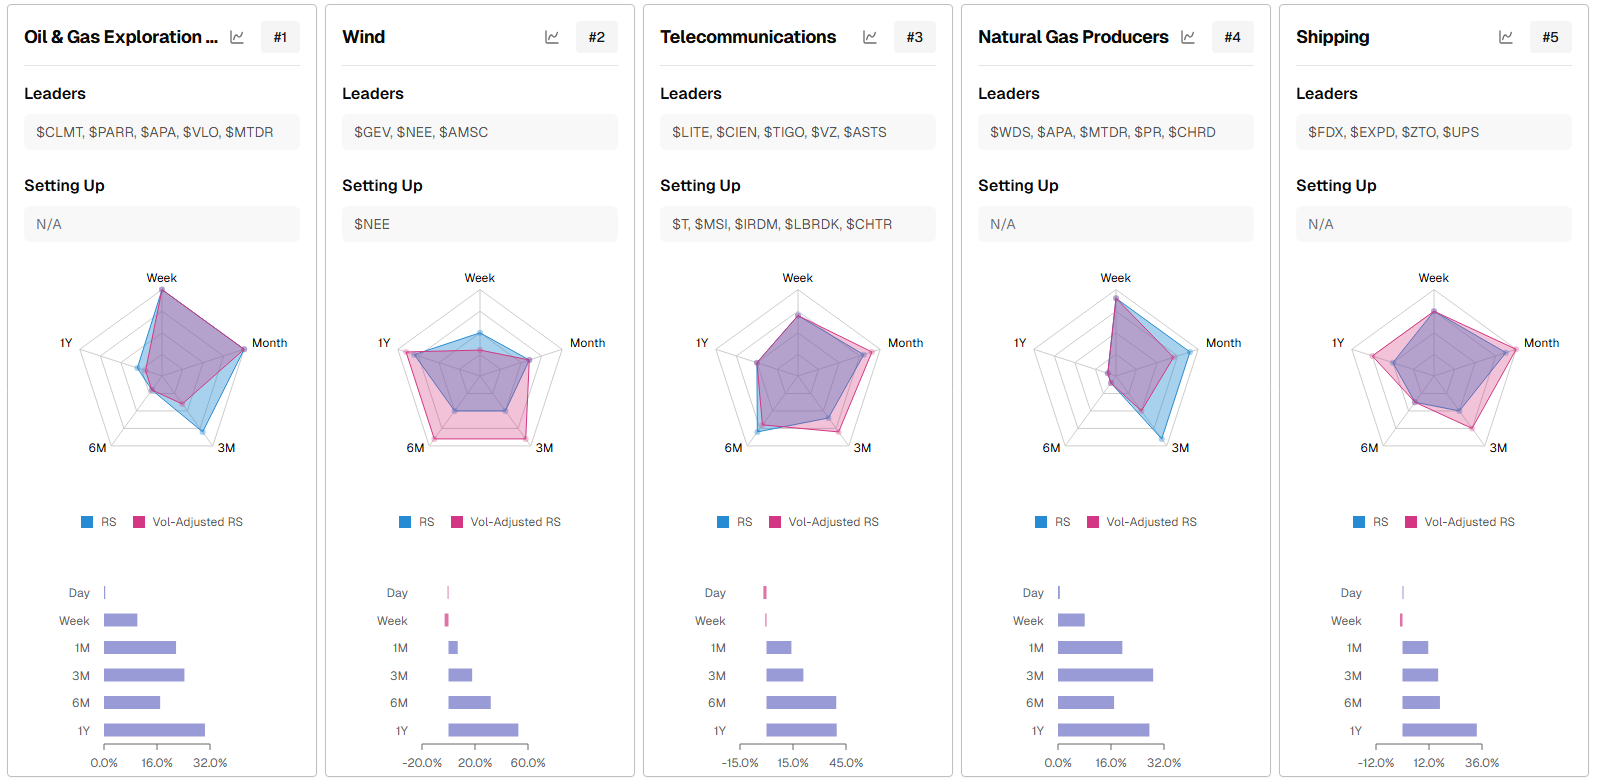
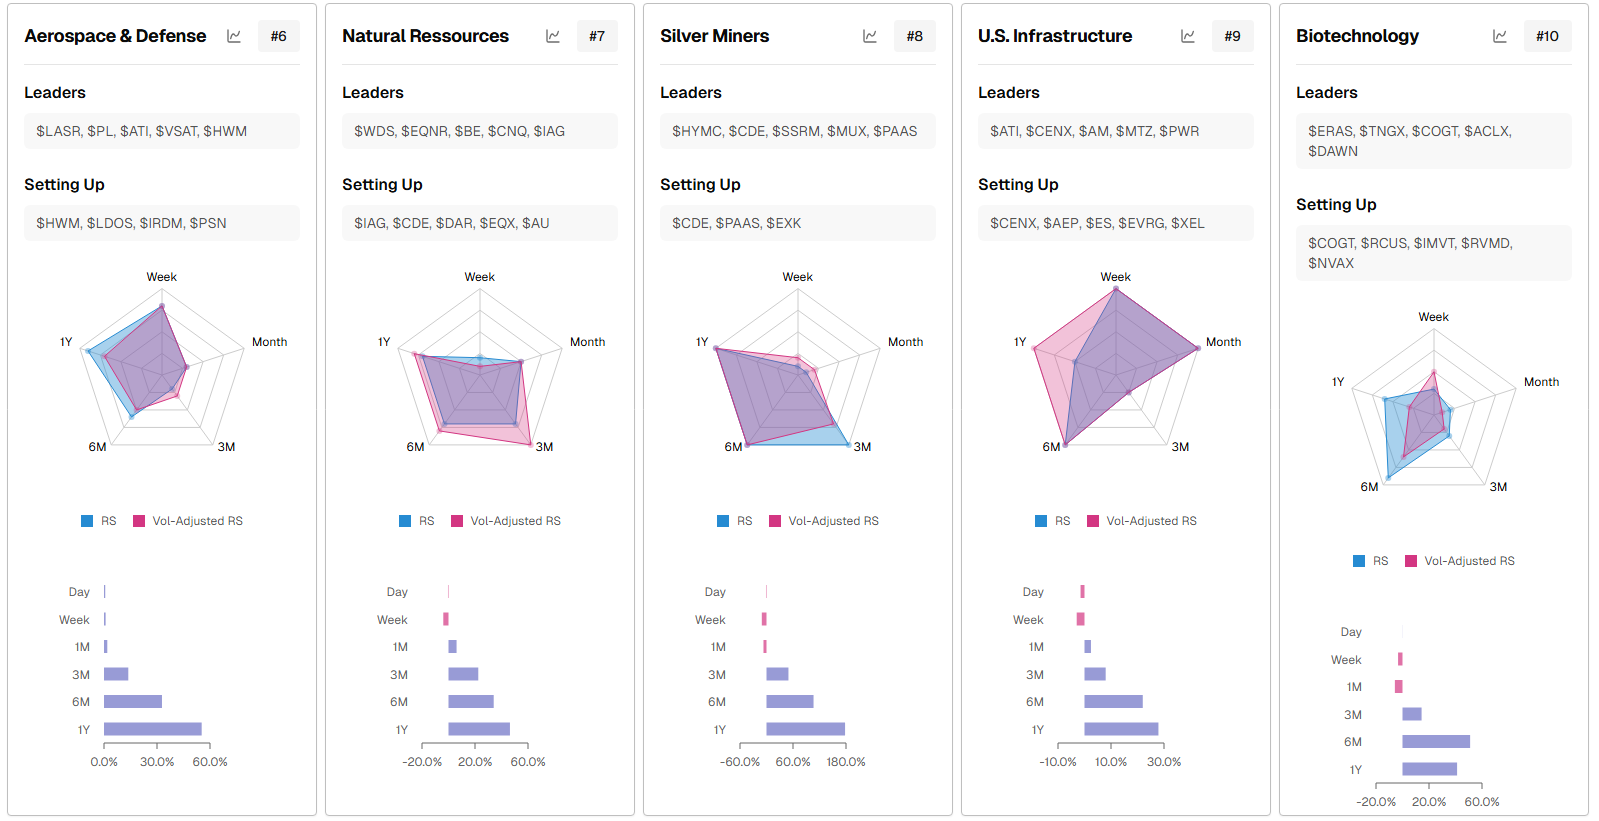
Swing Trading Implications:
Primary hunting ground: Focus scans on liquid leaders in Oil & Gas E&P, Nat‑Gas Producers, Shipping, and A&D that are pulling back toward rising 10–20–50‑day MAs on drying volume after prior breakouts.
Secondary / “setting‑up” bucket: Use Telecom, Infrastructure, and Silver Miners as “add‑on” universes for fresh bases or first pullbacks after a new 3‑month RS surge.
Avoid / size down: Biotech momentum chases; if you touch it, keep it to A‑setups only (clean base‑breaks with volume and RS actually inflecting on the weekly, not just the day or week bars).
Run rate vs this week’s price change for cap-weighted S&P 500 sector ETFs and equal‑weight sector proxies RSP
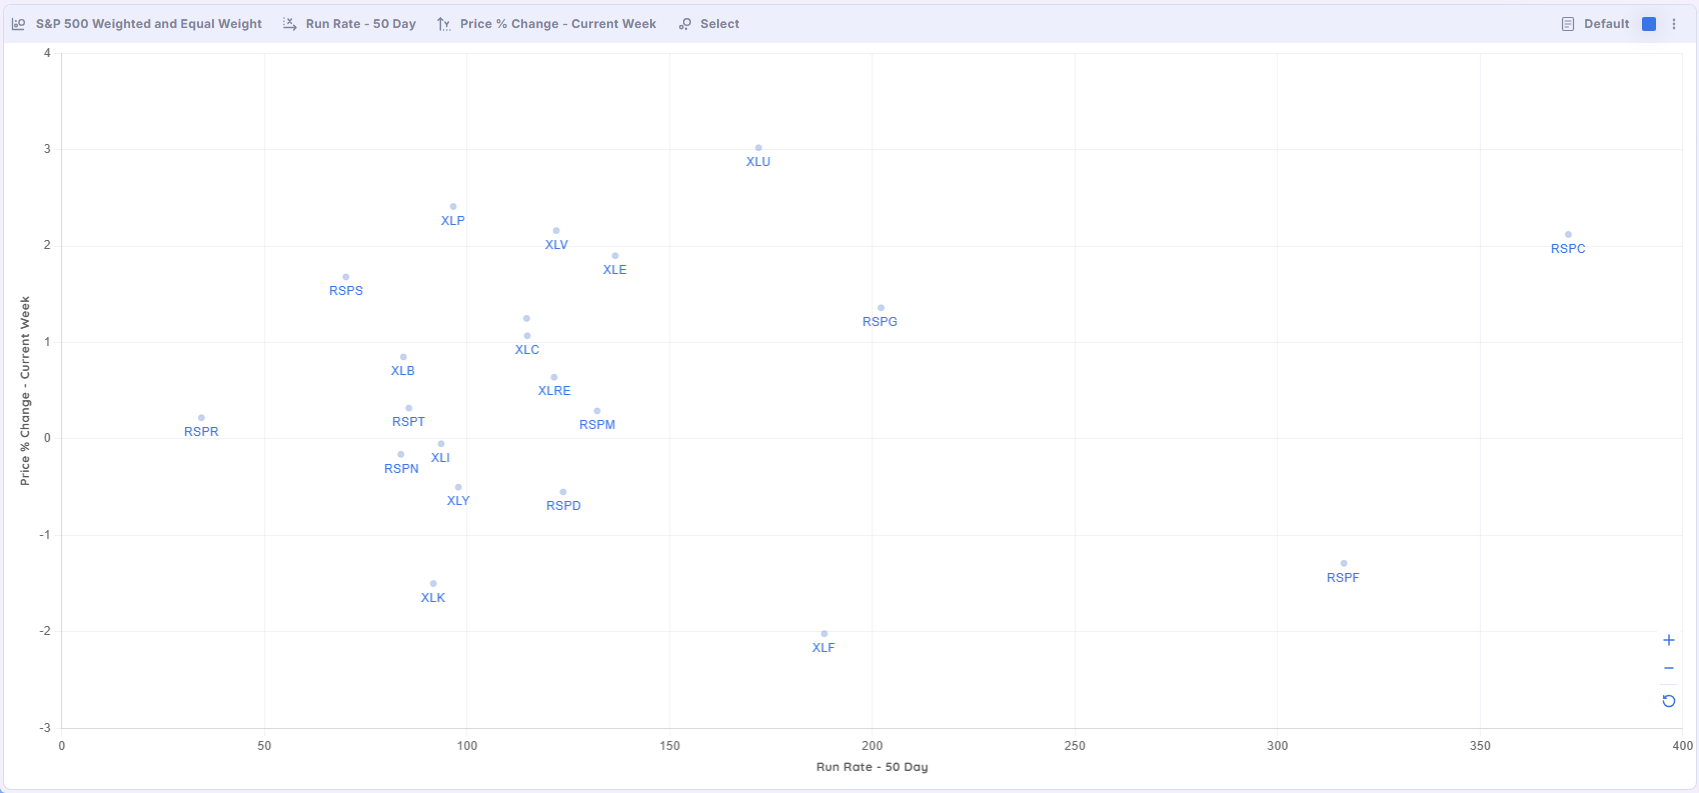
Swing-trader read
XLE and RSPG are the only things meaningfully holding up; everything else is correcting, with equal-weight factor ETFs getting hit harder than the SPX sectors, which keeps the tape narrow and energy‑tilted.
For newer Traders: What the axes are saying is below about the X/Y axis…
X‑axis (Run Rate – 50 Day) shows recent volume/participation versus the 50‑day baseline; farther right means more active than usual.
Y‑axis (Price % Change – Current Week) shows this week’s performance; higher is stronger, lower is weaker.
Standouts
RSPG (equal‑weight energy) sits top‑right: best weekly performance and strong activity, confirming broad participation in energy leadership, not just XOM/CVX.
XLE is the only SPX sector with positive week‑to‑date price, but its run‑rate is only mid‑pack, so it’s acting as a relative outperformer in a down tape rather than a high‑momentum leader.
XLC is slightly negative on the week but with moderate run‑rate, so comms is still holding up relatively well compared with cyclicals.
Weak, high‑risk areas
XLI, XLB, XLV, XLP, XLK, XLY all cluster between roughly −4% to −7% on the week, with mid‑to‑high run‑rates, meaning they’re in active distribution rather than sleepy pullbacks.
The equal‑weight suites (RSPD, RSPM, RSPN, RSPT, RSPF, RSPH, RSPR, RSPU, etc.) are mostly below −4% and left‑of‑center on run‑rate, so they’re getting price damage without a blow‑off in activity—classic “slow bleed” risk‑off from the broader market.
Market Carpet for the S&P 500 by Weekly Price Change
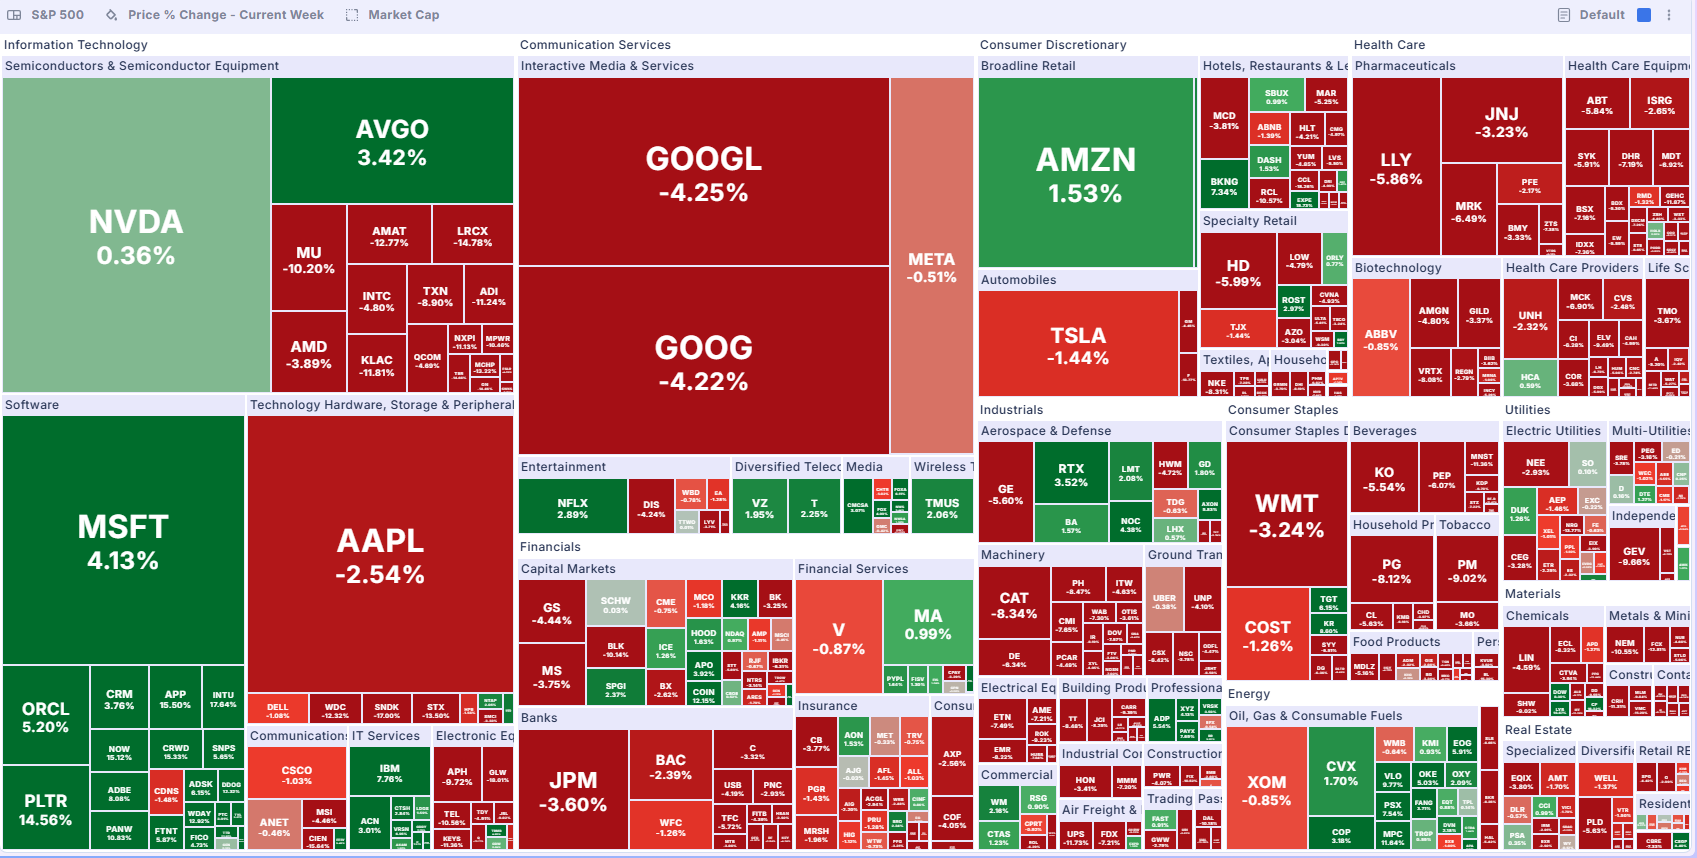
Big-picture read
Index leadership is extremely concentrated in a handful of mega-cap tech (MSFT, NVDA, AMZN, a bit of ORCL/PLTR) while the rest of the market is broadly sold.
That pattern is late‑stage bull / distribution‑ish: indexes can mask weakness because the generals are still marching while the troops are bleeding.
Long side:
Focus on names that are green in a sea of red with clear institutional sponsorship (MSFT, ORCL, PLTR‑type behavior), then we wait for low‑volume pullbacks into rising 10/20‑day MAs.
Within semis for the S&P 500 we have relative‑strength leaders NVDA and AVGO to watch rather than bottom‑fishing the deepest reds. Potential long entries there if we see signs of a market dip buy. For now, it is watch and see…
Psych Charts of note
NYMO
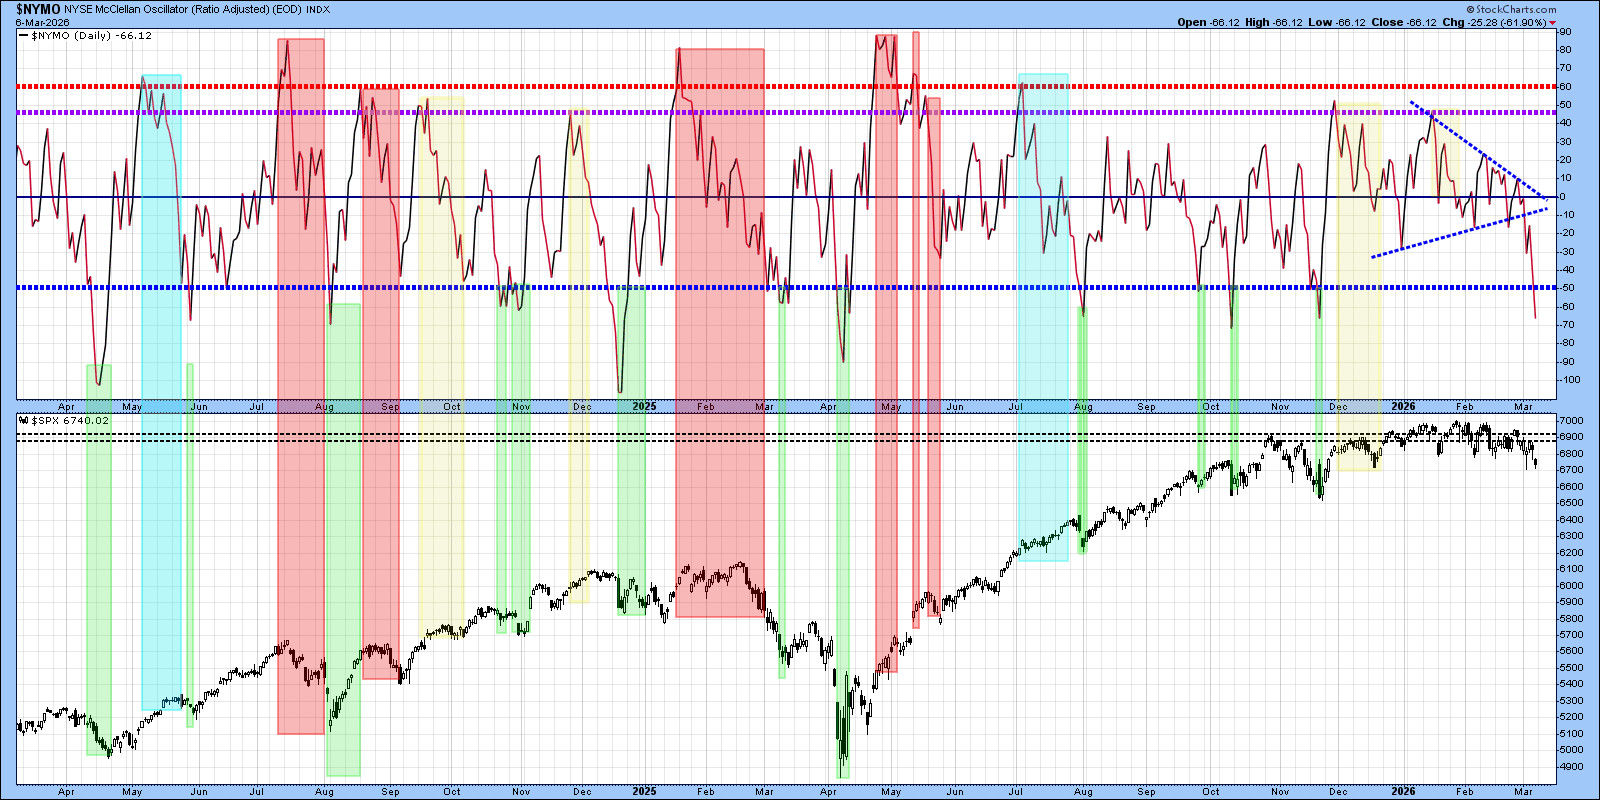
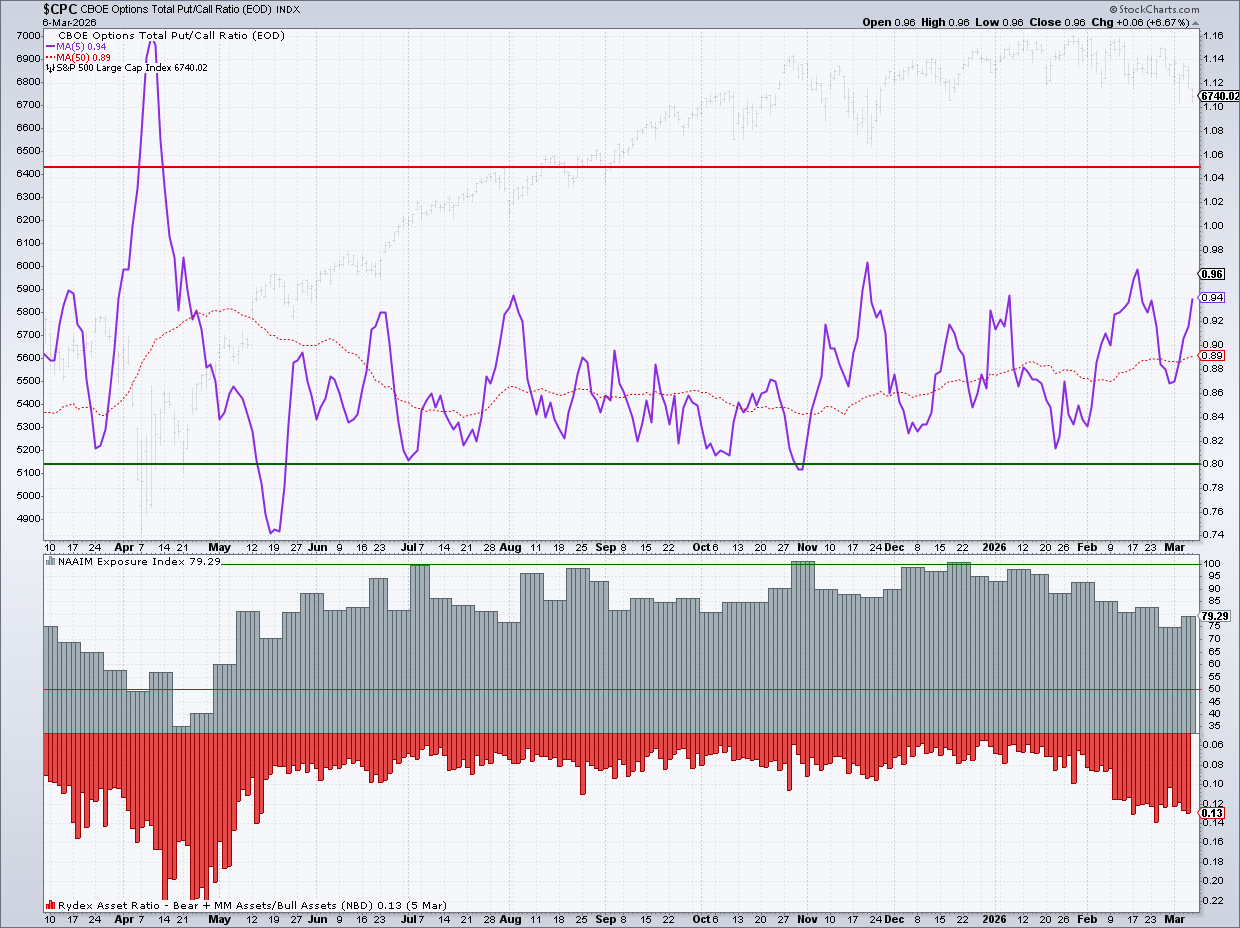
Last week we noted the wedge and said, “Getting tight… Big move coming…”. Well, it did… And now we are positioned all cash and waiting for signs of a bottom. We want to see the CPC total Put/Call ratio (below) exceed 1.04 or start to fade somewhere up there and then we really want to aggressively hit those follow through days that often follow. We still won’t know if it will work, but the stock gods favor that attempt when it occurs.

So, what does it all mean Nigel? It means there is more downside from a technical standpoint. But remember we are in a news driven President Trump world. With a simple X post things can change, so keep your alerts on. I follow @stocktalkweekly and @wallstengine on X for just such reasons. Also in our discord I have alerts set for them.
THE BELOW IS WHAT WE SAID LAST WEEK and last week’s pic of HYIOAS. I learned from Stock Talk Weekly and other great traders that you can actually manage risk into these events almost always… There were clear signs. Read the below if you still don’t “Get it”. So many warnings…
ICE BofA US High Yield OAS (option‑adjusted spread)
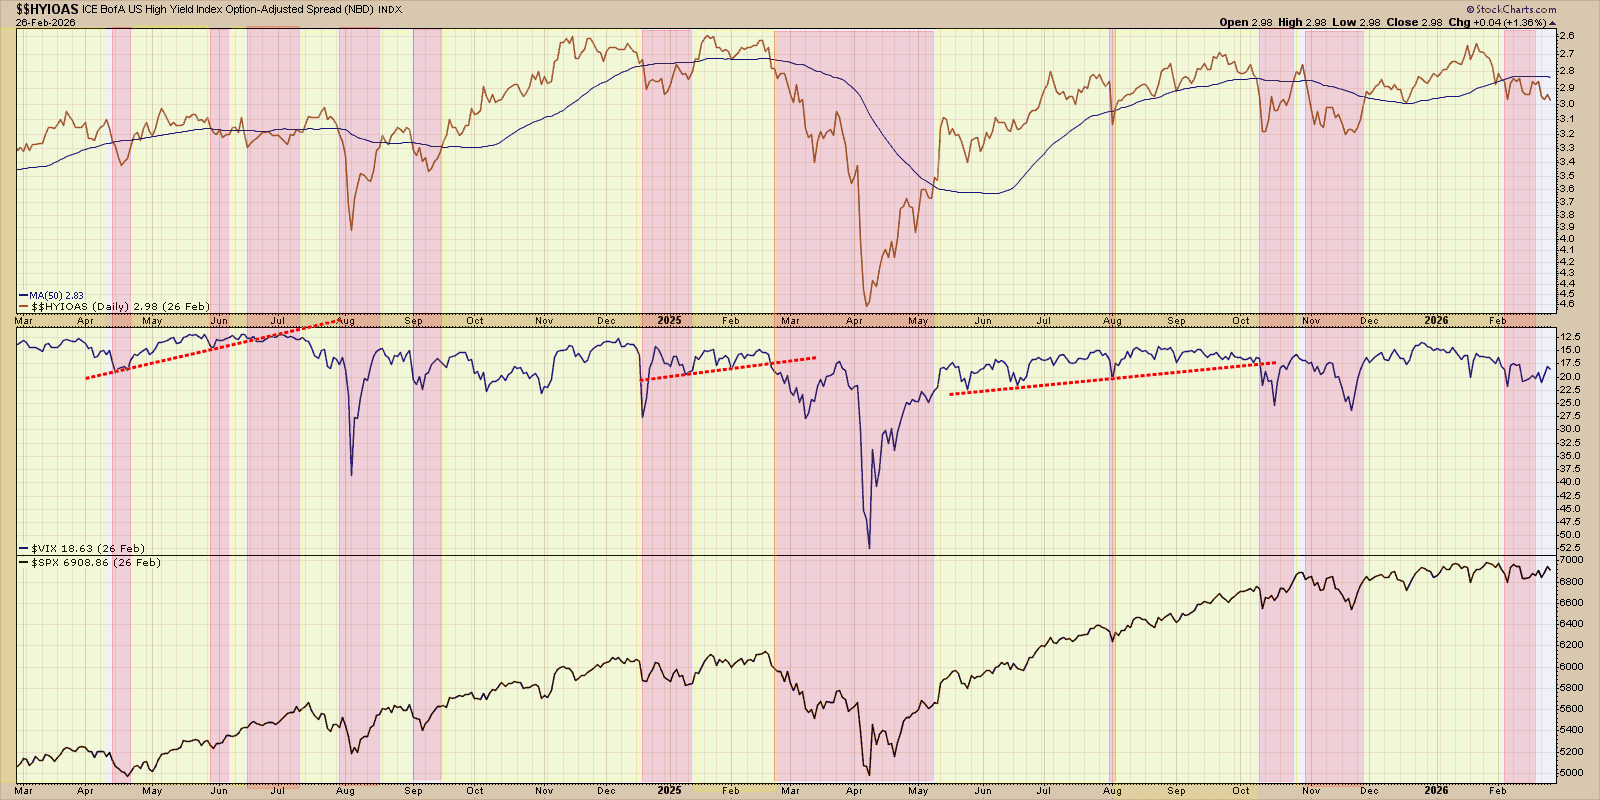
Noted last week that we were not seeing positive connections to HYIOAS…
Key divergences
HY OAS has made a series of higher lows and a gentle uptrend since mid‑2024 instead of continuing to compress, showing incrementally rising credit stress despite higher equity prices.
VIX is not at panic levels but is also carving higher lows rather than collapsing, which aligns with a market that is grinding higher on narrowing breadth and increasing hedging, not euphoric risk‑on.
Historically, sustained widening of high‑yield spreads and a rising VIX tend to precede or accompany equity pullbacks, because investors demand more compensation for risk and hedge more aggressively
In other words, S&P 500 going up but Credit Stress and VIX (volatility) are too. Classic, ride the price until it breaks, and then get the hell out of the way. When that happens, nobody knows. That’s what makes this the last great game IMO…
Anyways… Back to the upcoming week…
GOLD and DXY
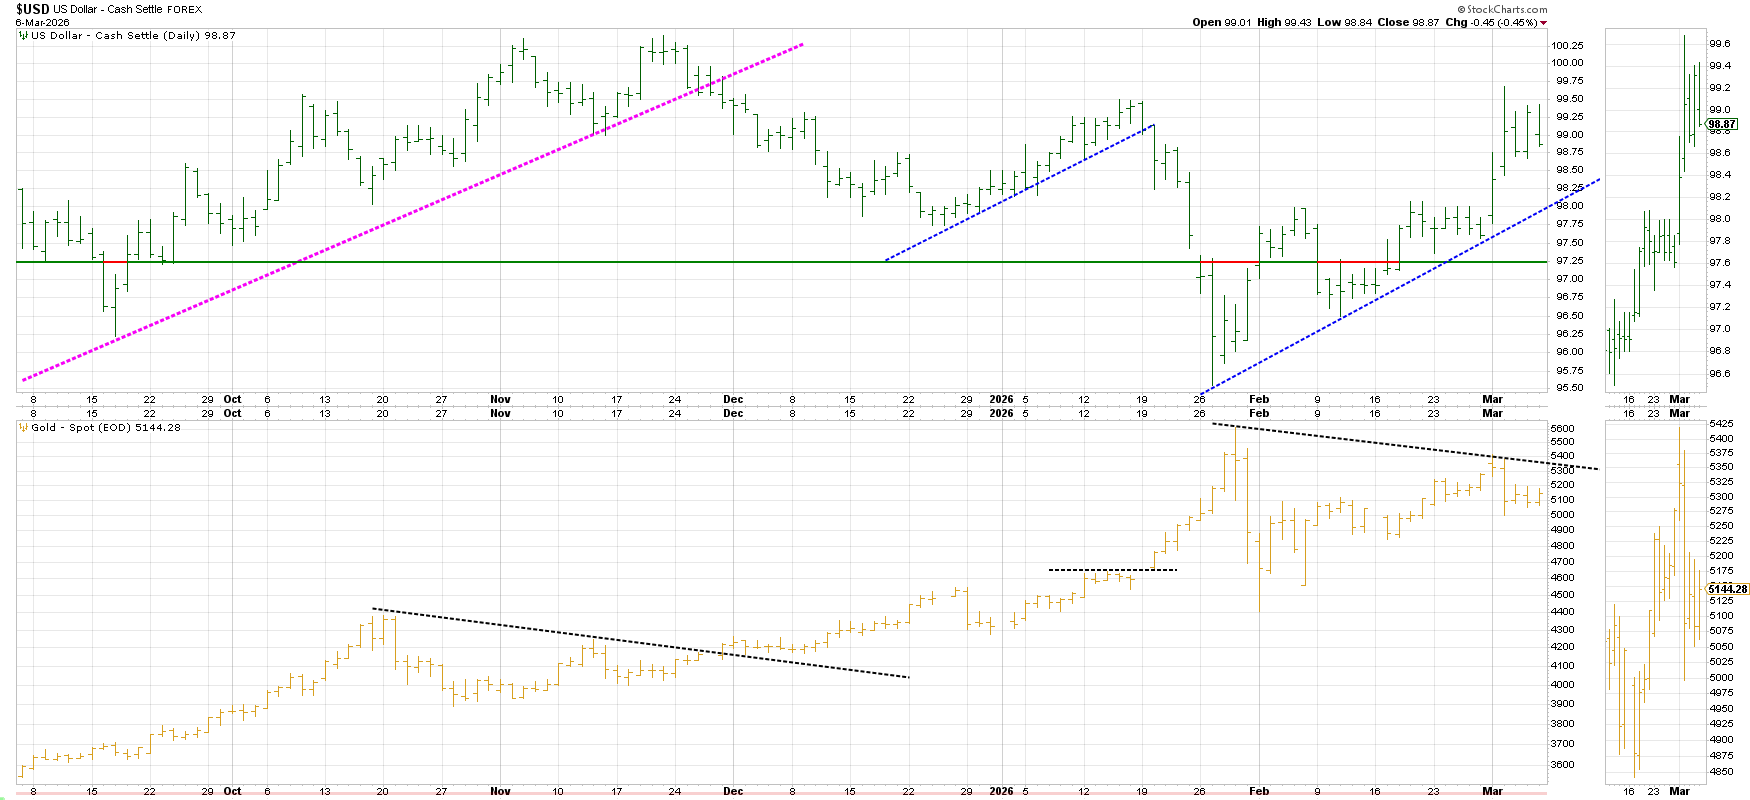
Beautiful Divergence setting up with DXY and Gold above…
SPY
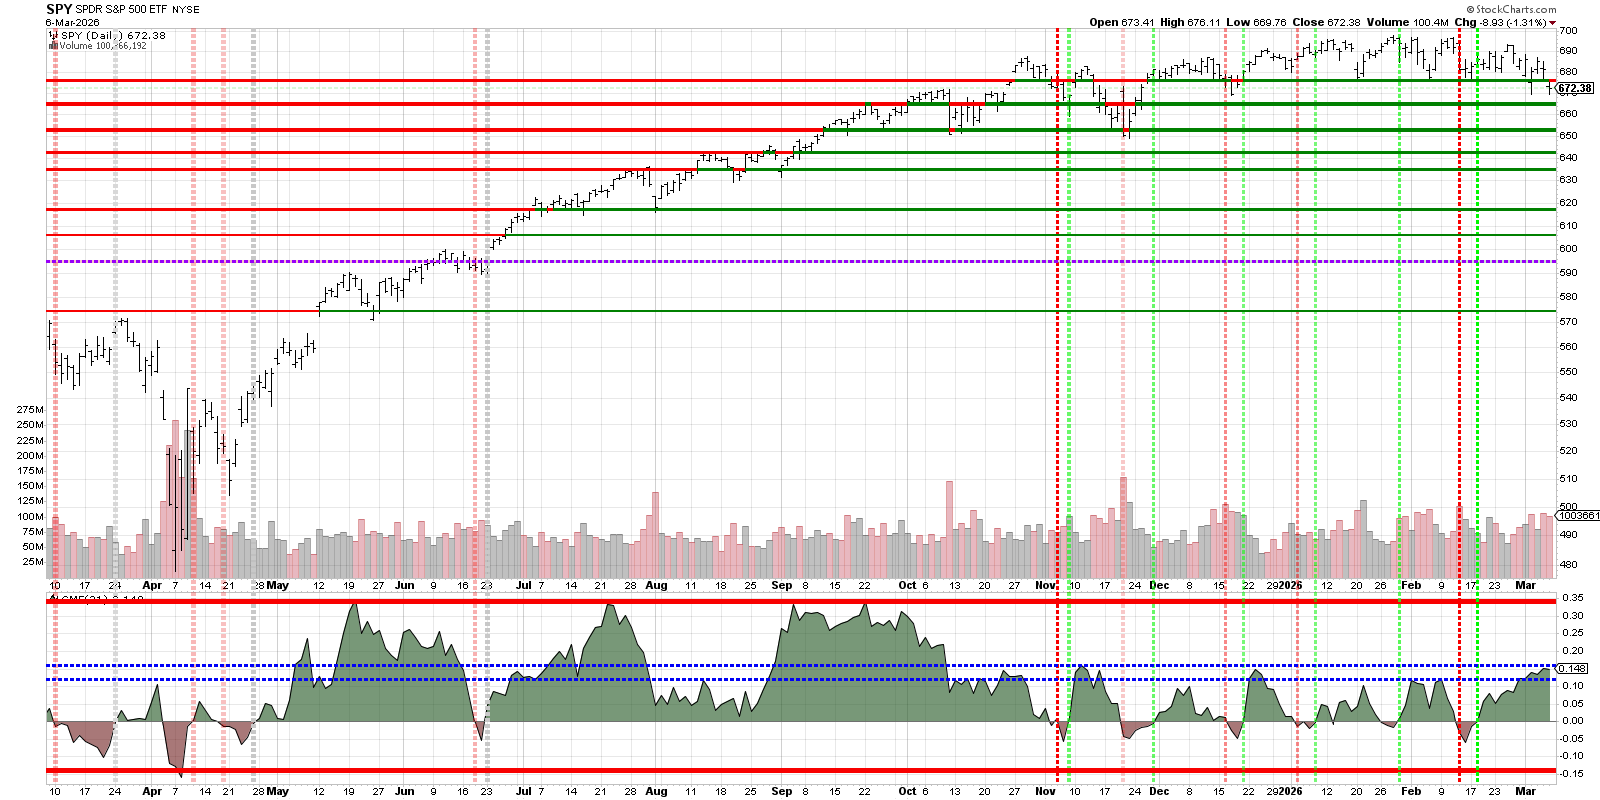
BANG YOUR HEAD… SPY now has overhead…
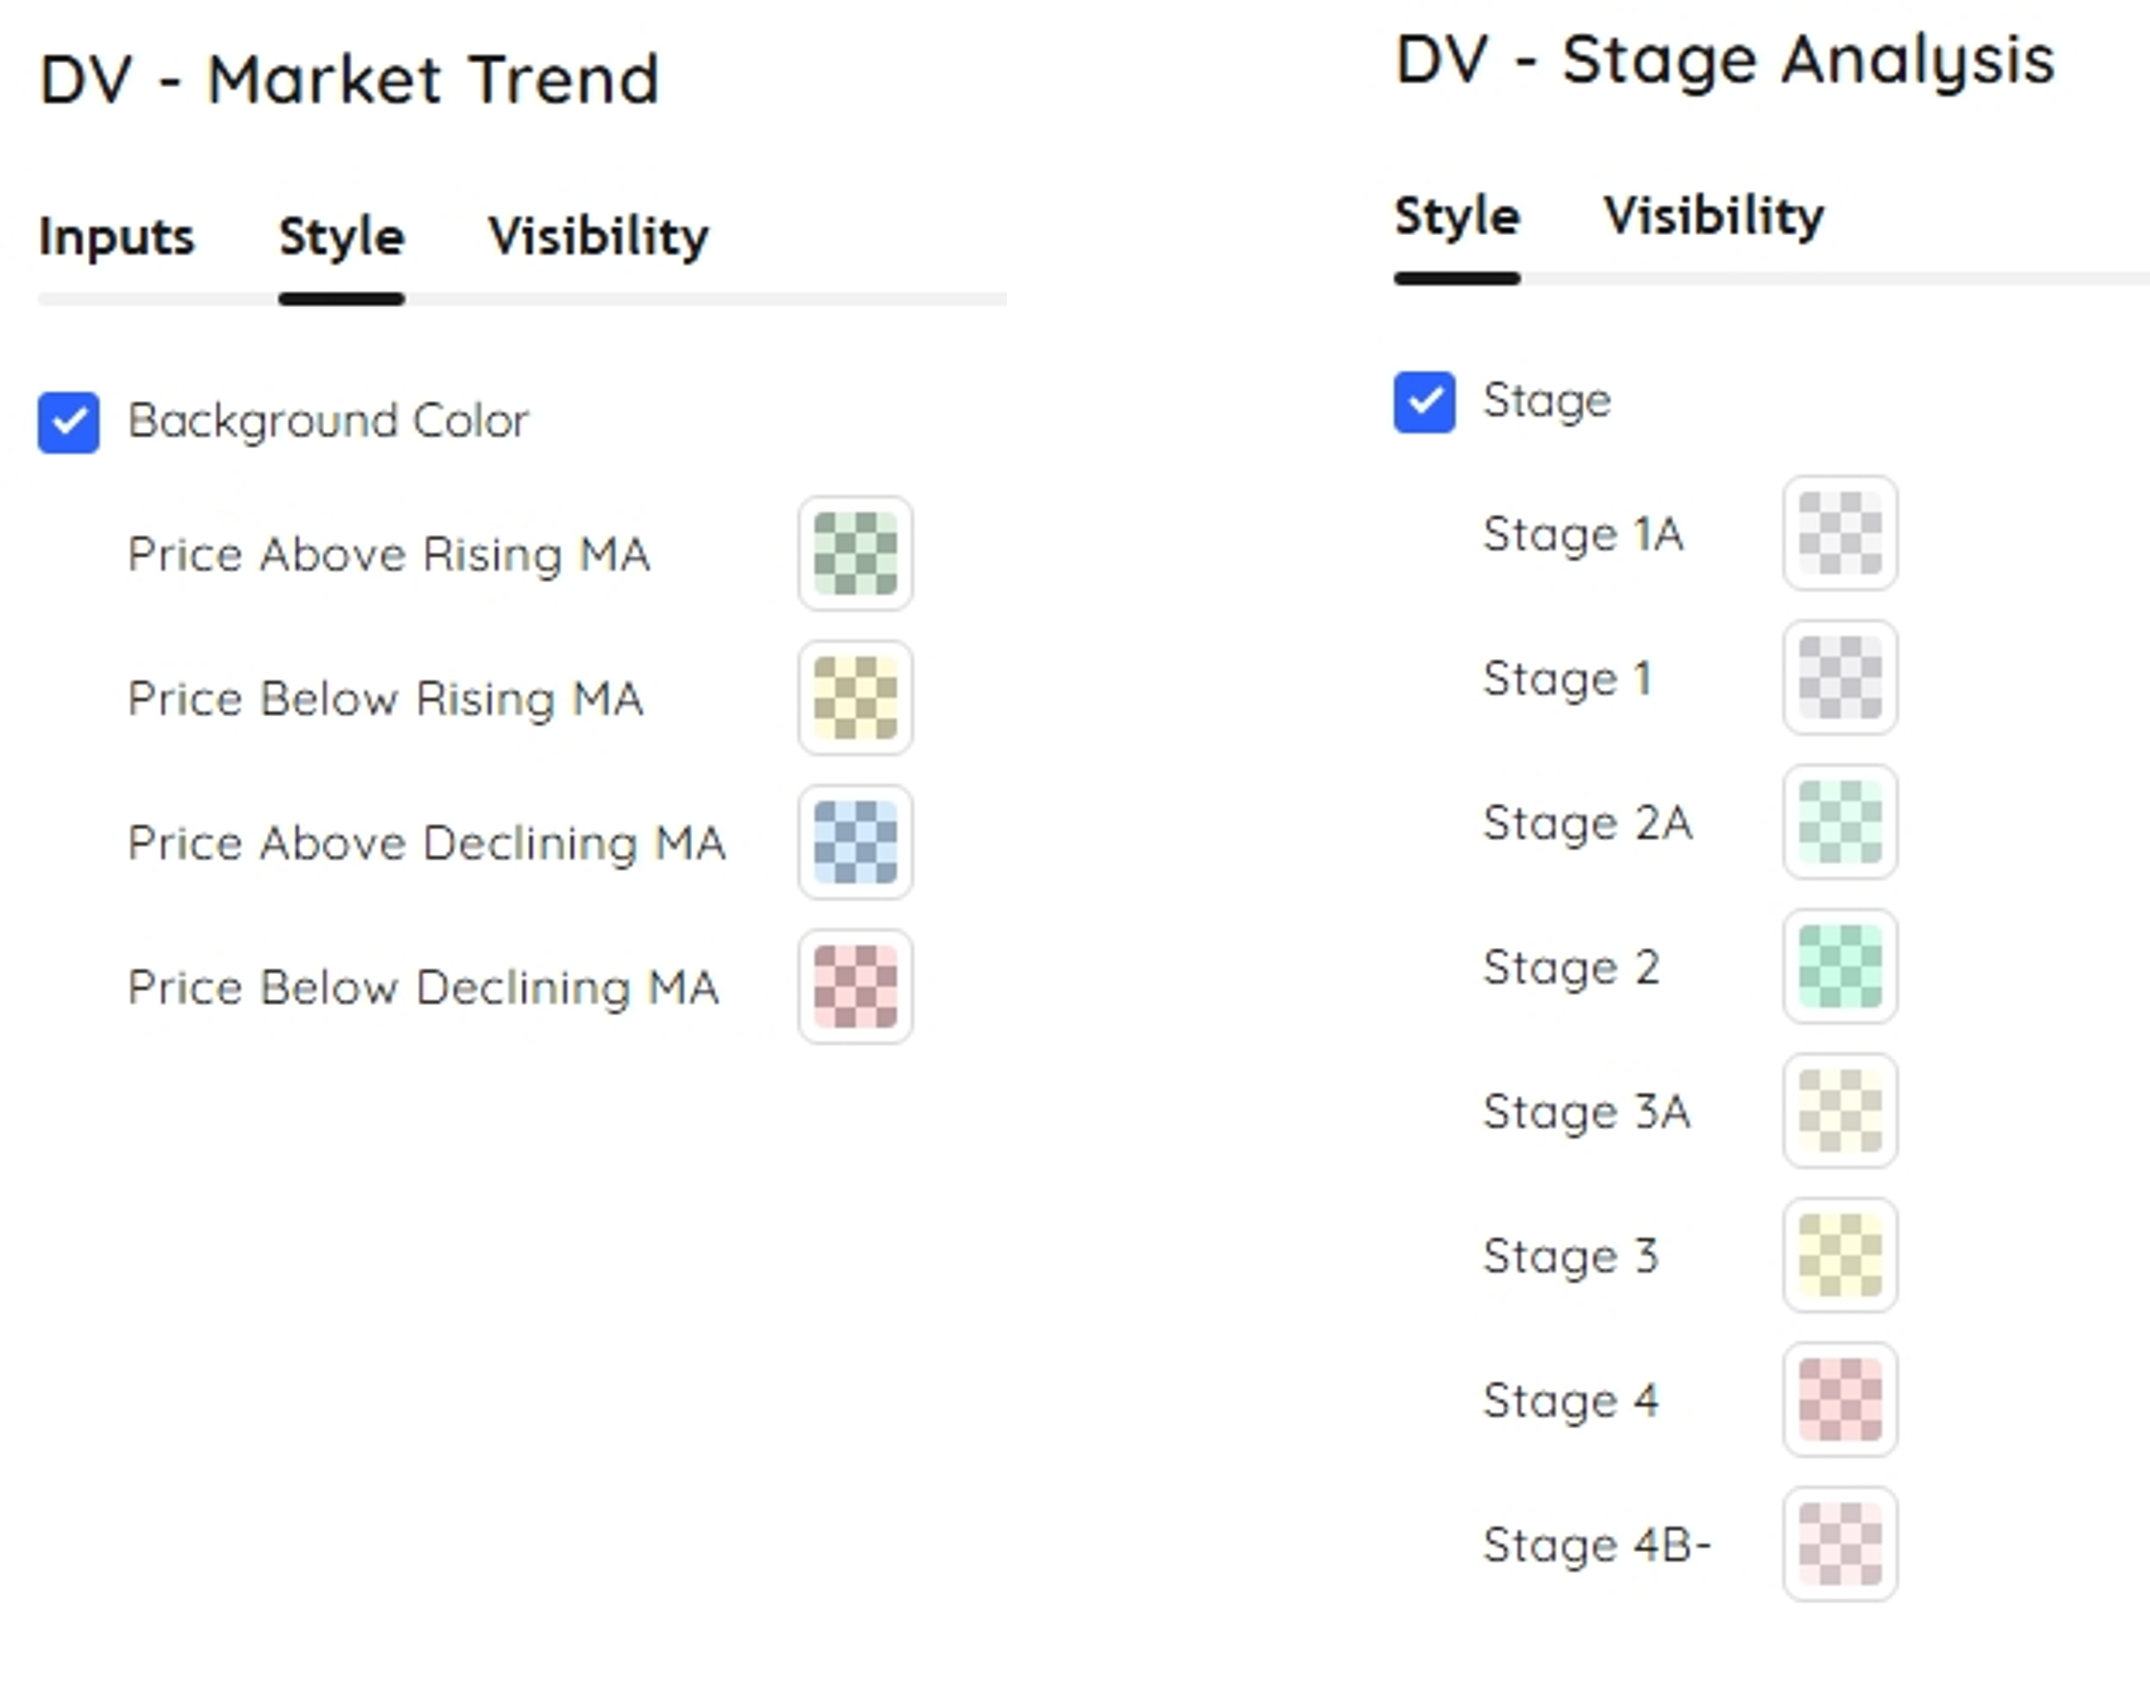
SPY Deepvue Market Trend
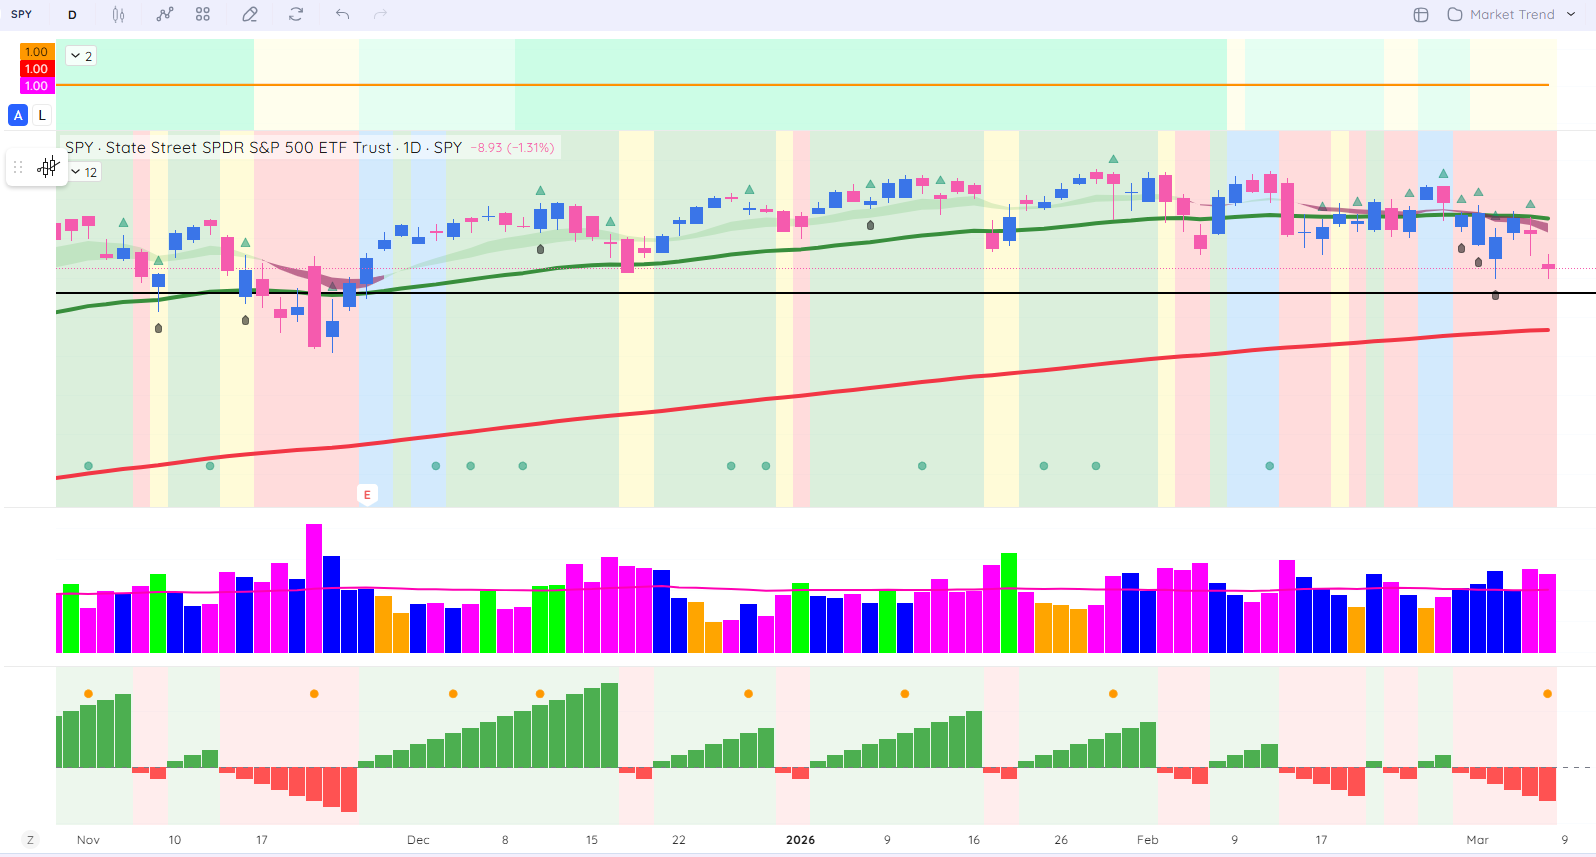
Red and leaning redder…
SPY chart with Deepvue market trend analysis
We are somewhat green… We have a new cycle trying to start so we want to participate. I have my eye on a group of semi-conductors. Albeit we are only in stage 2A for the Weinstein Stage Analysis.
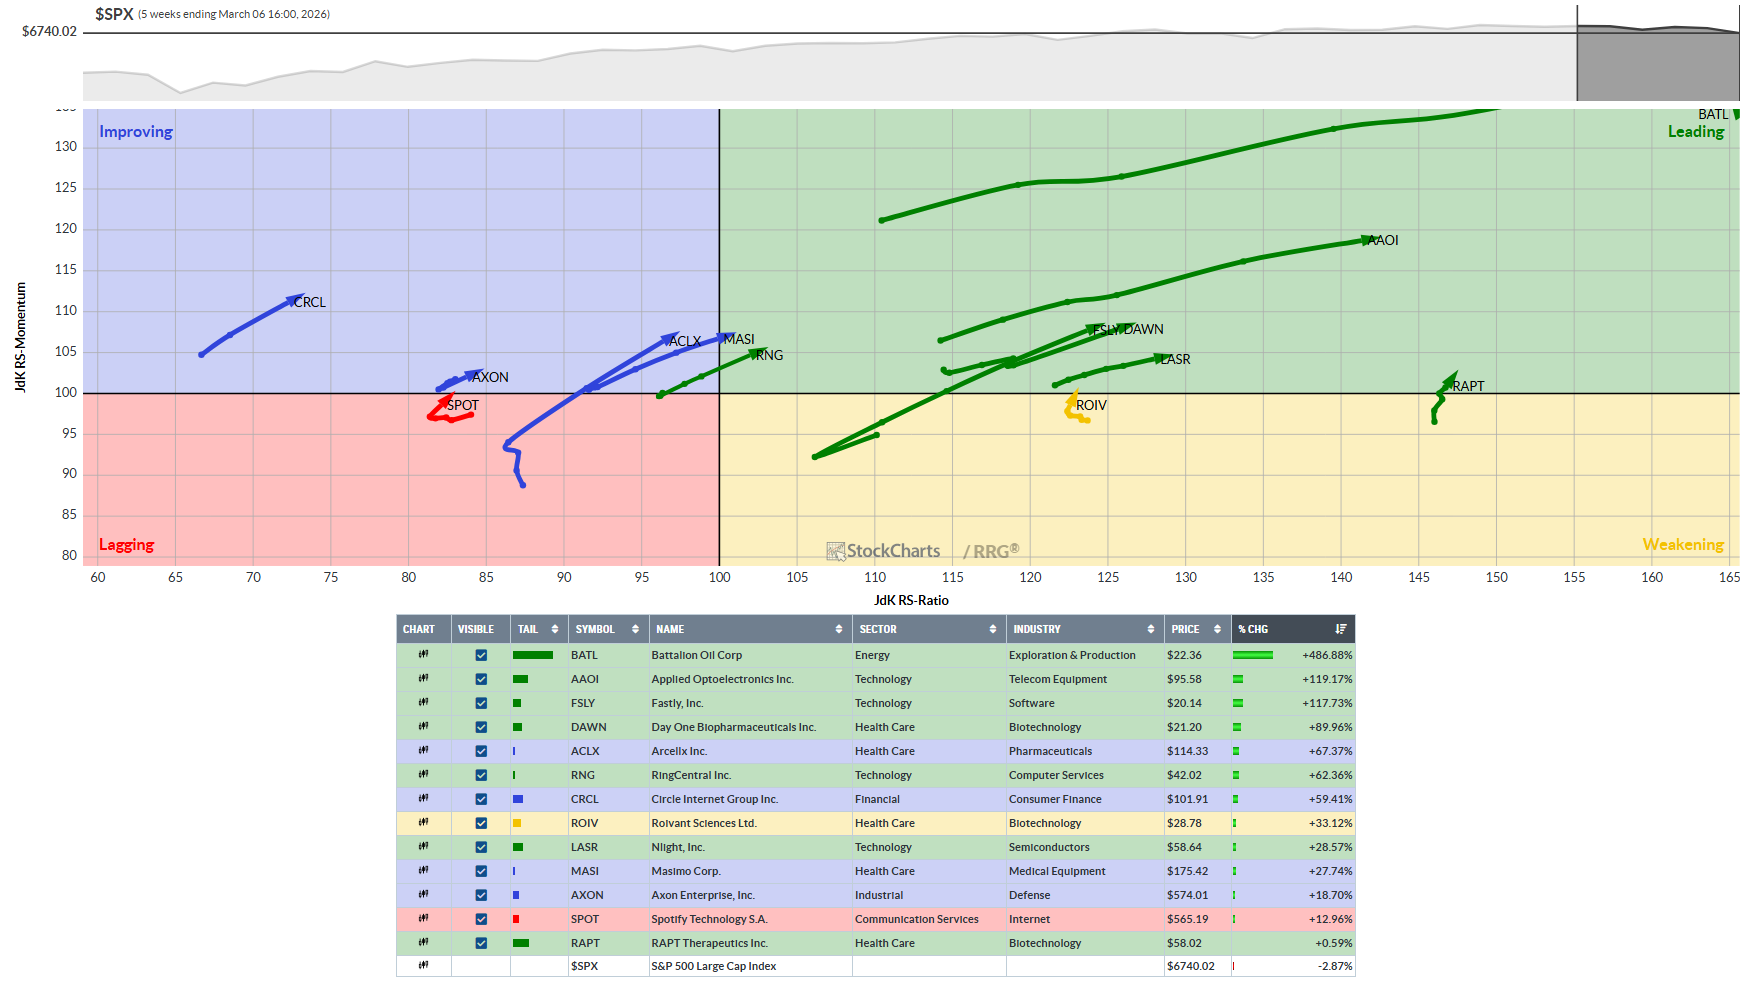
Weekly- Relative Rotation Graph (RRG)
This chart provides a relative strength and momentum snapshot for all S&P sector ETFs against the SPY over the 5-week period.
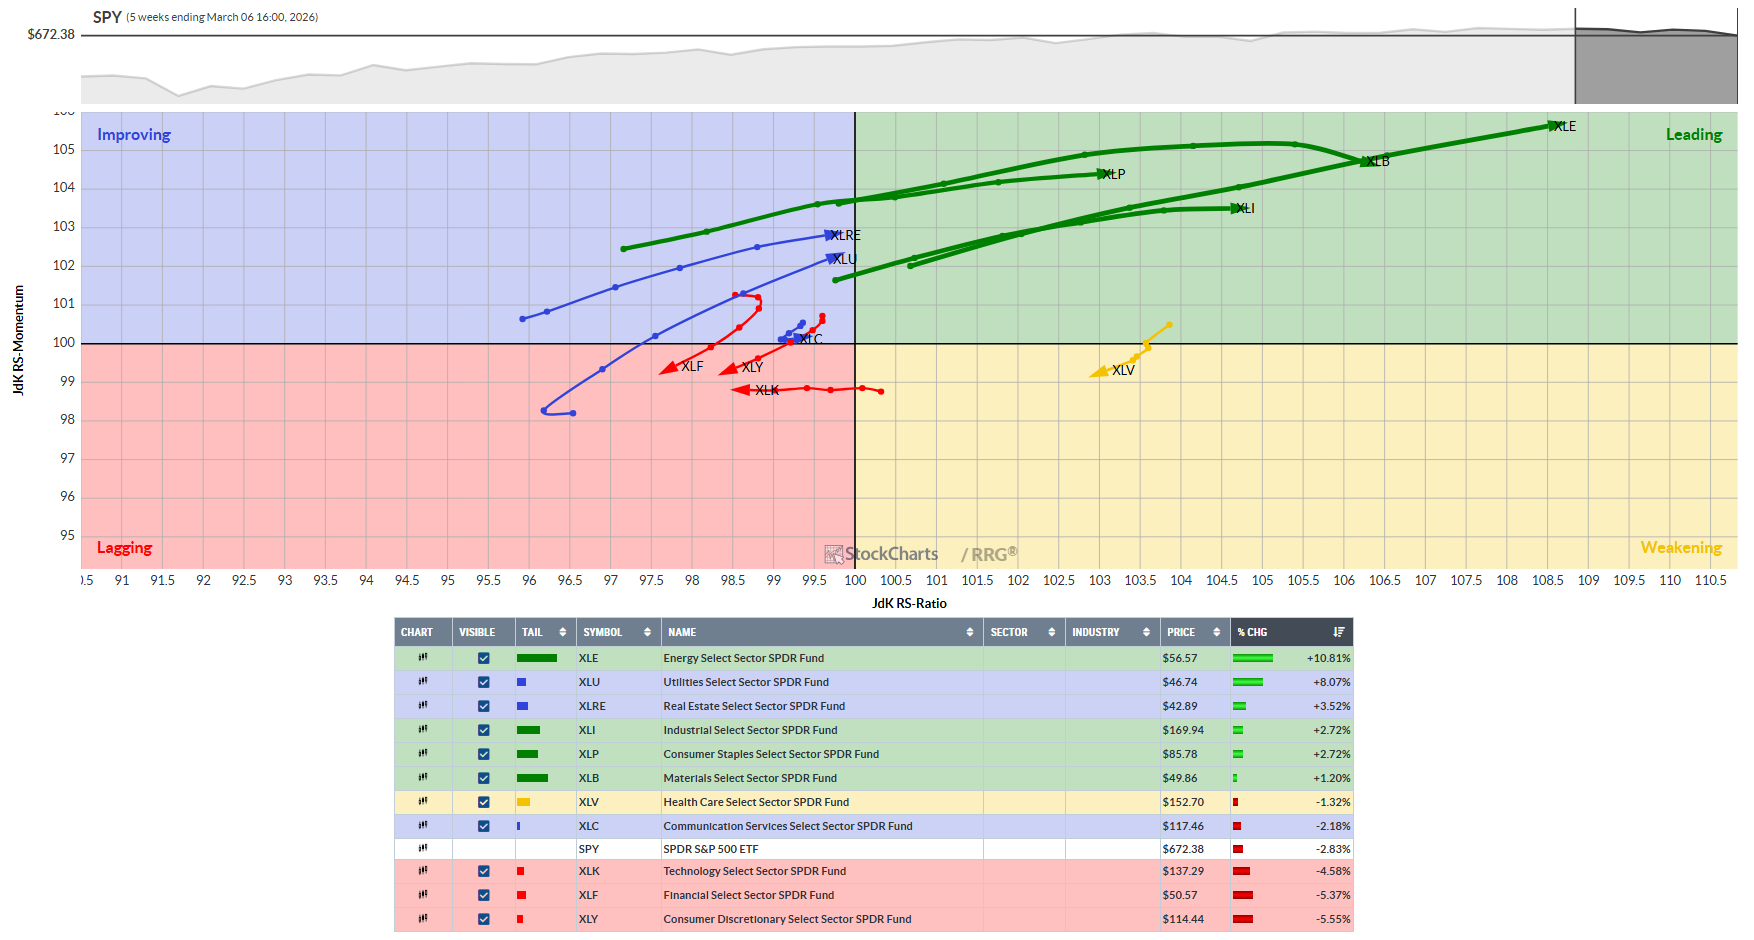
XLU looking good here to take on leadership. Potentially XLRE too.
Before we look further at the S&P 500 sectors, let’s look at the offensive versus defensive chart below…
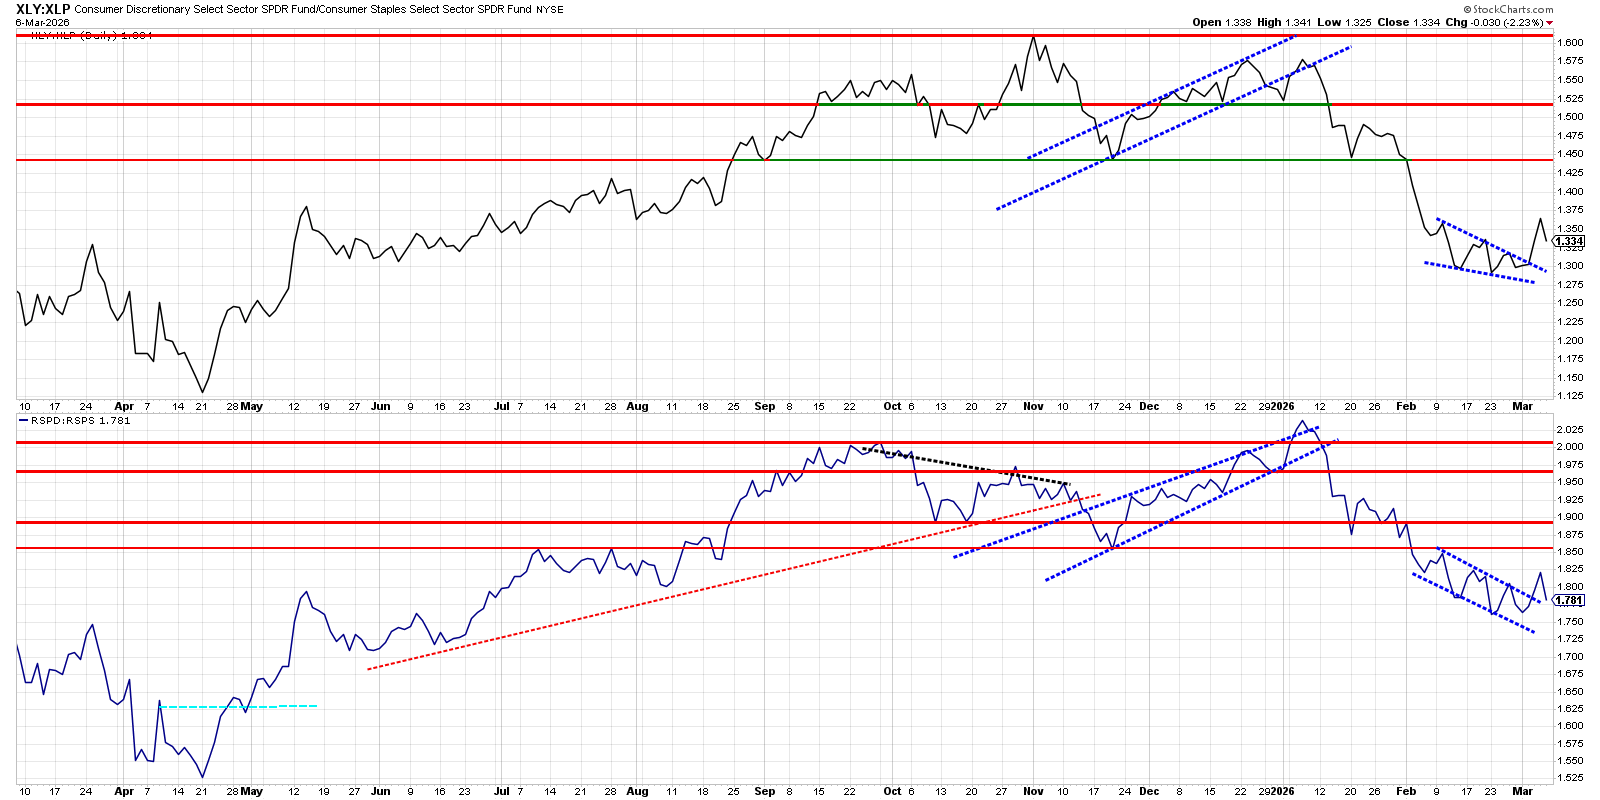
XLY is losing relative strength vs XLP, and RSPD is losing vs RSPS, with both pairs breaking prior RS uptrends and now sliding in bearish channels; current consolidations look like continuation flags to the downside.
Growth versus Spy
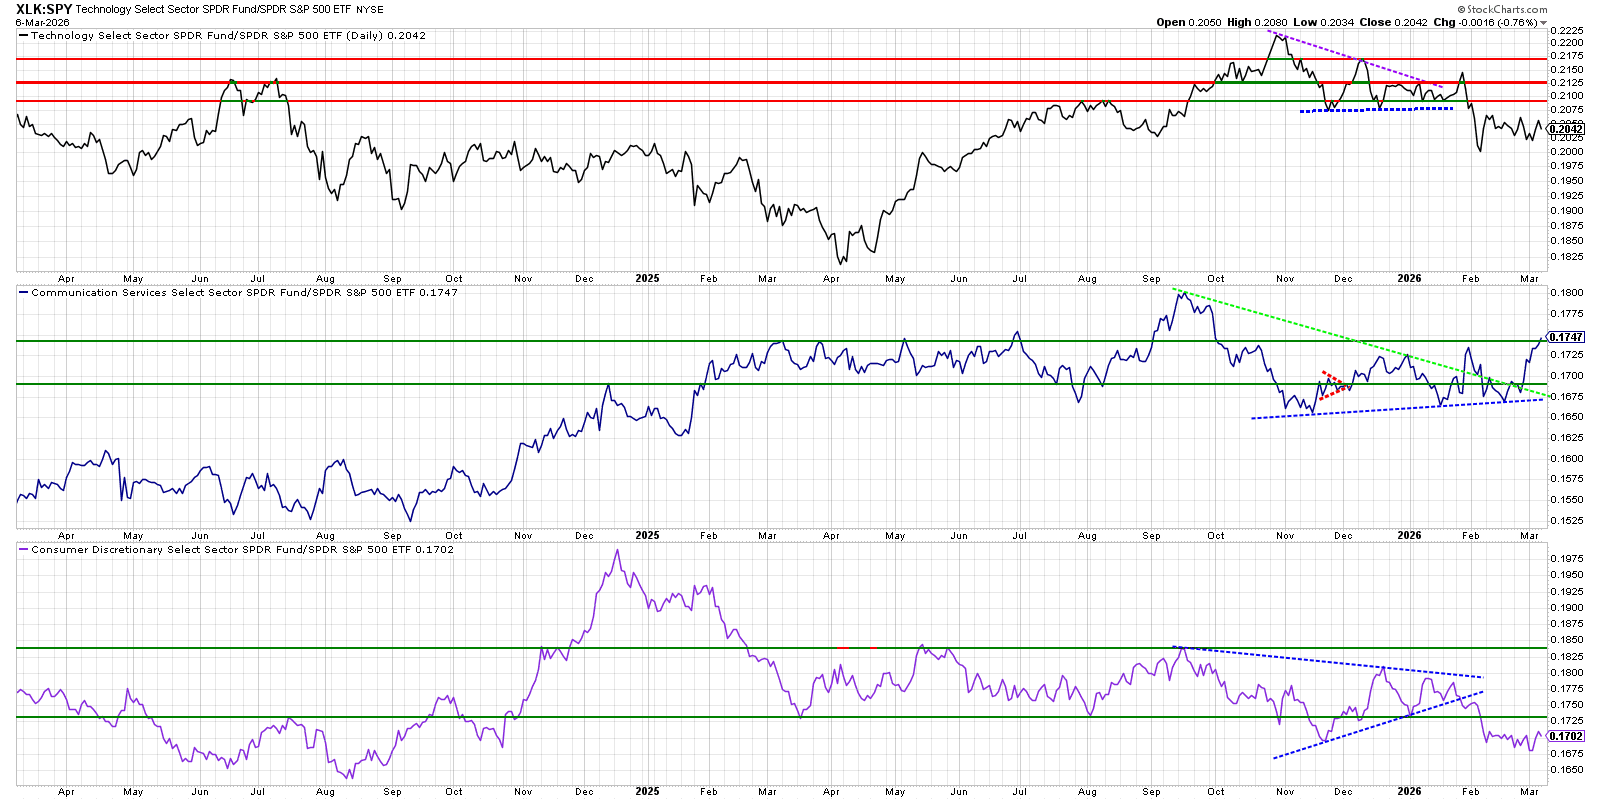
Trading implications
For swing ideas, prioritize long exposure in XLC names while being selective in XLK, and avoid or short‑bias XLY until its RS structure improves.
Liquid Leaders Growth with Bullish RRG: BATL, AAOI, FSLY, DAWN, ACLX, RNG, CRCL, ROIV, LASR, MASI, AXON, SPOT, RAPT
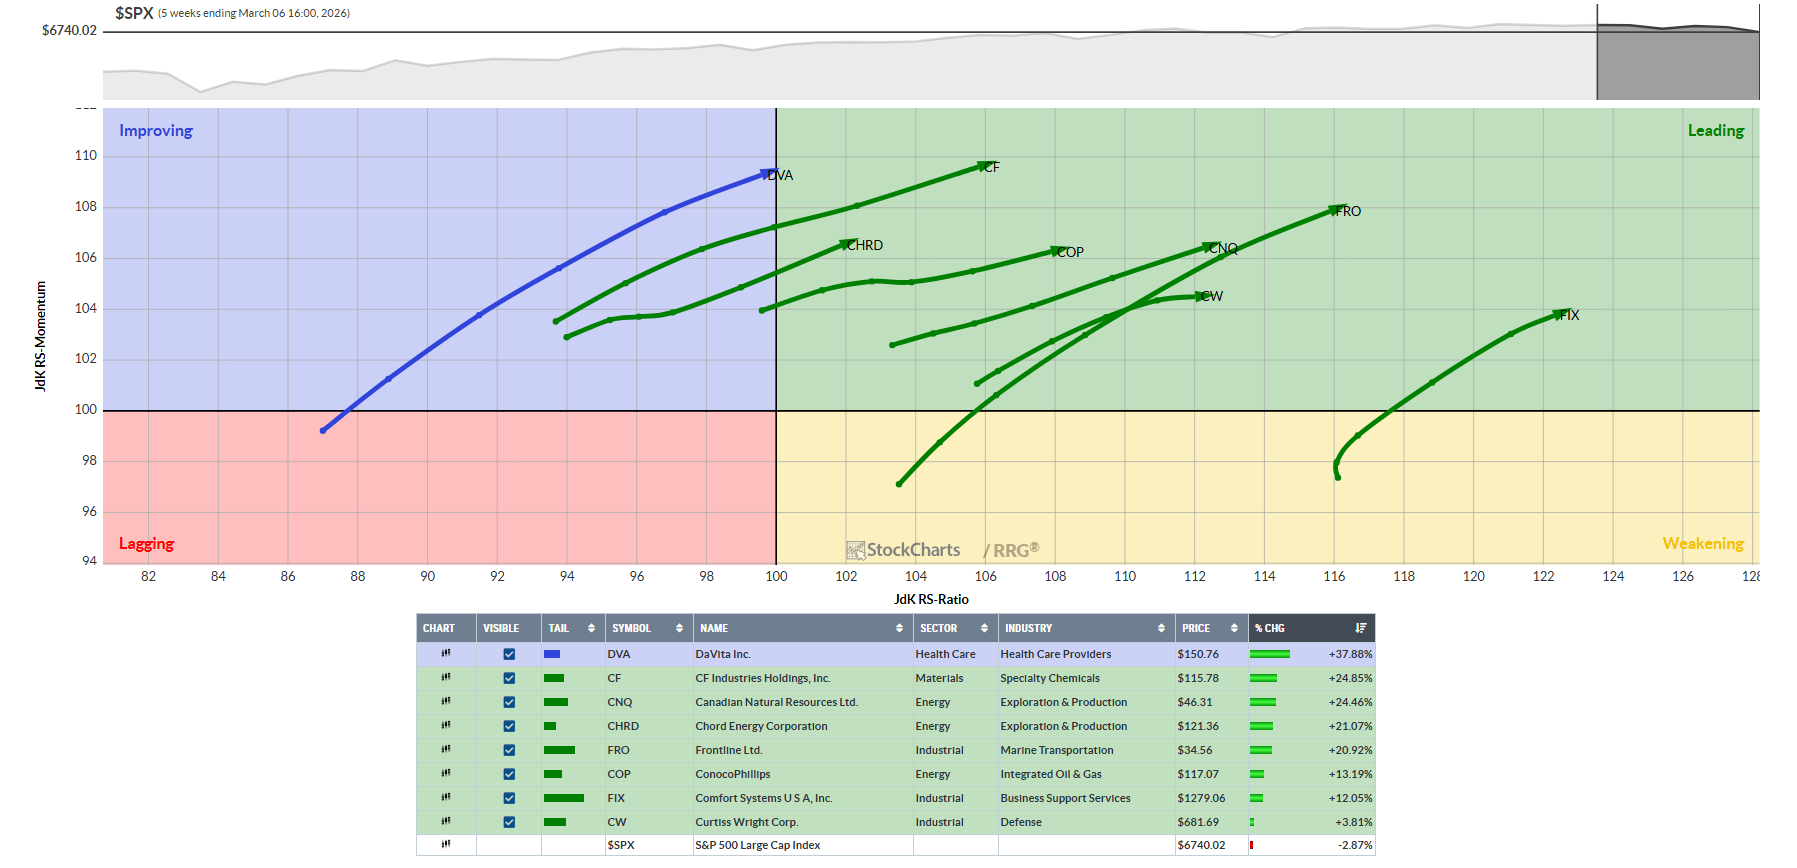
Value versus SPY
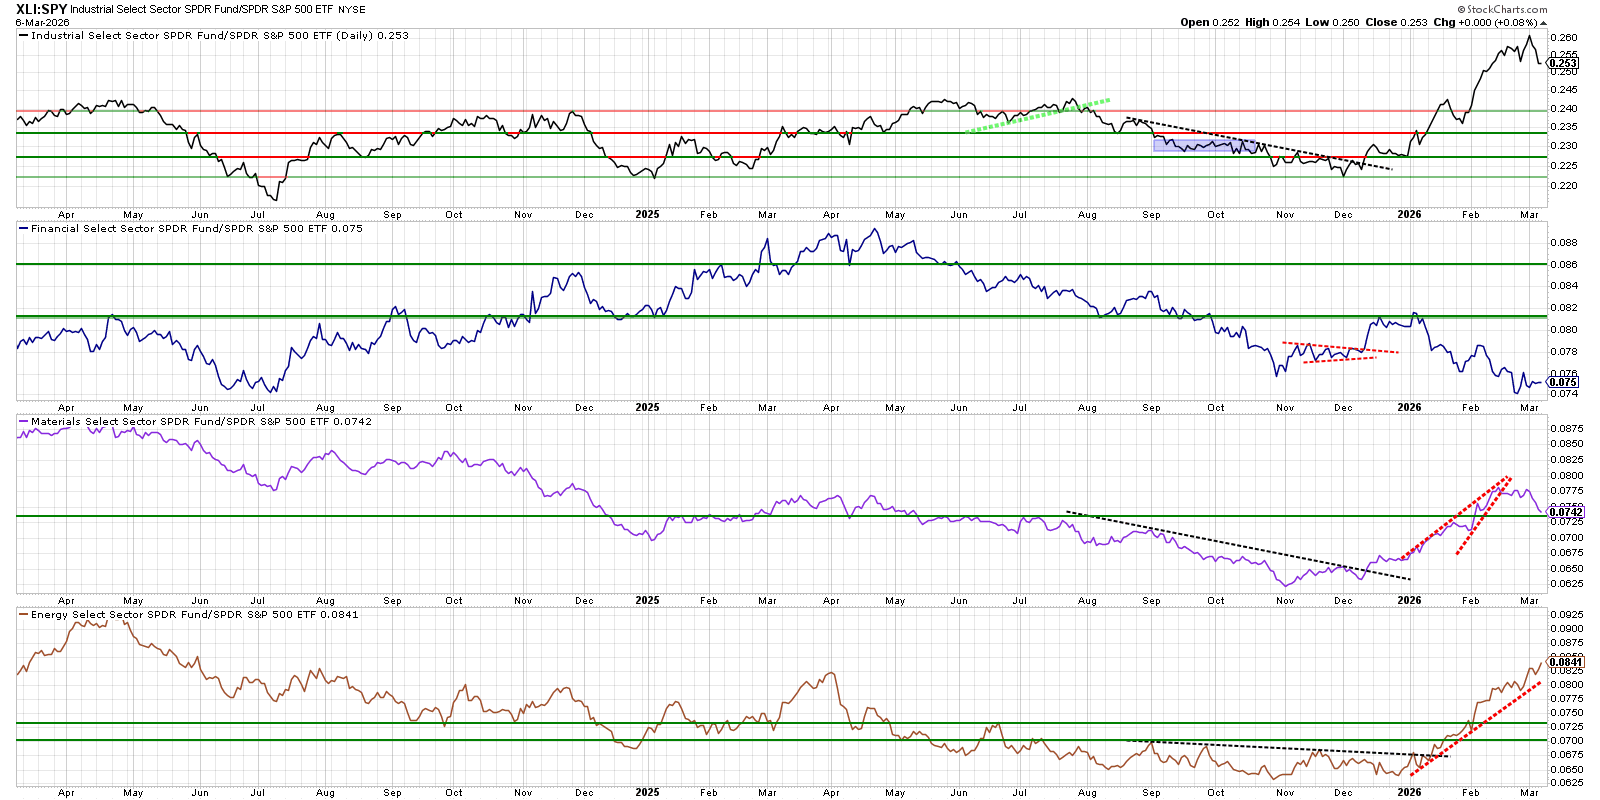
XLI has been and XLE is clearly emerging as relative-strength leaders vs SPY, while XLF lags and XLB is trying to turn up but is less convincing so far.
Liquid Leaders Bullish Value RRG tickers: DVA, CF, CNQ, CHRD, FRO, COP, FIX, CW
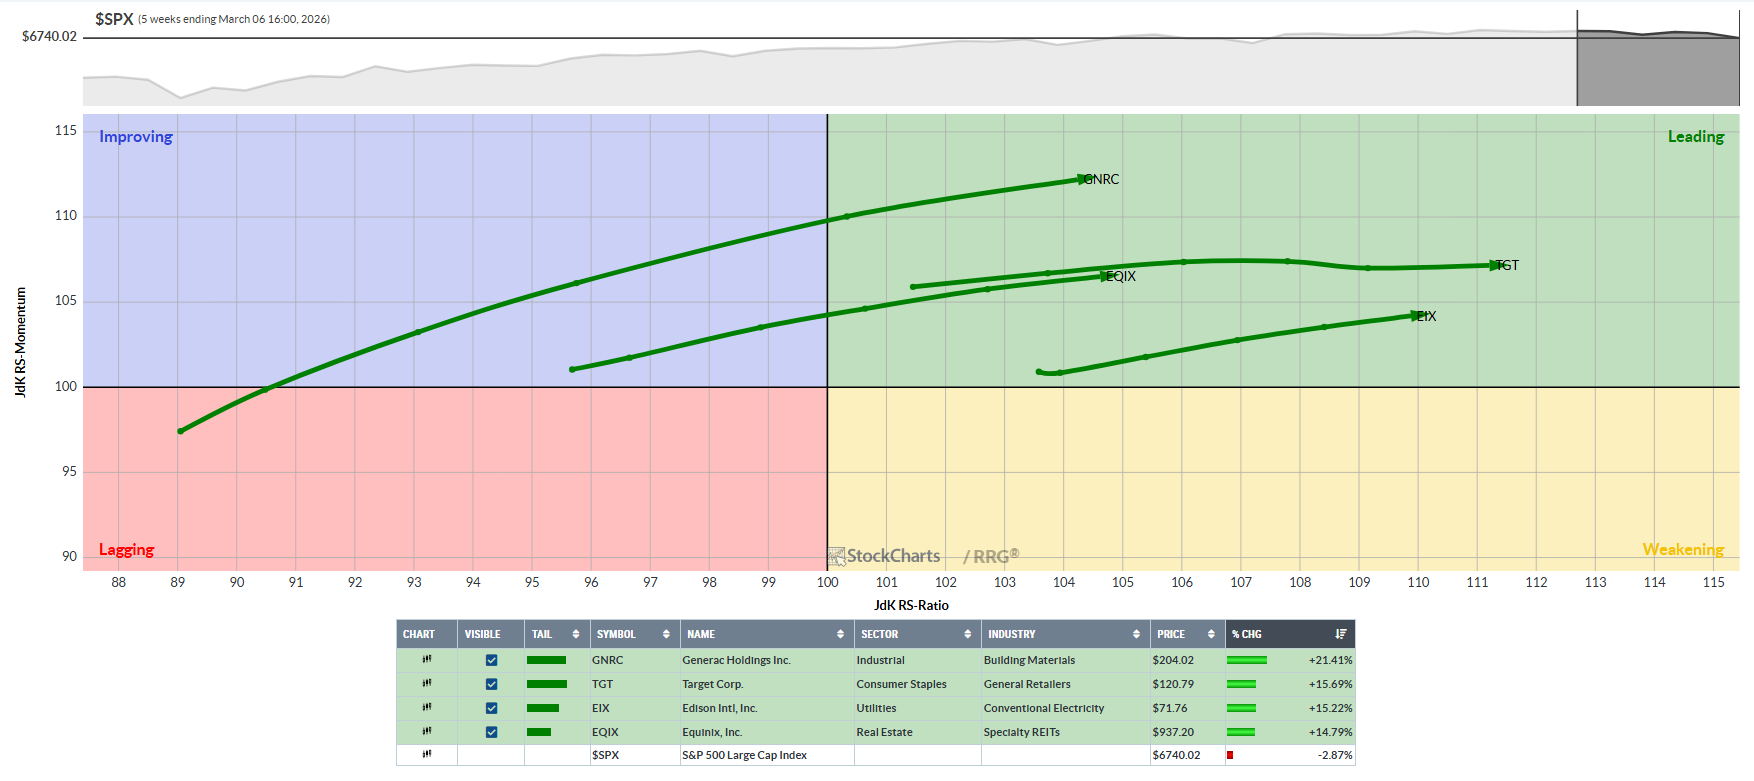
Defensives versus SPY
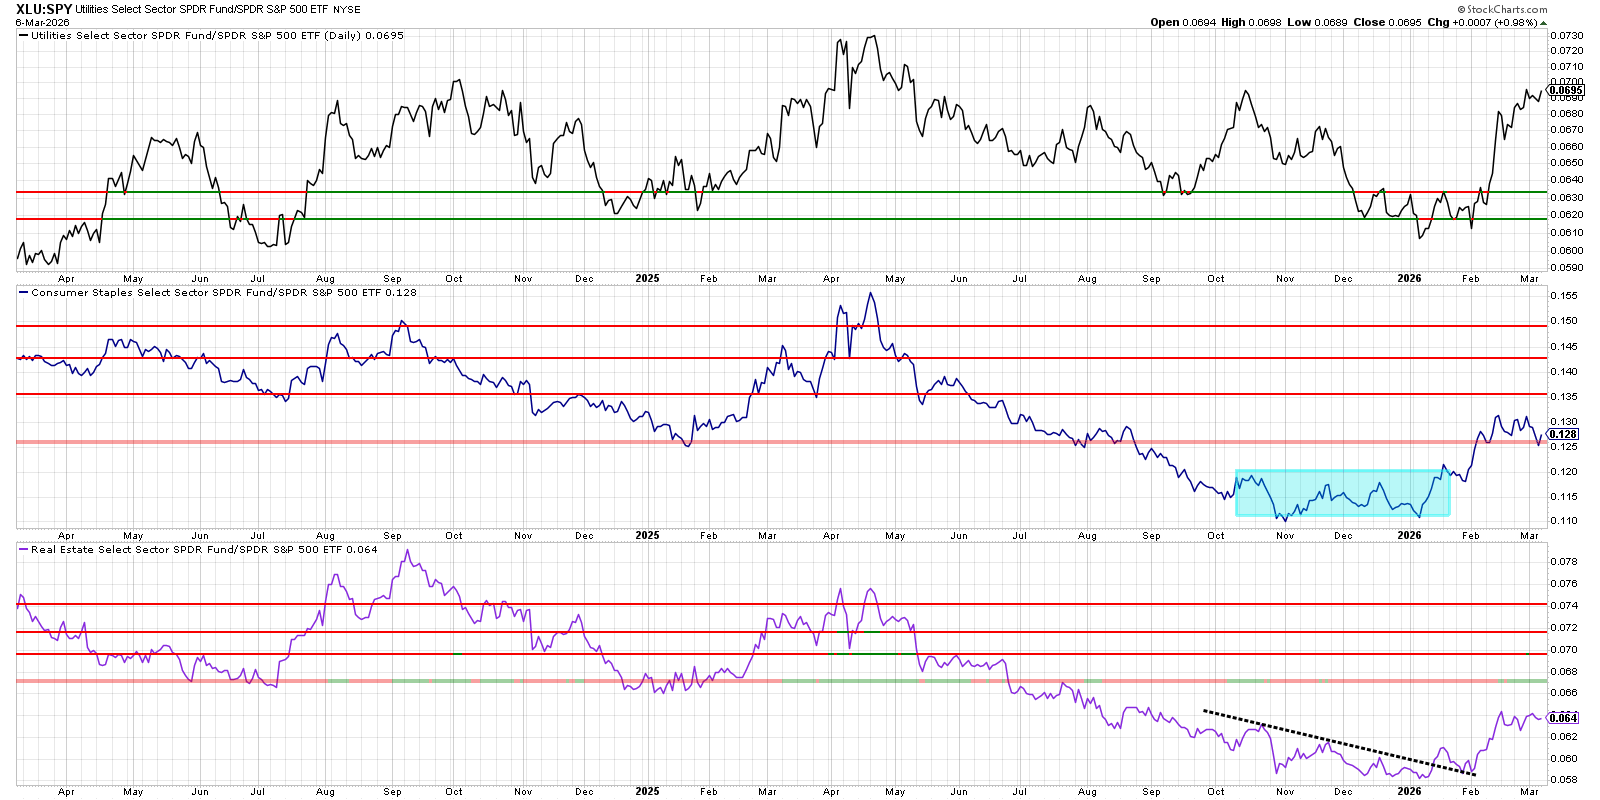
Trading takeaways:
Taken together, the chart shows “defensive rotation,” but it is strongest in utilities, improving in staples, and not yet confirmed in real estate.
Liquid Leaders Bullish Defensive RRG tickers: GNRC, TGT, EIX, EQIX
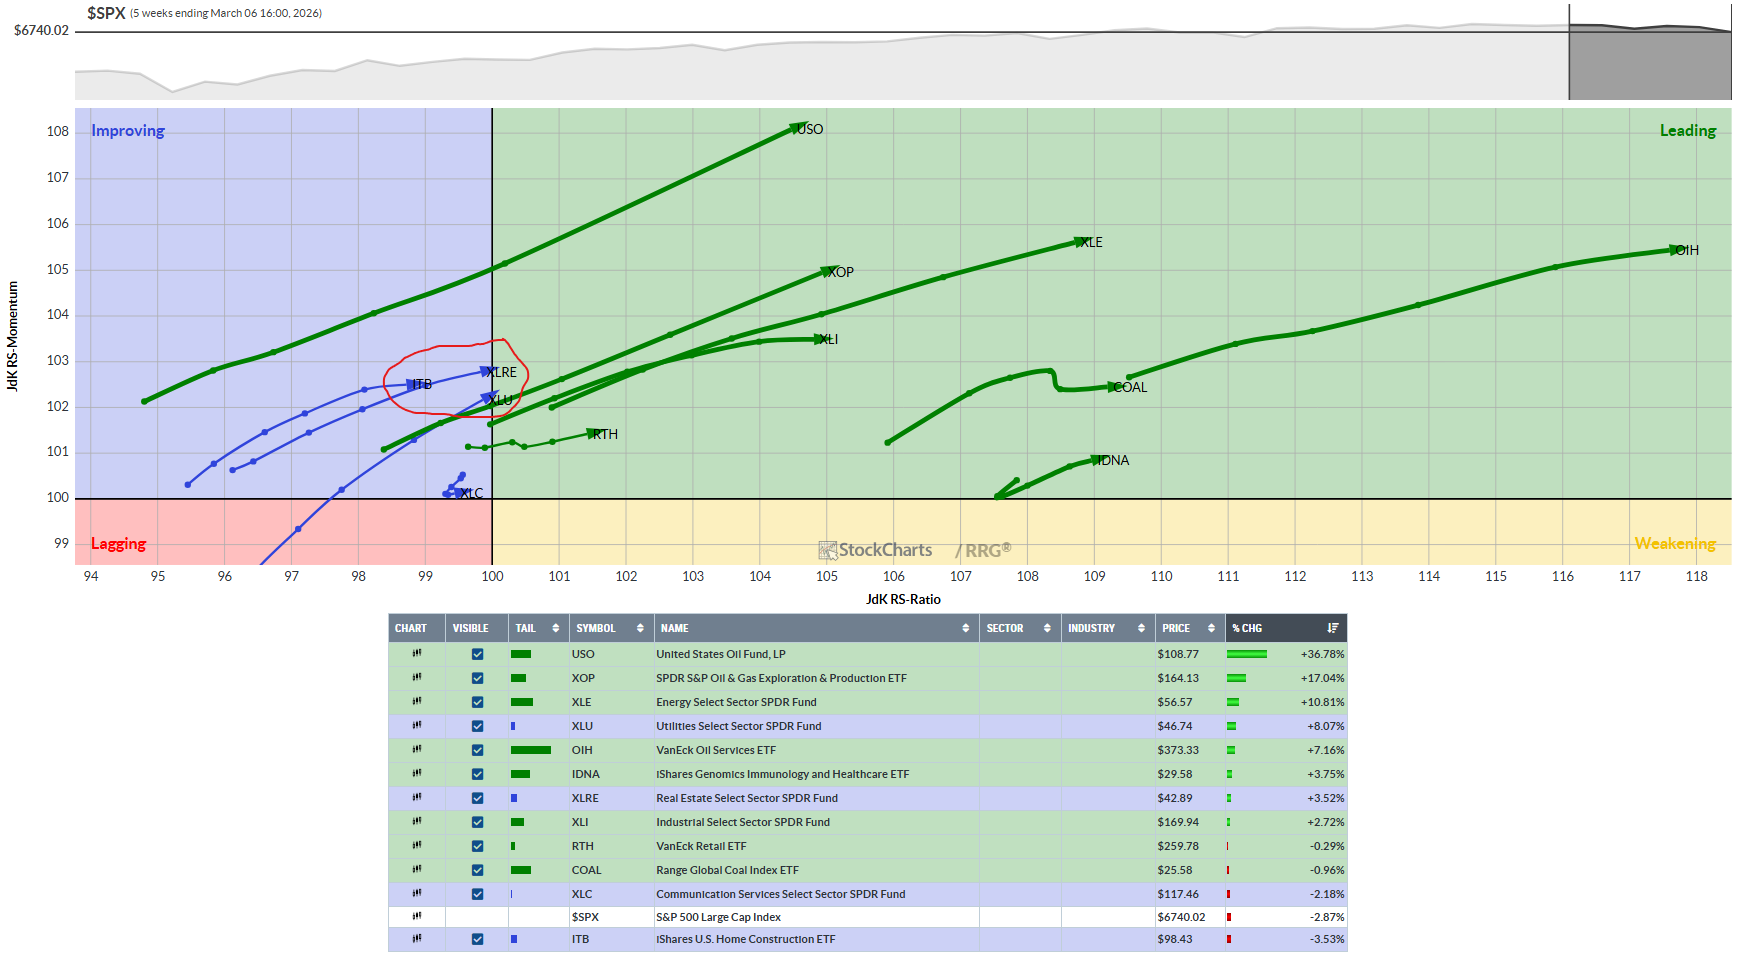
Bullish Relative Rotation Graph (RRG) ETFs of note
Bullish RRG etfs: USO, XOP, XLE, XLU, OIH, IDNA, XLRE, XLI, RTH, COAL, XLC, ITB
Thoughts this week: Hell yes! Nothing to do but maintain my discipline. My process works; I just have to let it work and stay out of the way. We caught the major indexes and passed them this week… Can’t wait for Monday. I’m back baby! I started my swing watch list again now that I am green YTD. You can check them out below on my Phat Pullbacks for March 9th.
You can do it, Keep Studying!
Most others don’t post their YTD because they can’t or frankly, they are lying. You better make sure, or you might lose it all…
Stock Talk Insiders discord
If you like this Phat Swing Plan, and you would like to receive alerts for my trades, click this link for the discord Stock Talk Insiders discord and enter the promo code: PHAT to get 10% off all packages for life...

Follow my alerts on Stock Talk Insiders discord Enter code: PHAT for 10% off
Follow my Phatstack for my Phat Swing Plan and updates during the week.
Follow me on X Phatinfantry Trading @Phatinfantry where I post/talk crap when I drink wine and make fun of dumb things.
Follow me on YouTube where I go through my process and review charts Phatinfantry