
Phat Swing Plans and Observations
For the week of 3/15/26

This is not a rookie traders’ market. VIX is elevated still. You will get roasted more than you find success. This is not an experienced traders market either. We are below the 50 day across major indexes. Midstreams and related however, look really good and the setups are growing.
Market Summary for the week
U.S. equities head into Mar 16–20 at year‑to‑date lows, with all three major indexes down for a third straight week as the Iran war, surging oil, and higher‑for‑longer fears collide with an FOMC decision and Nvidia’s GTC conference.
Big picture and indices
For the week ended Mar 13, the S&P 500 fell about 1.6%, the Nasdaq about 1.3%, and the Dow about 2.0%, marking a third consecutive weekly loss and pushing all three to new 2026 lows.
Short‑term momentum is negative and the index is below prior support (around 6,780), but sentiment is in extreme fear and some breadth/technical indicators are approaching oversold levels where a bounce wouldn’t be surprising if catalysts cooperate.
Index snapshot (last week)
S&P 500: -1.6% | Below key support, third weekly loss; downside momentum but oversold signals building.
Nasdaq: -1.3% | Hit by ongoing tech/AI volatility but holding slightly better than the Dow.
Dow: -2.0% | Hurt by financials, cyclicals, and oil‑sensitive names; leading the downside.
Sector and style rotation
Last week, only 2 of 11 S&P sectors rose: energy (about +2%) and utilities (about +0.5%), while financials were the weakest at roughly -3.3%.
Year‑to‑date, energy remains the clear leader (around +29%), while financials are down more than 10%, and breadth is weak (only about 23% of S&P names up on the week, with more new 52‑week lows than highs).
This still favors long swings in energy/defensives on pullbacks and makes banks/financials more suitable for relative‑weakness trades or very selective buys.
Macro calendar: Fed and inflation
The macro focus this week is the Fed’s March meeting and updated projections, against a backdrop of sticky inflation, weaker jobs, and an oil‑driven inflation scare.
Markets expect the Fed to hold the funds rate around 3.75% and to stress “data‑dependence,” with cuts later in 2026 still possible but less certain if energy keeps inflation elevated.
Key U.S. items (ET; Fed timing in local central‑bank notation converted roughly to U.S. market hours):
Wednesday Mar 18:
8:00–8:30 a.m – Producer Price Index (Feb).
2:00 p.m – FOMC rate decision and updated economic projections.
2:30 p.m – Powell press conference.
Other U.S. data around the edges (jobs, housing, etc.) matter, but the Fed and PPI are the main volatility windows this week.
Earnings and Nvidia GTC
Earnings volume is lower, but this week’s key reports—Micron (MU), Jabil (JBL), and General Mills (GIS)—plus Nvidia’s GTC AI conference can still move important pockets of the market.
Nvidia’s GTC (Mar 16–19) is the centerpiece for AI sentiment; Wall Street is looking for new product and AI‑inference road‑map details, and some bulls think it could help offset macro and oil‑related fears if the event is strong.
Earnings/calendar
Wednesday, Mar 18 – Earnings: MU, JBL, GIS
Trading implications for the week
Tape: We’re in a down‑trend within an oversold zone—third red week, YTD lows, VIX in the high‑20s; bounces are possible but not yet trustworthy unless SPX can reclaim prior support levels (e.g., back above 6,780) on strong breadth.
Leadership: Energy and utilities are the steady winners; financials and some cyclicals are the clear laggards; tech/AI is a wild card around GTC and the Fed, suitable for shorter‑term, catalyst‑driven swings more than core exposure.
Event risk: Plan around Wednesday’s 2:00–3:30 p.m Fed window and the AI flow around Nvidia’s GTC; consider trimming or hedging high‑beta and levered positions into those events, then using the reaction in yields, the dollar, and semis to decide whether to lean into an oversold bounce or stay defensive in energy and utilities.
Deepvue Market Themes
Swing trading implications
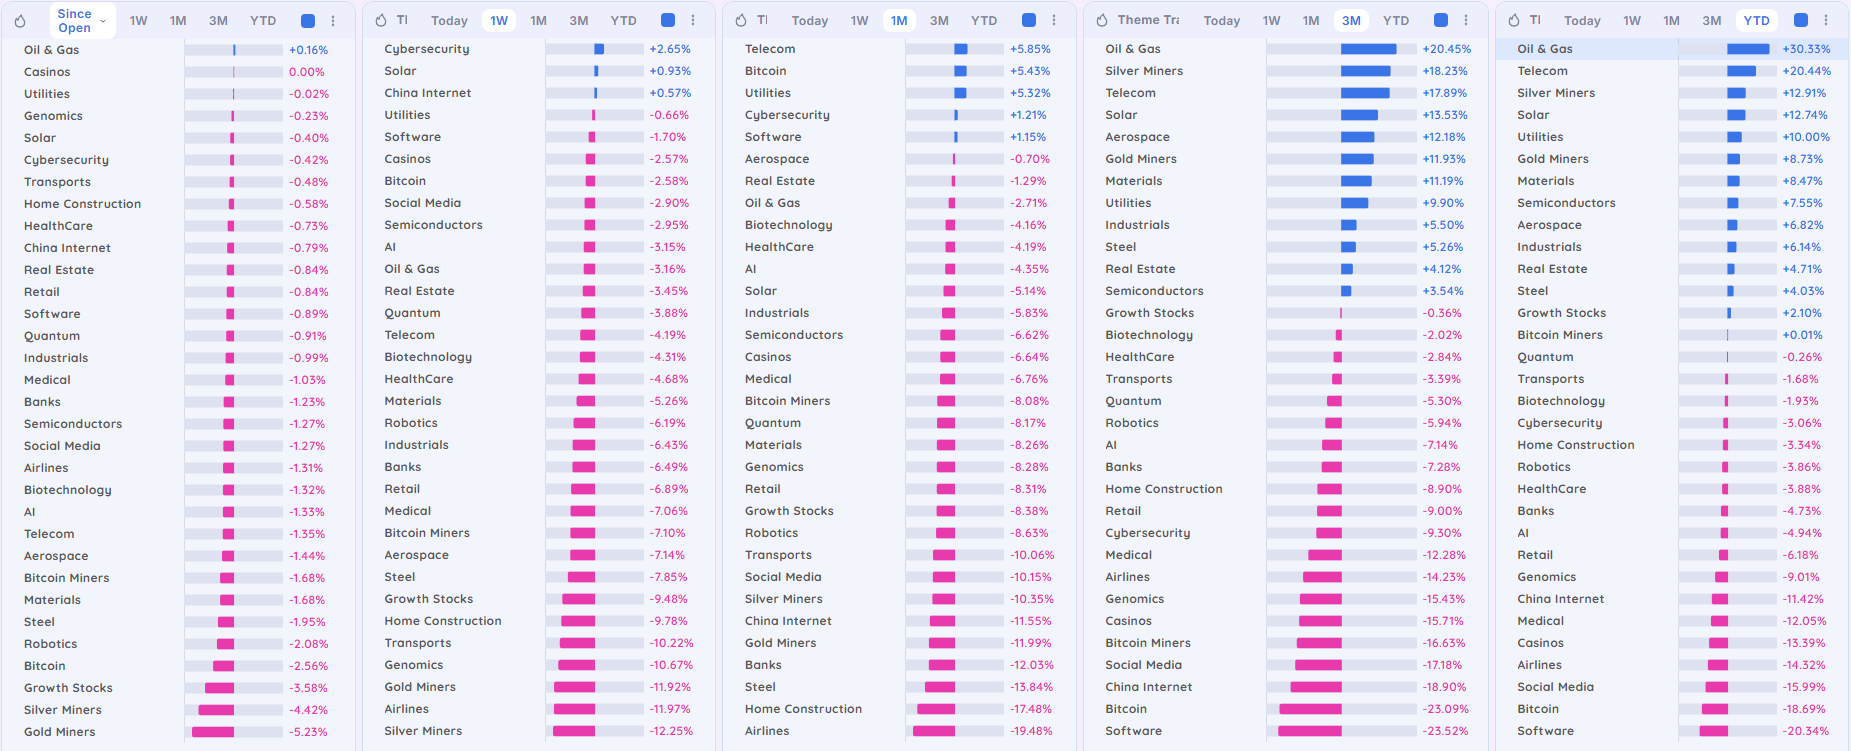
The dashboards show strong, persistent relative strength in Oil & Gas, with Telecom and precious metals (Silver/Gold Miners) emerging on the 3‑month and YTD views, while classic growth/tech themes like Software, Bitcoin, and Social Media are weak across most timeframes.
TradersLab.io Themes
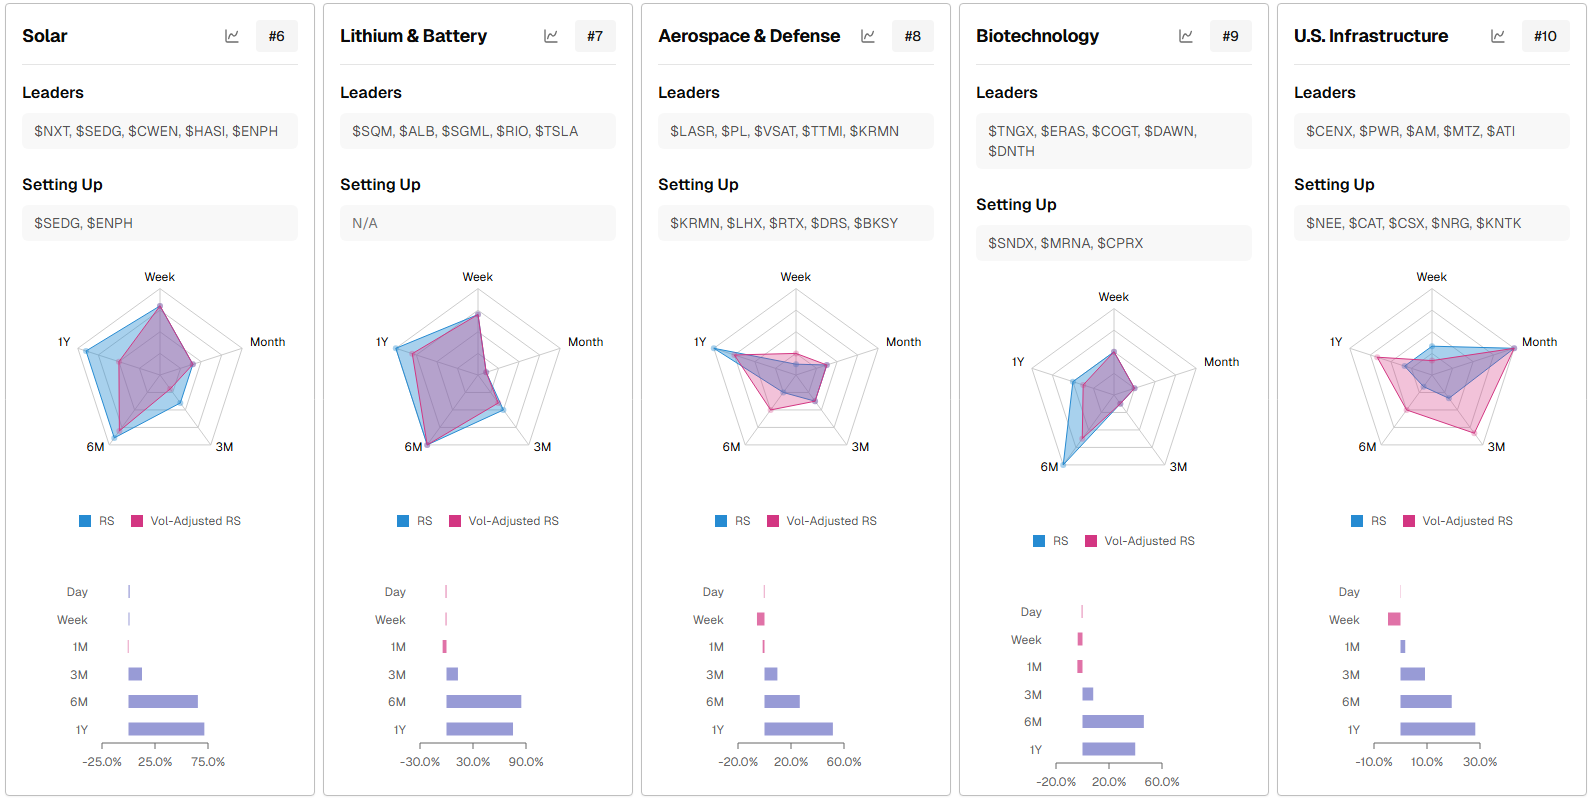
Rotation and “setting up” lists
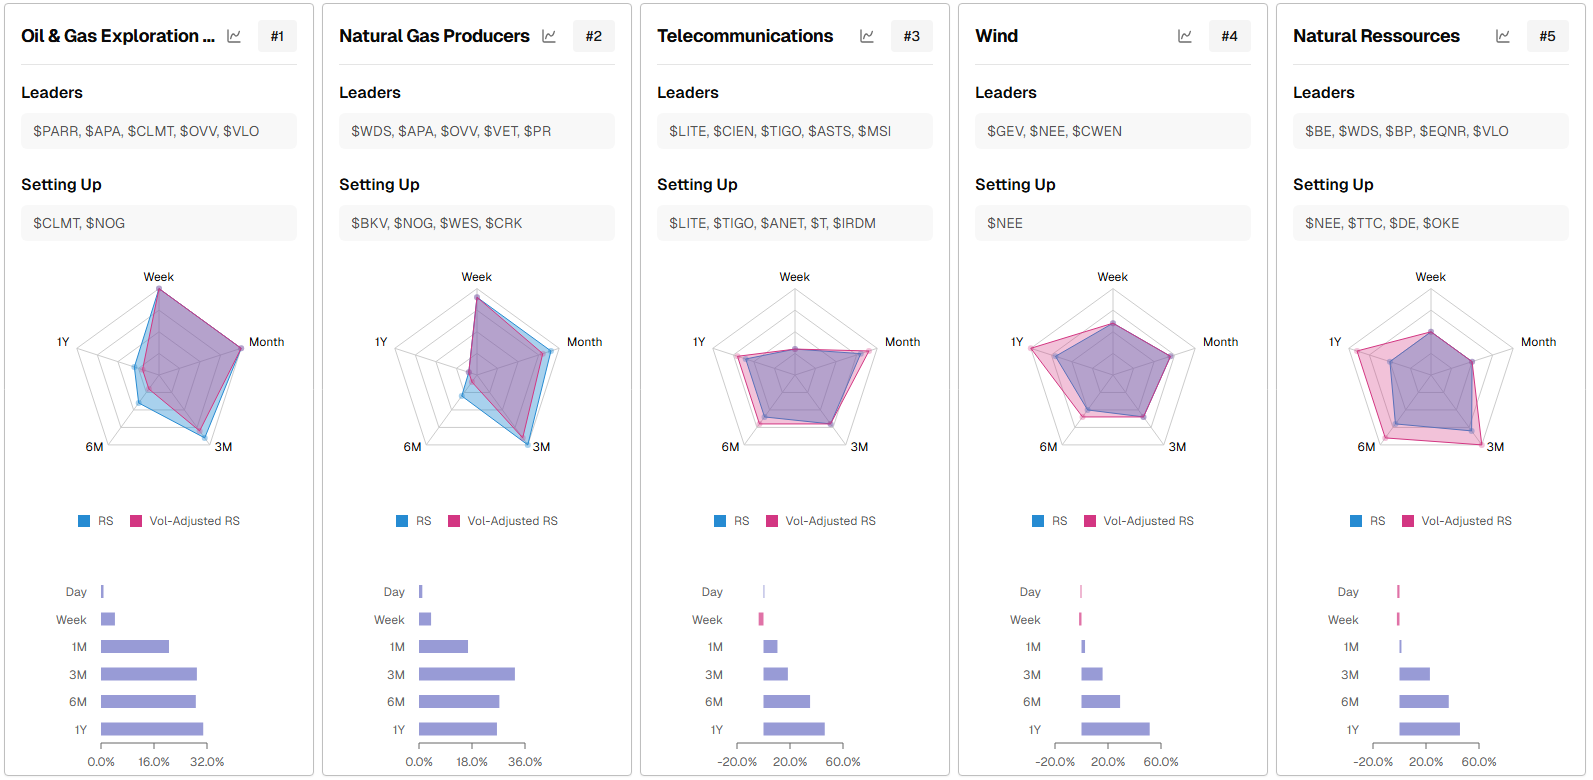
Immediate‑action zones: “Setting Up” names in energy and infra (CLMT, NOG, BKY, WES, CRK, NEE, CSX, NRG, KNTK) are where you likely get low‑risk entries in the current leaders; they sit inside sectors already trending on the 3M–1Y horizon.
Early‑stage or pullback candidates: Solar’s setting‑up names (SEDG, ENPH) and Aerospace & Defense (KRMN, LHX, RTX, DRS, BKSY) look like pullbacks within still‑positive longer‑term RS. Some repair may be needed here before ready.
Core trend sleeve: Overweight energy complex plus Natural Resources and Telecom/Infrastructure; focus on liquid leaders from the “Leaders” lists and add from “Setting Up” as they trigger.
Run rate vs this week’s price change for cap-weighted S&P 500 sector ETFs and equal‑weight sector proxies RSP
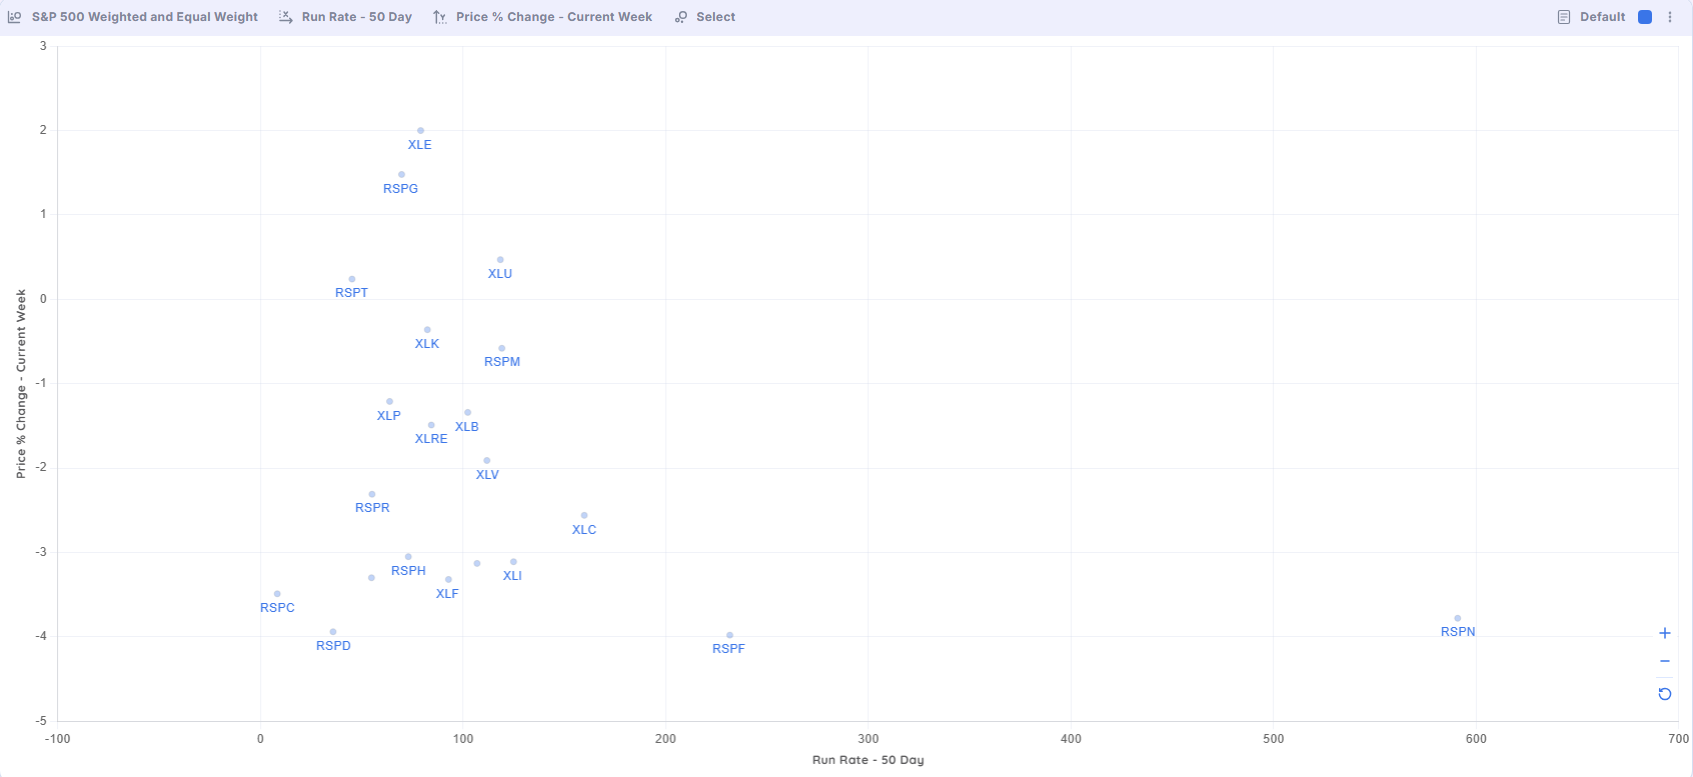
Swing-trader read
Short‑term leaders: XLE, RSPG as trend or breakout‑pullback candidates if they hold above last week’s lows.
High‑activity pullback: RSPN (Industrials) as a prime candidate for mean‑reversion or trend‑continuation entries once you see stabilization (e.g., reclaiming a short‑term moving average, strong reversal candle, or positive breadth within its constituents).
For newer Traders: What the axes are saying is below about the X/Y axis…
X‑axis (Run Rate – 50 Day) shows recent volume/participation versus the 50‑day baseline; farther right means more active than usual.
Y‑axis (Price % Change – Current Week) shows this week’s performance; higher is stronger, lower is weaker.
Market Carpet for the S&P 500 by Weekly Price Change
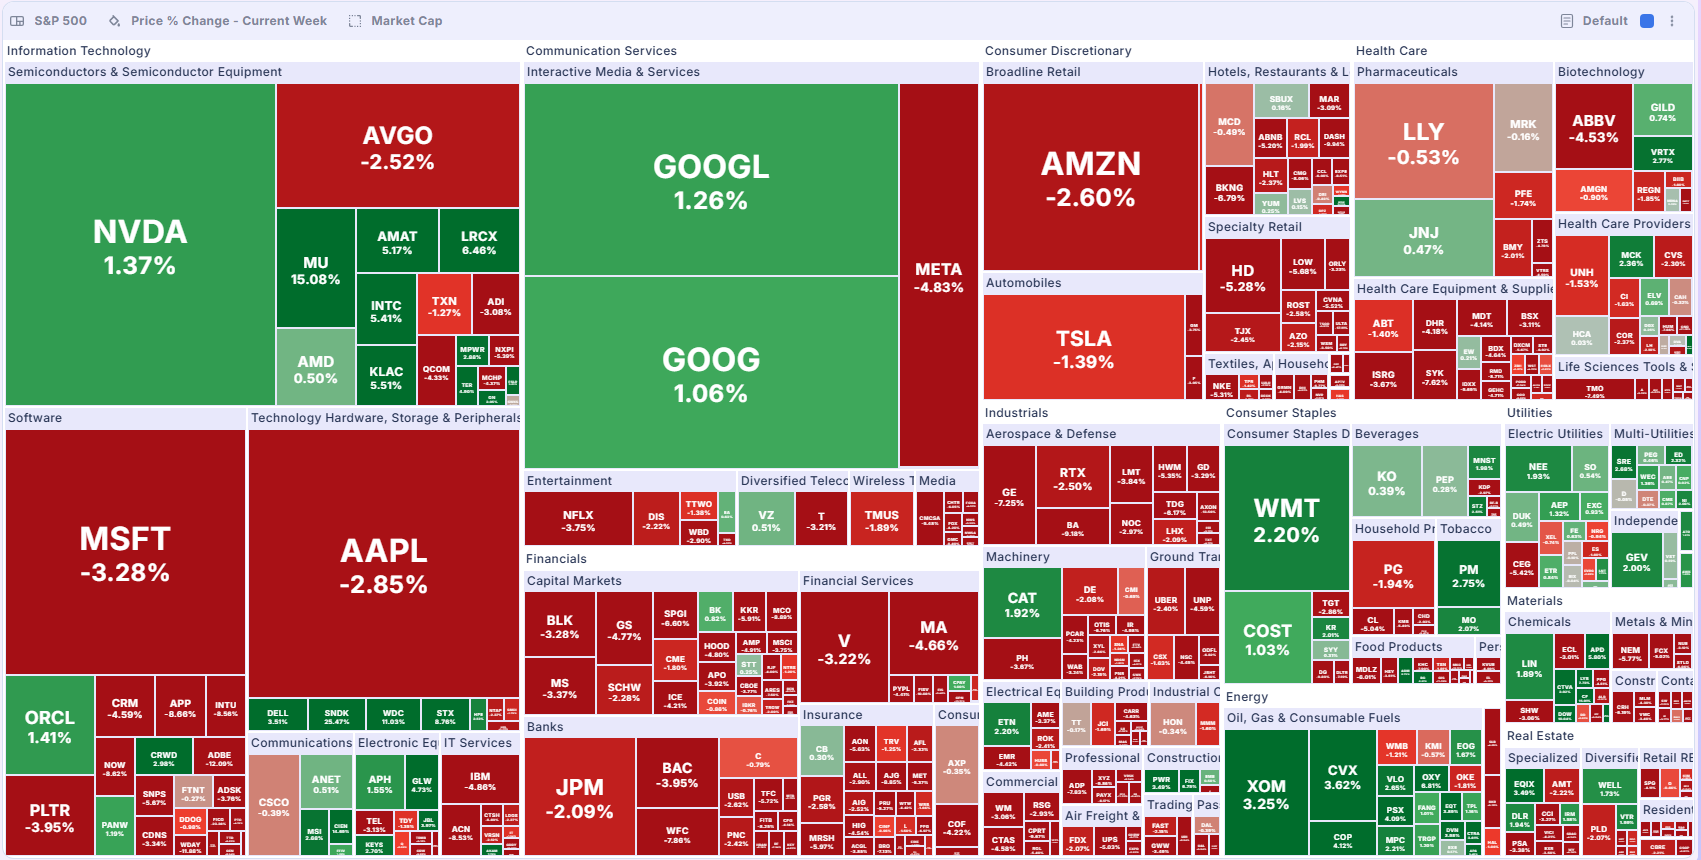
Swing-trading implications
Favor long ideas in strength pockets:
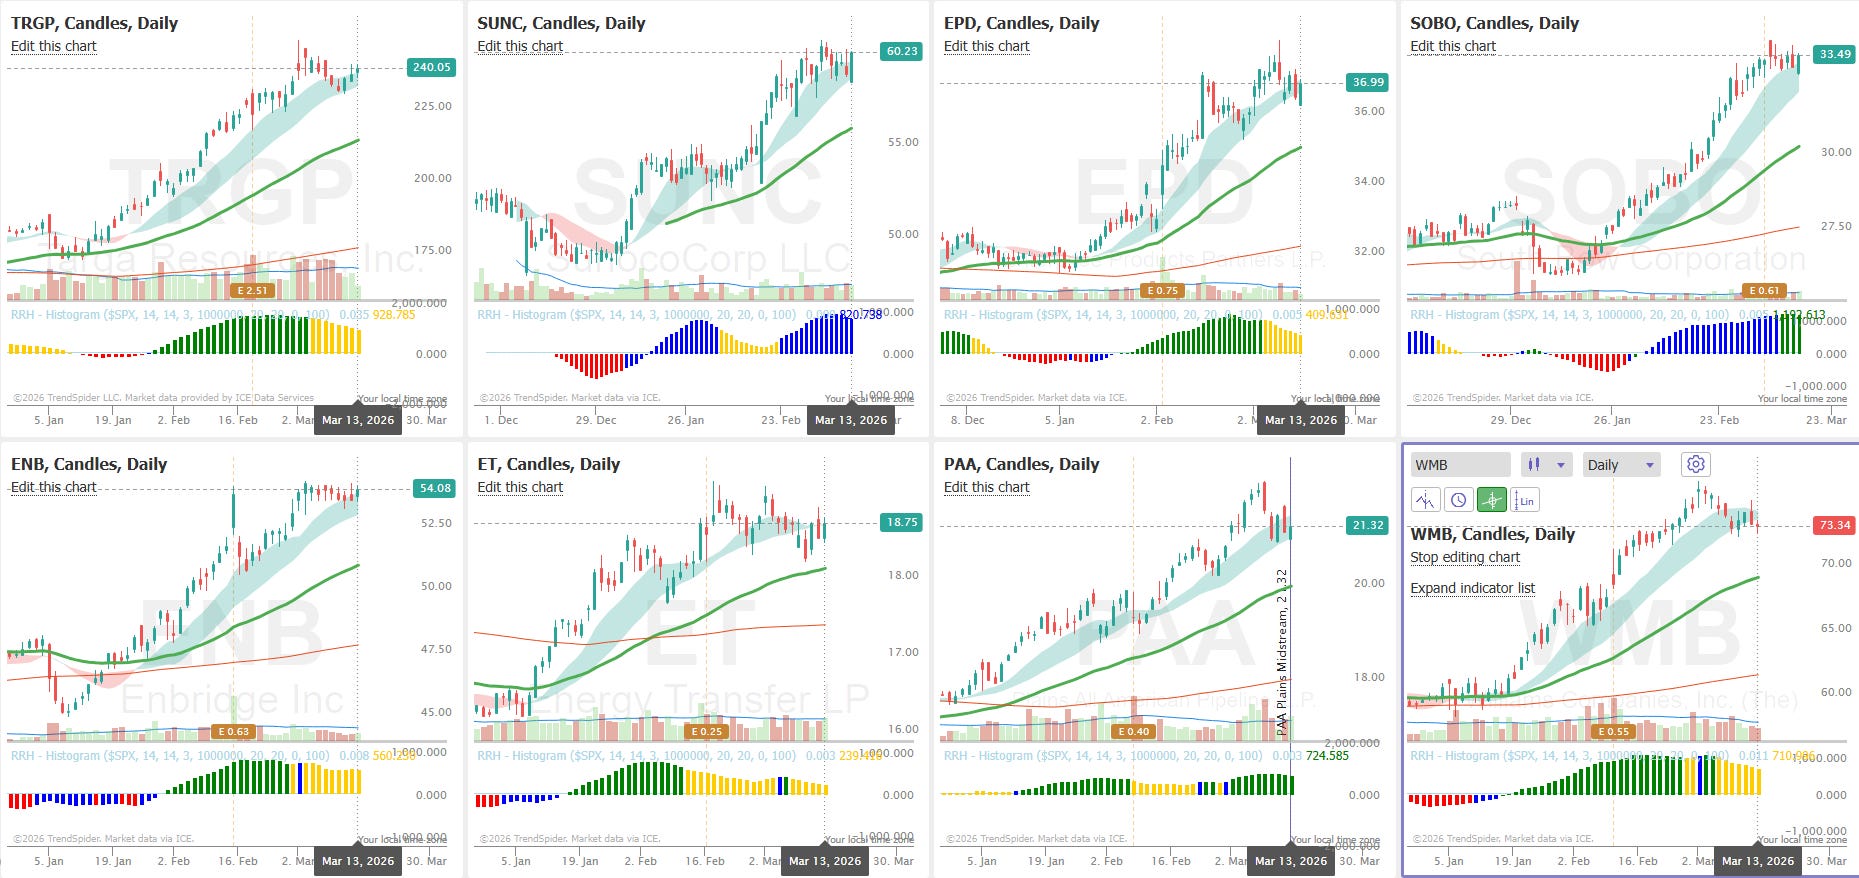
Energy (major oils, strong midstreams, oilfield services that are green this week).
Defensive staples/low beta retail (WMT, COST, select food/tobacco that are green).
Semis: split tape. NVDA/MU/strong green names can still be long candidates on pullbacks, but weaker red semis (TXN, ADI, equipment names that are underperforming) are better avoided or shorted on bounces rather than dip-bought.
Psych Charts of note
RSI for the SPX
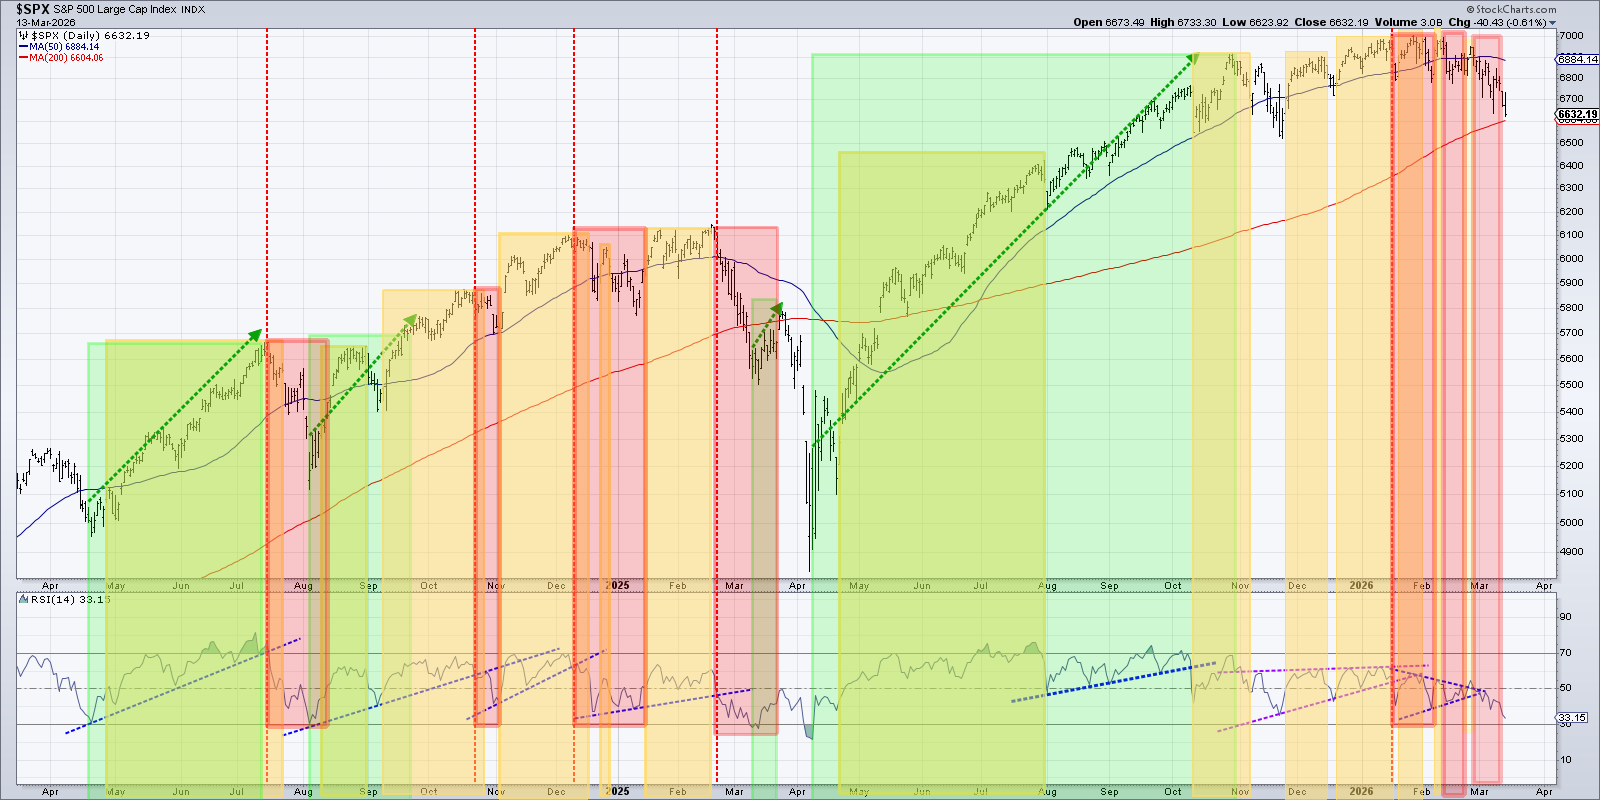
While everyone is watching for an oversold bounce area or follow through day, it looks like a simple way to watch for those potential moments is the RSI chart for SPX. Oversold 30 area is on watch… Patience as they say…
MMTW Stocks above 20 day average
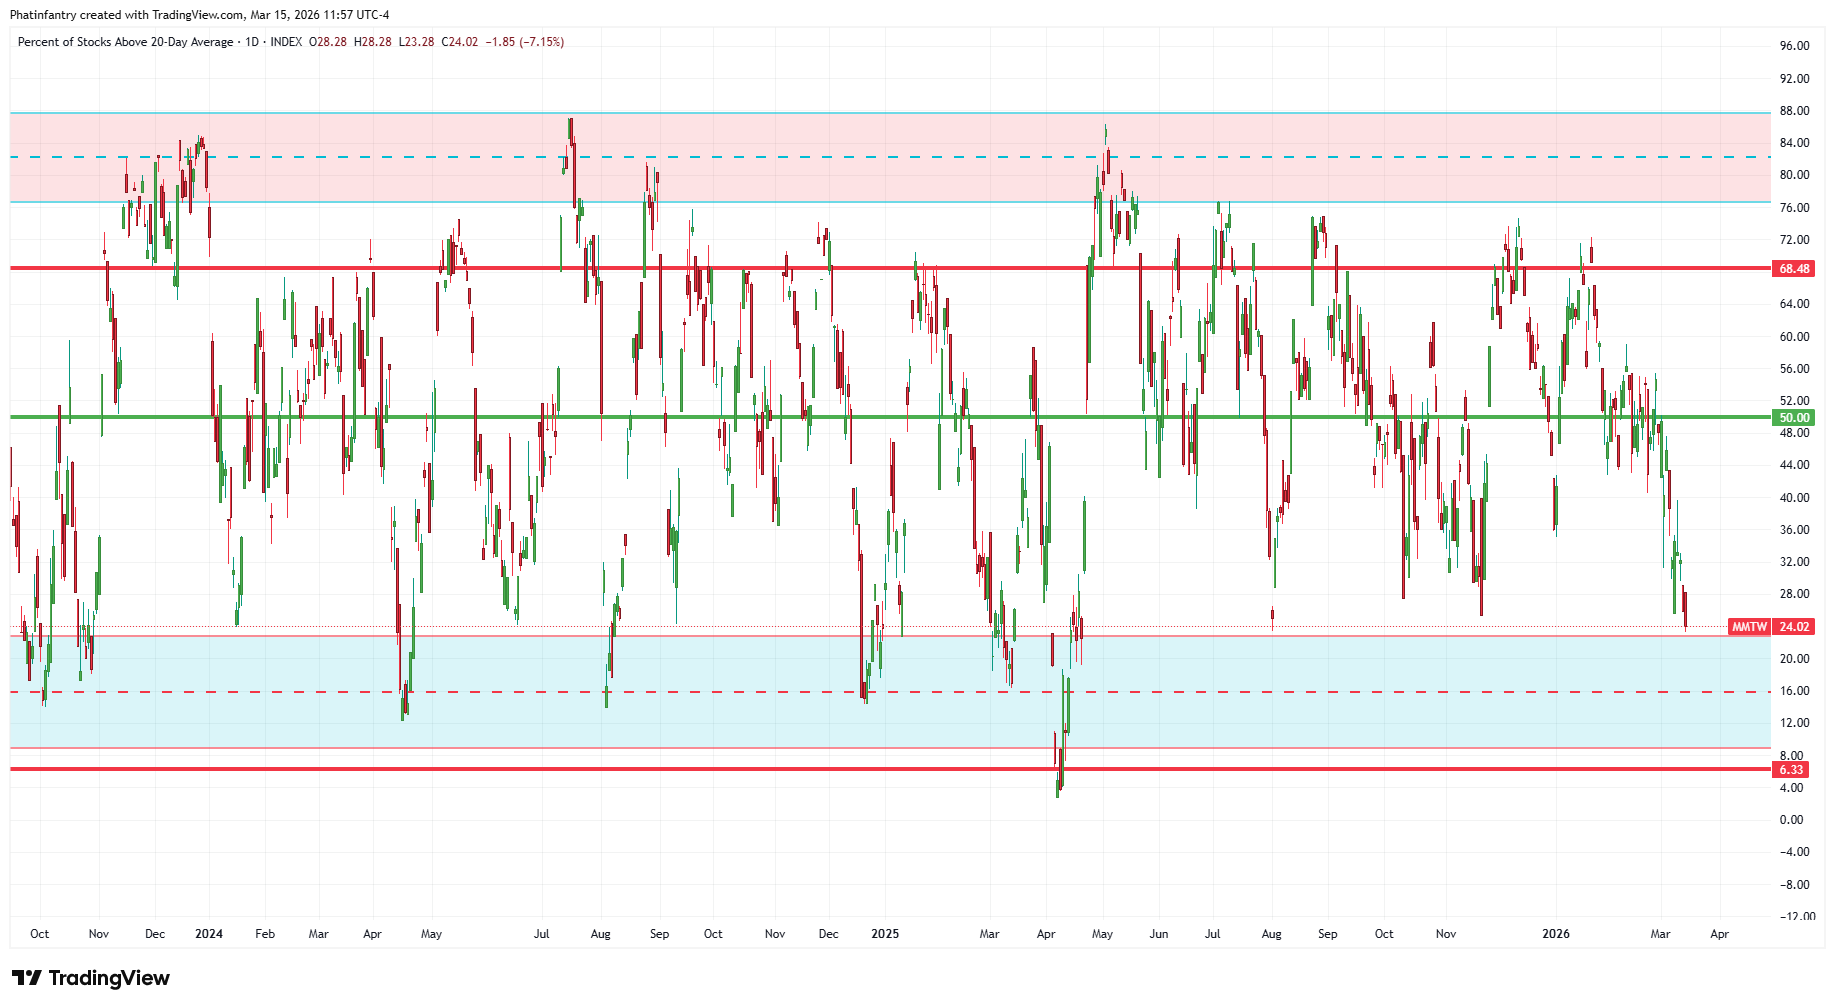
MMTW is getting close to the oversold blue area… On watch…
SPY
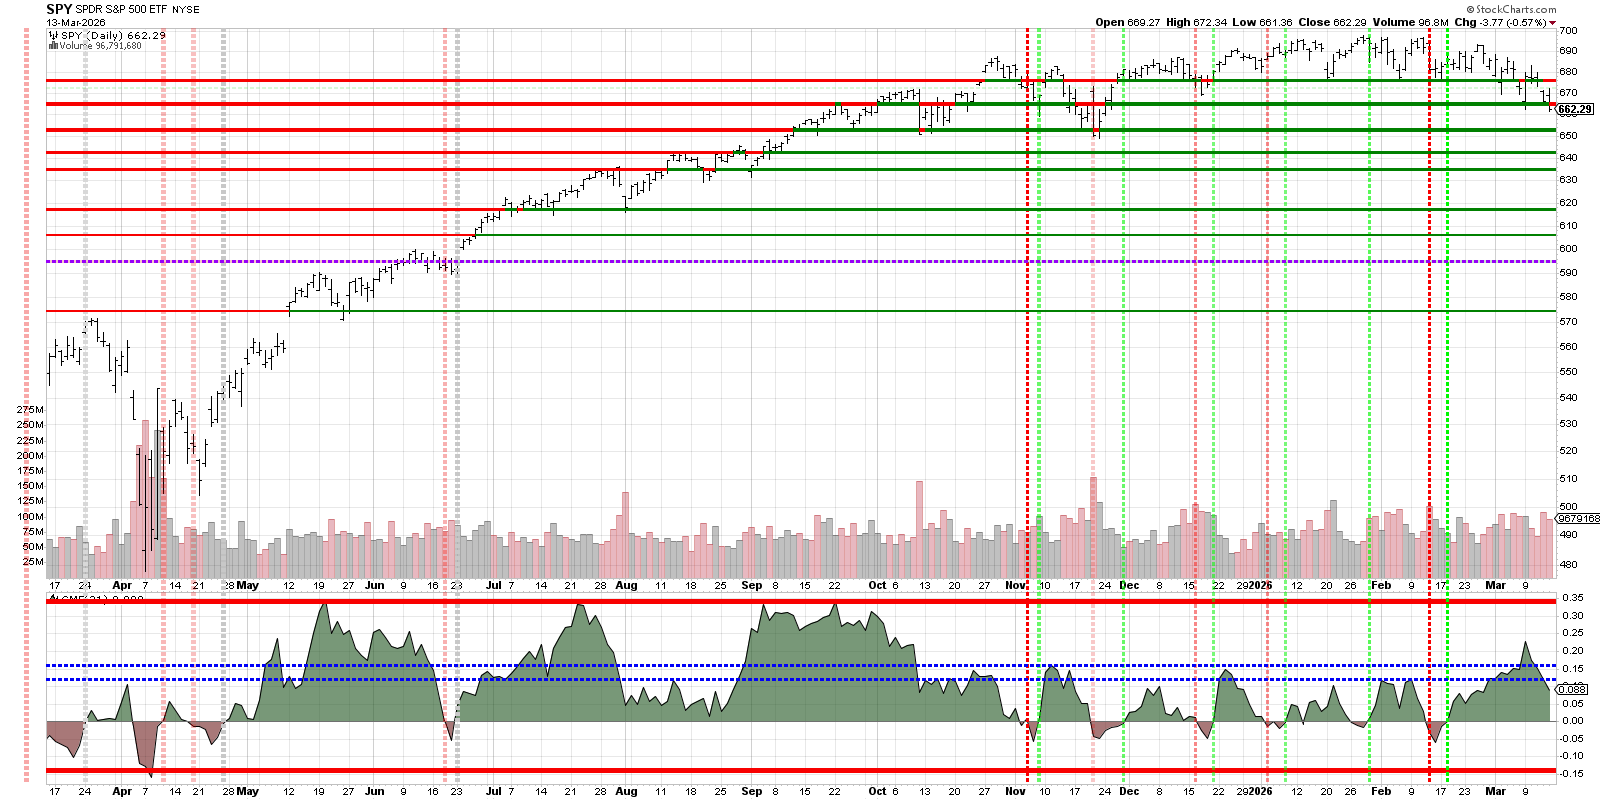
As noted last week with the comment “BANG YOUR HEAD”… SPY now has overhead… And it did…
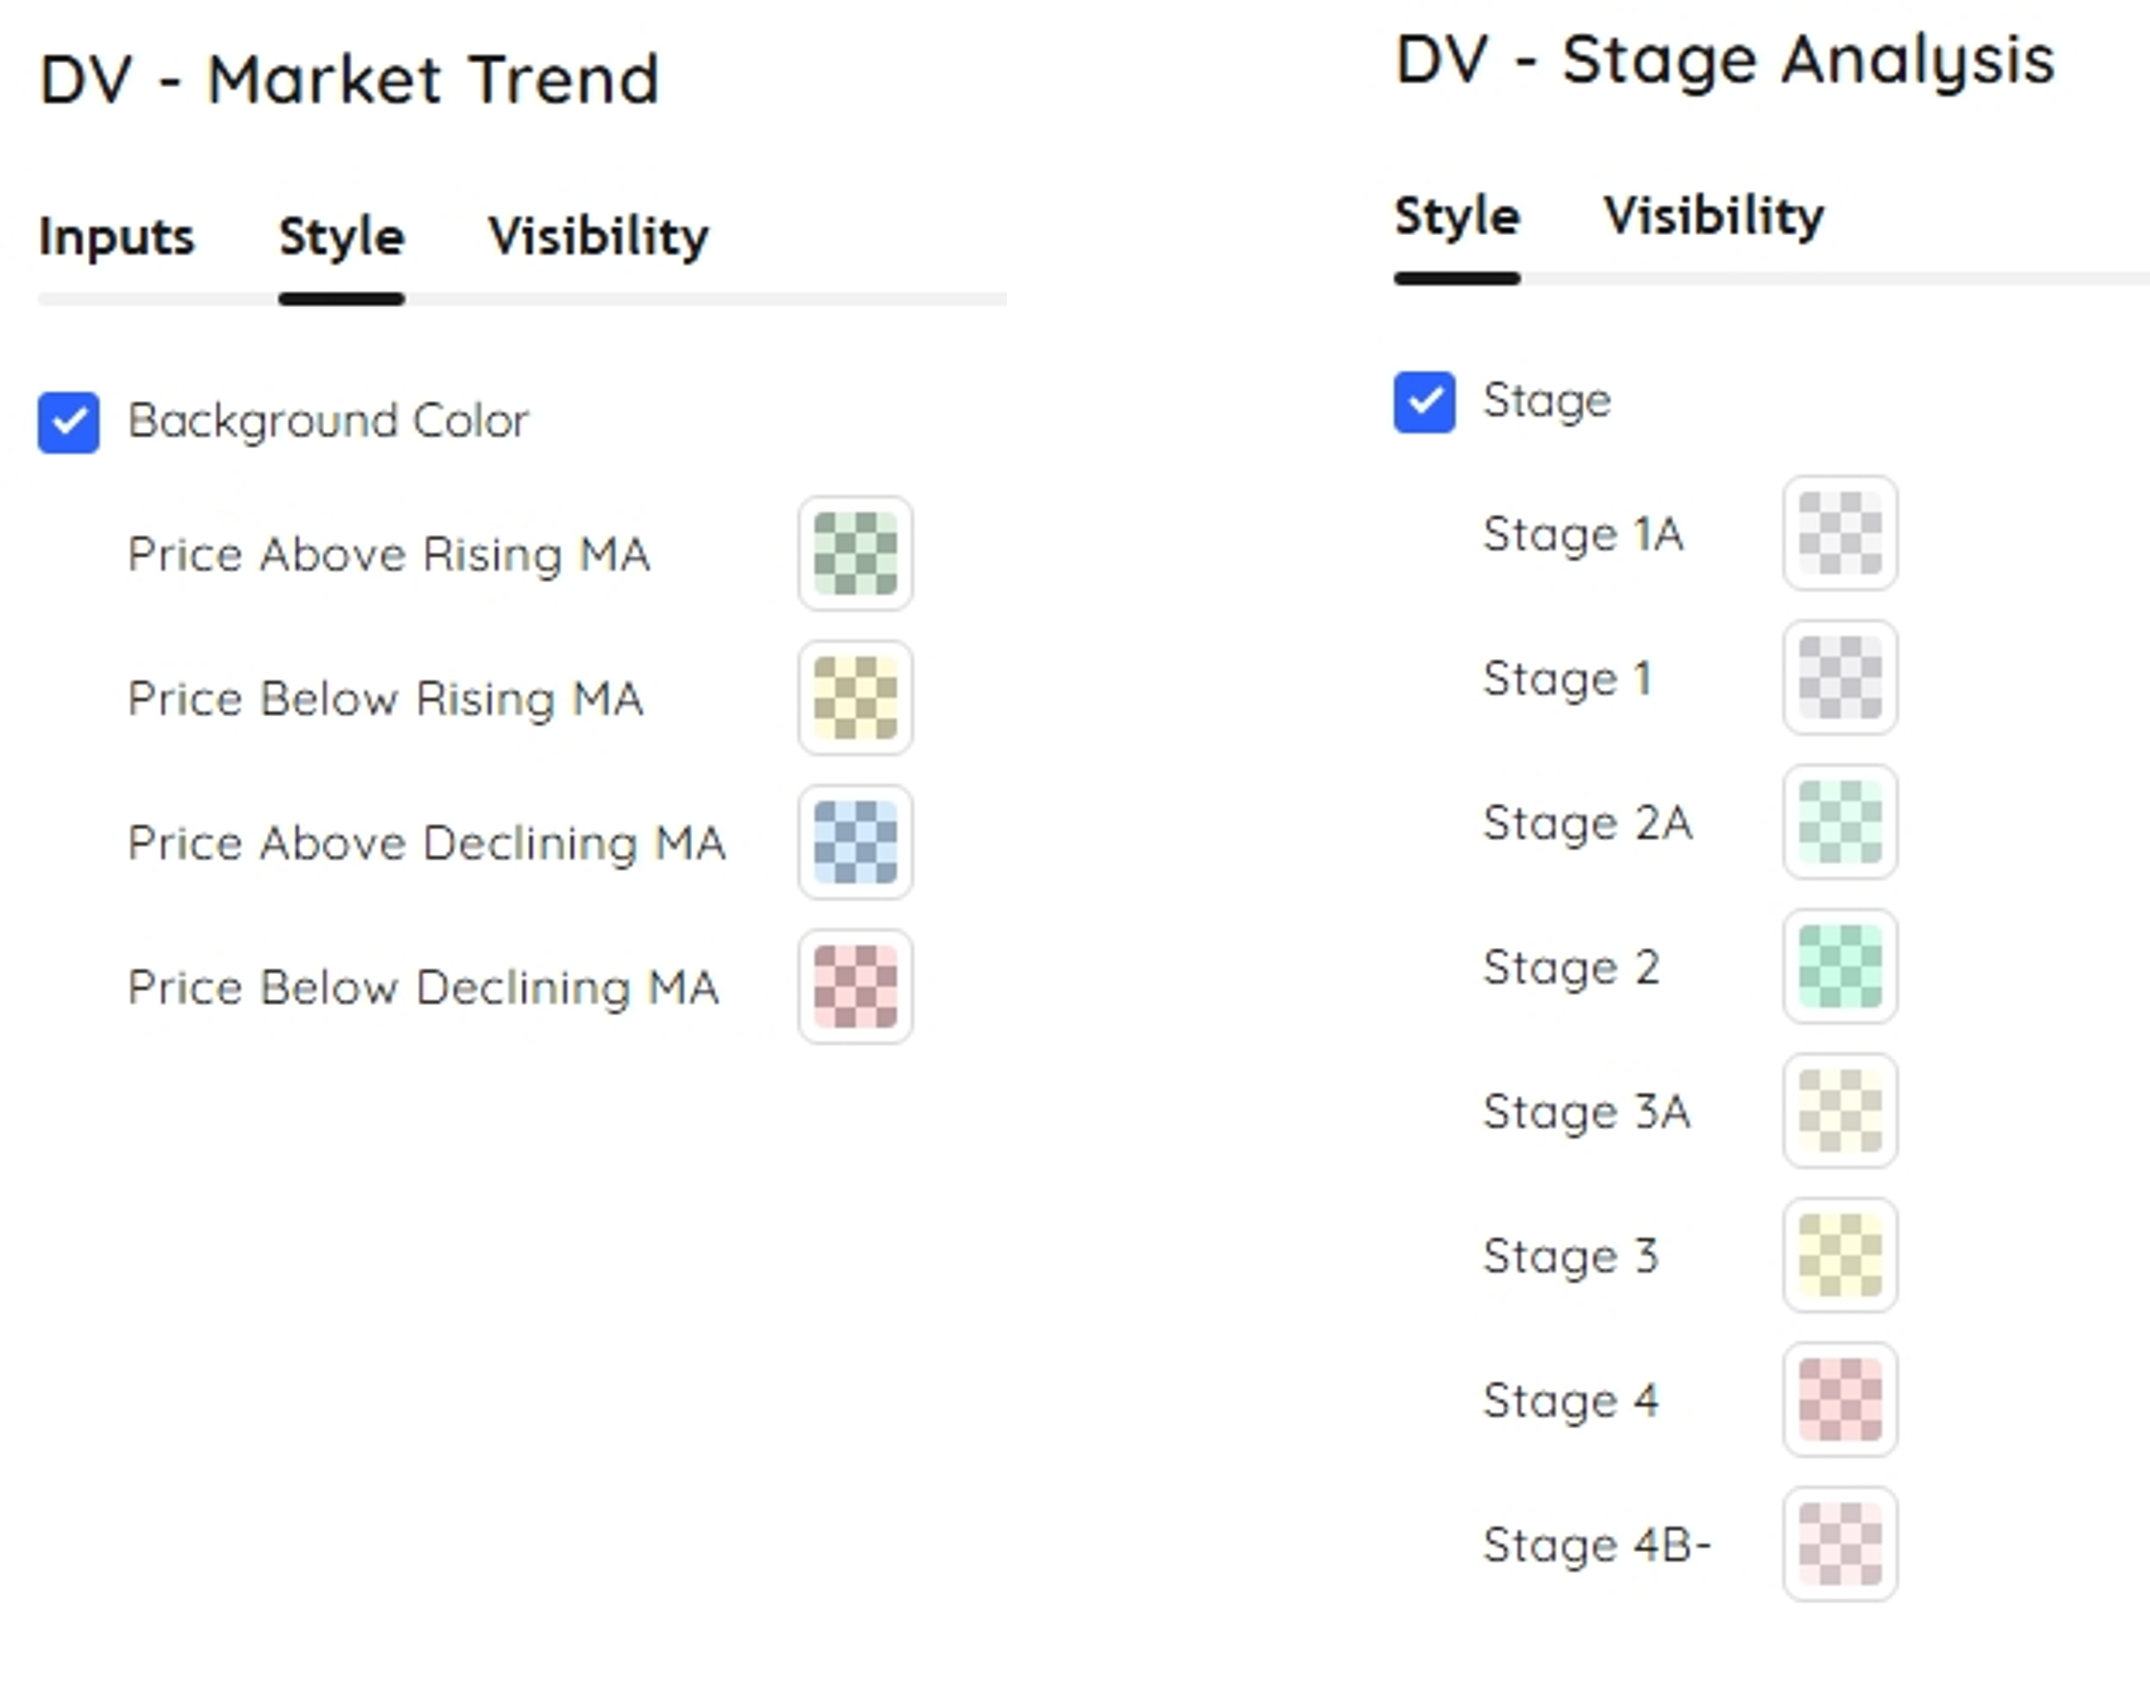
SPY Deepvue Market Trend
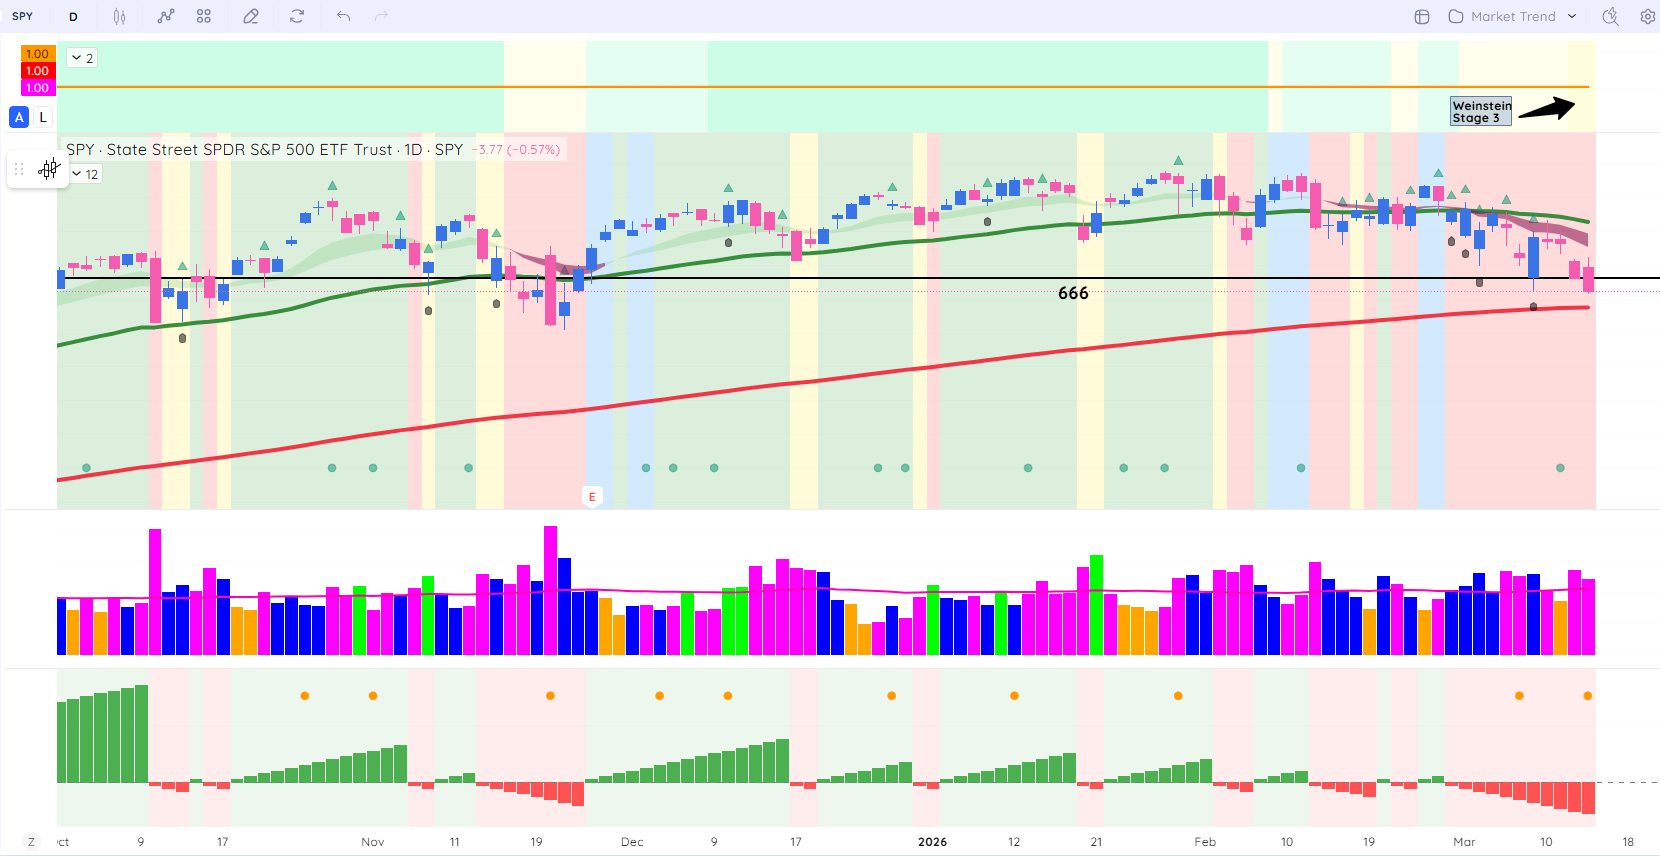
Red and leaning redder… And now we are in Sam Weinstein stage 3…
SPY chart with Deepvue market trend analysis
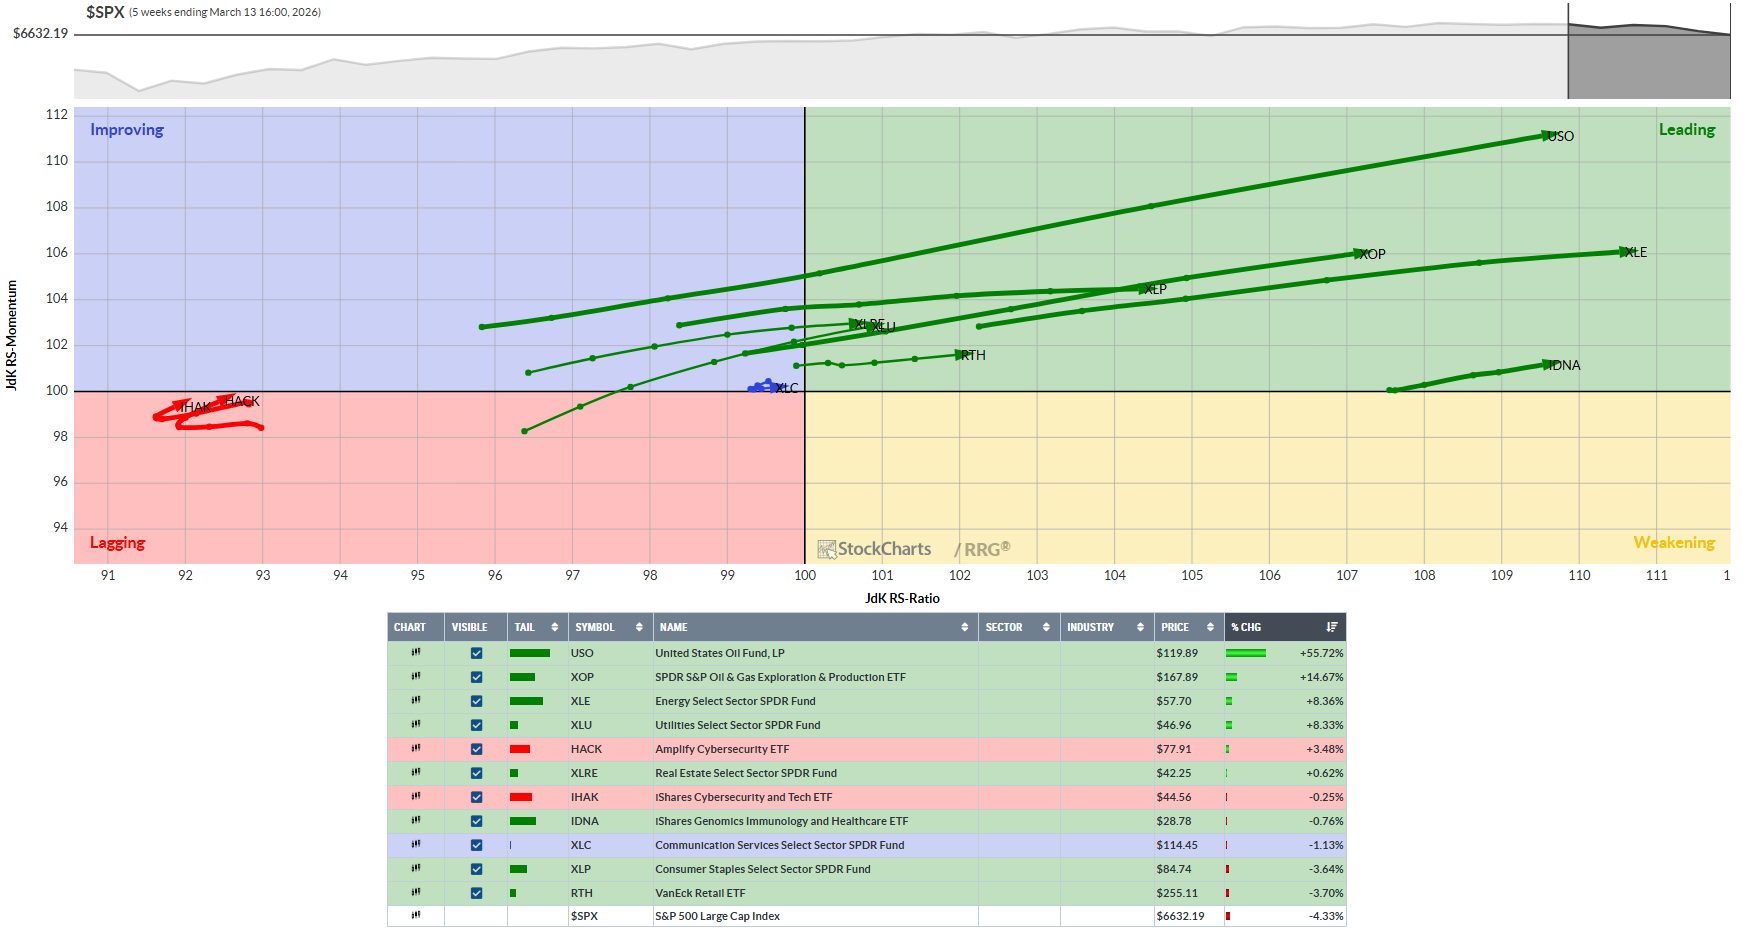
Weekly- Relative Rotation Graph (RRG)
This chart provides a relative strength and momentum snapshot for all S&P sector ETFs against the SPY over the 5-week period.
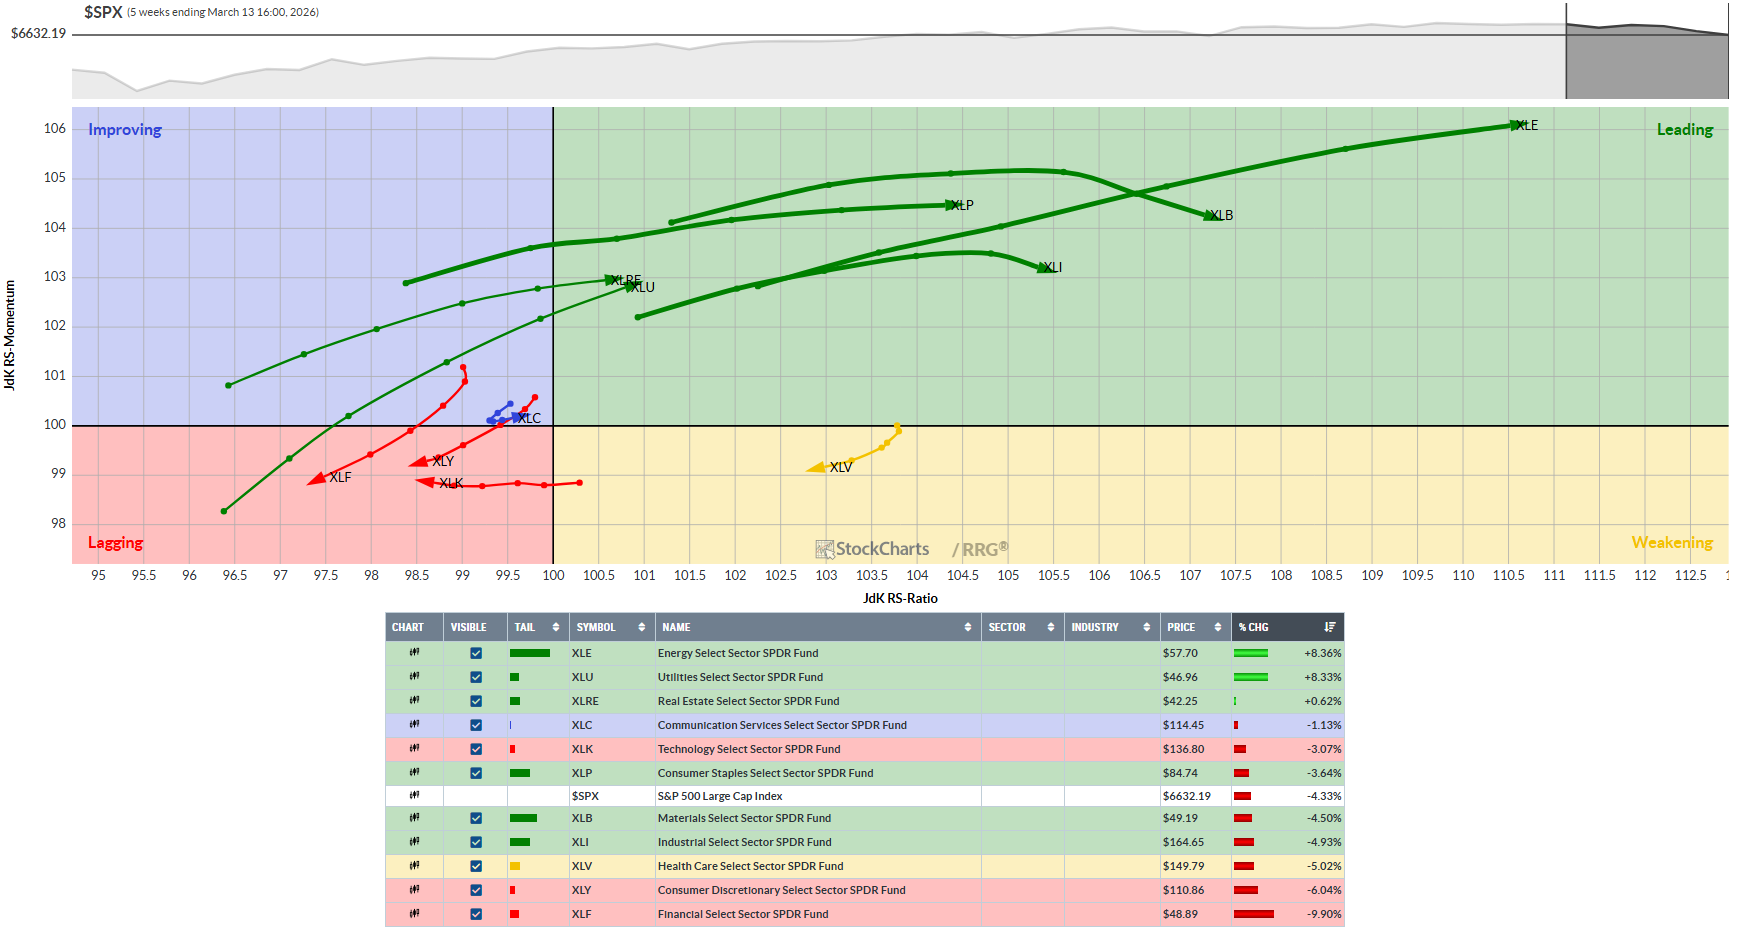
Swing Plan from This RRG
Bias new swing longs to: energy (XLE), utilities (XLU), real estate (XLRE), and select staples (XLP), focusing on liquid leaders showing volume‑confirmed breakouts or pullbacks to rising 20–50‑day MAs.
Before we look further at the S&P 500 sectors, let’s look at the offensive versus defensive chart below…
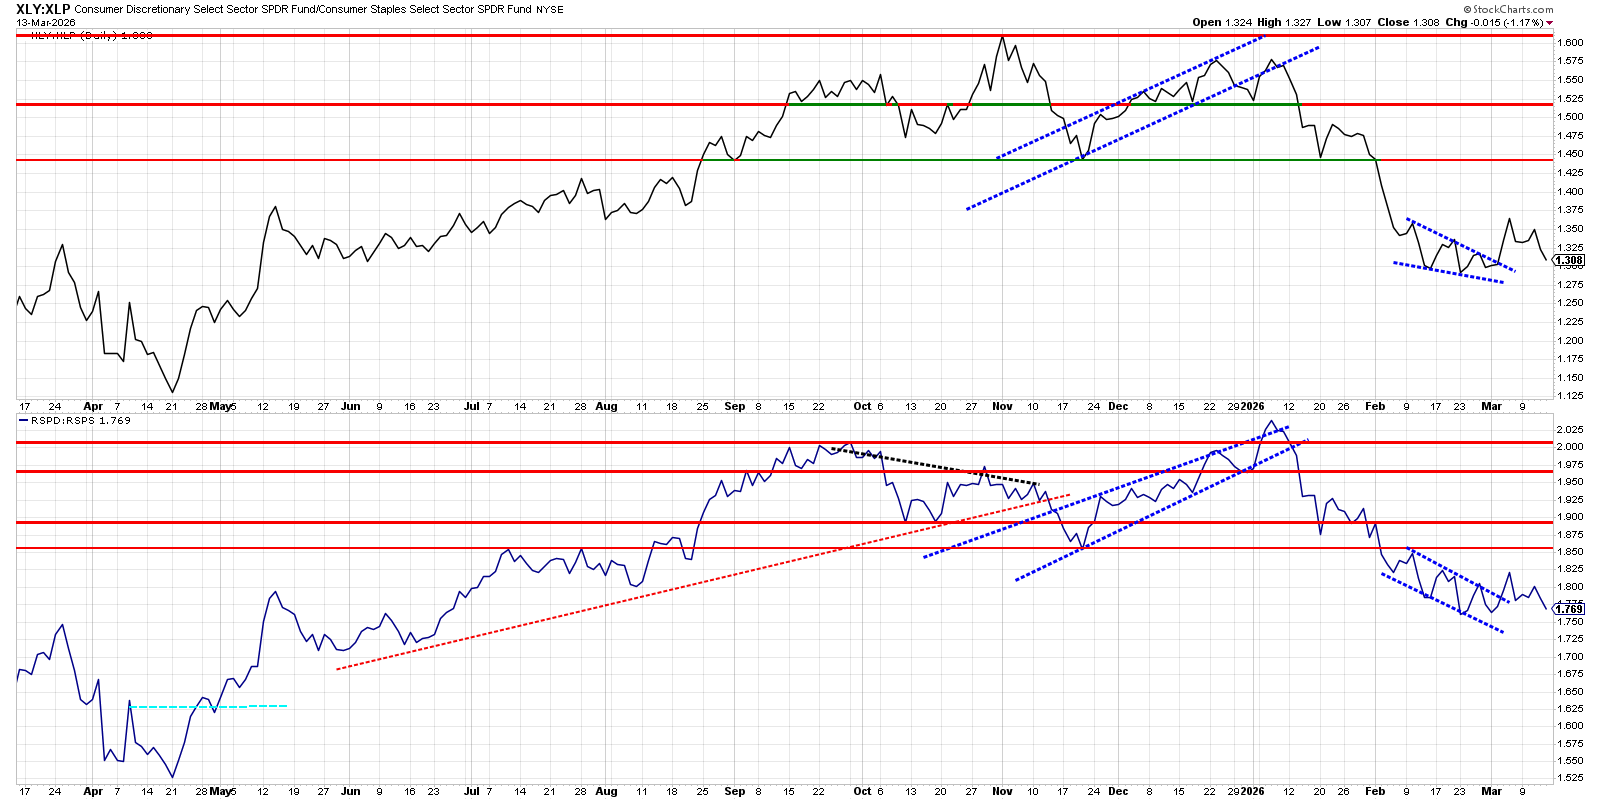
Trading implications
For swing bias, this setup favors defensive or Staples exposure over aggressive Consumer Discretionary as long as both ratios remain below their broken trendlines and flag resistance.
Growth versus Spy
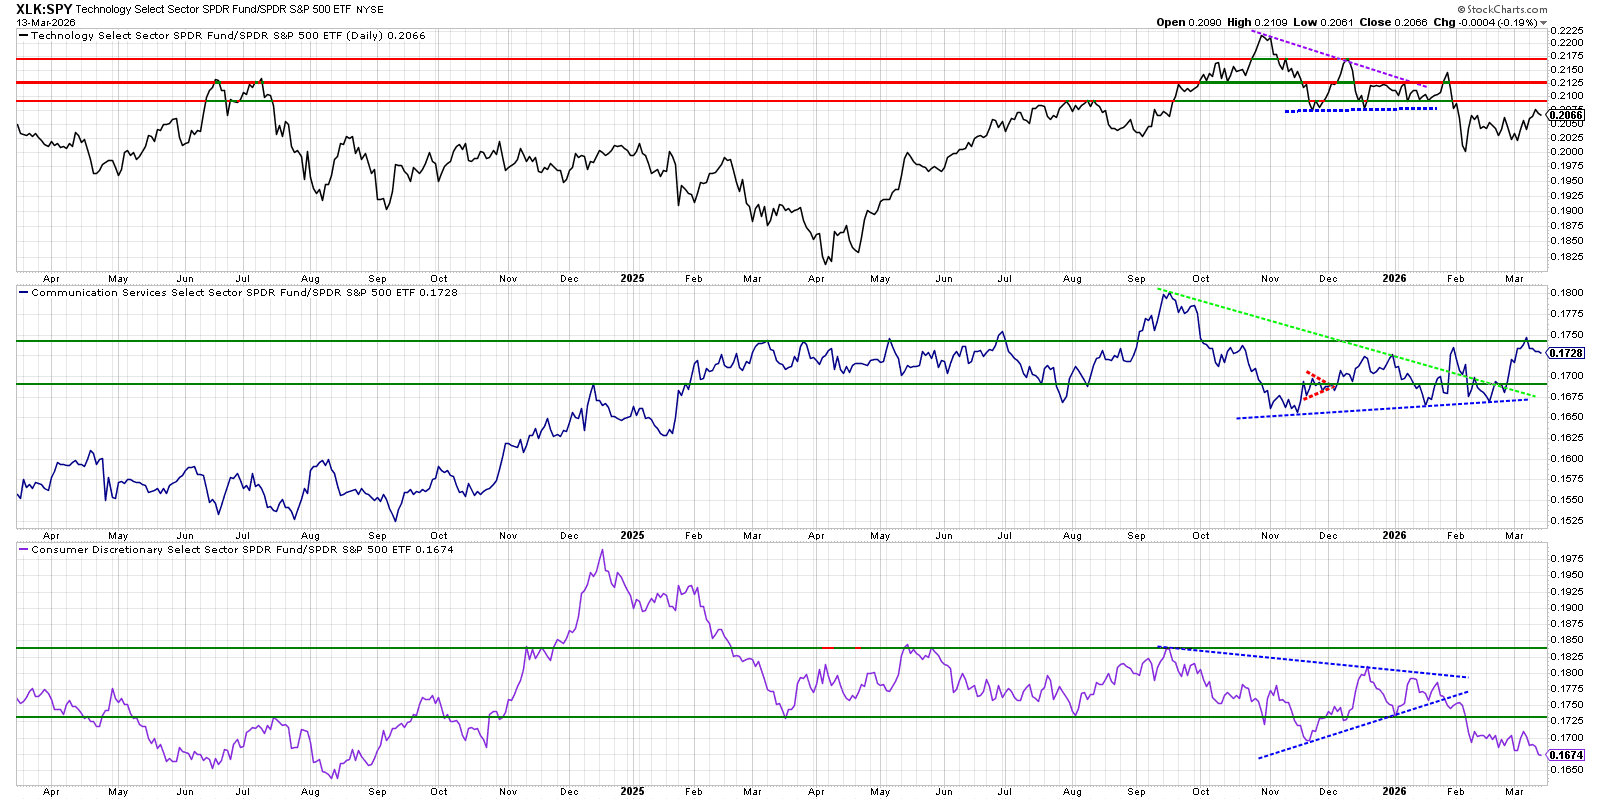
Takeaways for sector rotation
Prior cycle leaders (Tech and Discretionary) both show deterioration in relative strength, with XLK still neutral‑to‑soft and XLY outright weak.
Communication Services is the only one of the three showing improving RS characteristics right now (higher low, trendline break, testing resistance), so for swing entries within “growth” sectors, XLC looks like the cleaner RS bet until its new up‑trend fails.
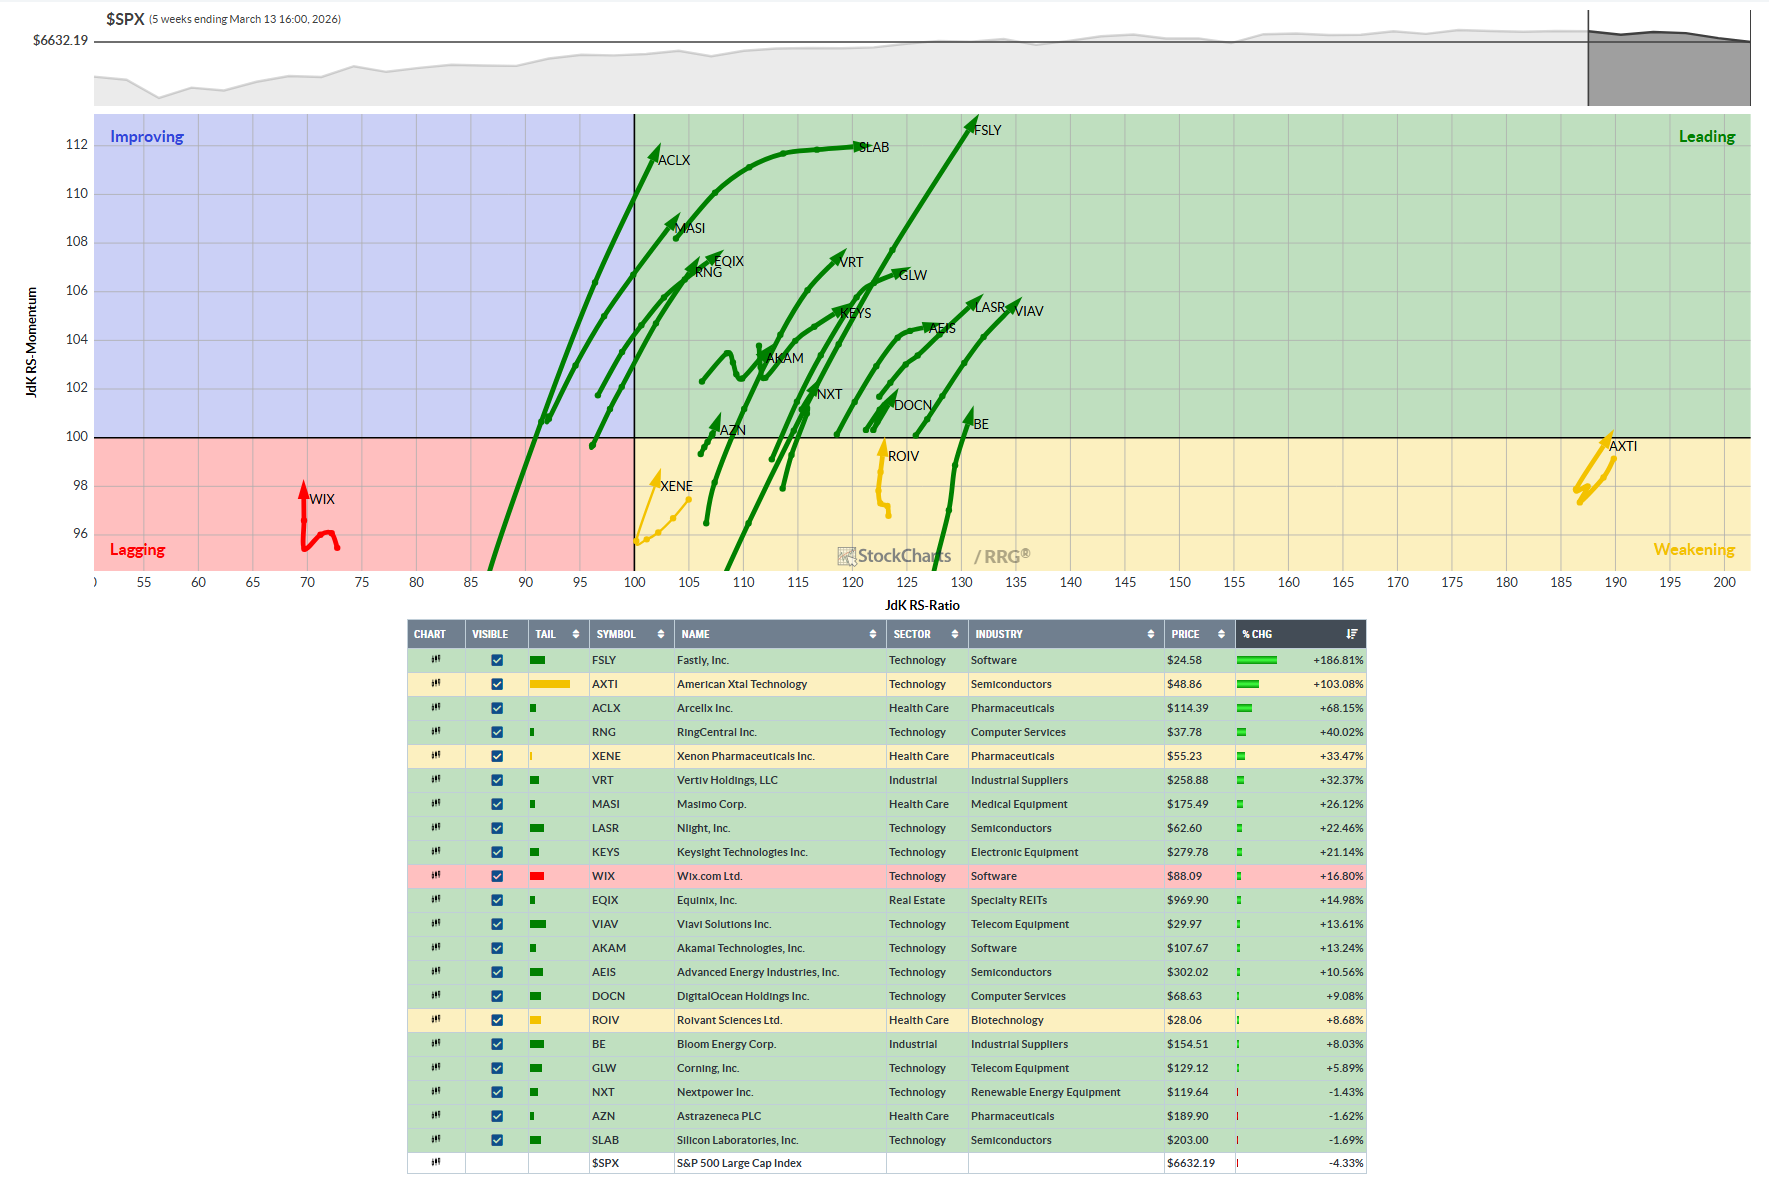
Liquid Leaders Growth sector with Bullish RRG: AXTI, ACLX, RNG, XENE, VRT, MASI, LASR, KEYS, WIX, EQIX, VIAV, AKAM, AEIS, DOCN, ROVR, BE, GLW, NXT, AZN, SLAB
Value versus SPY
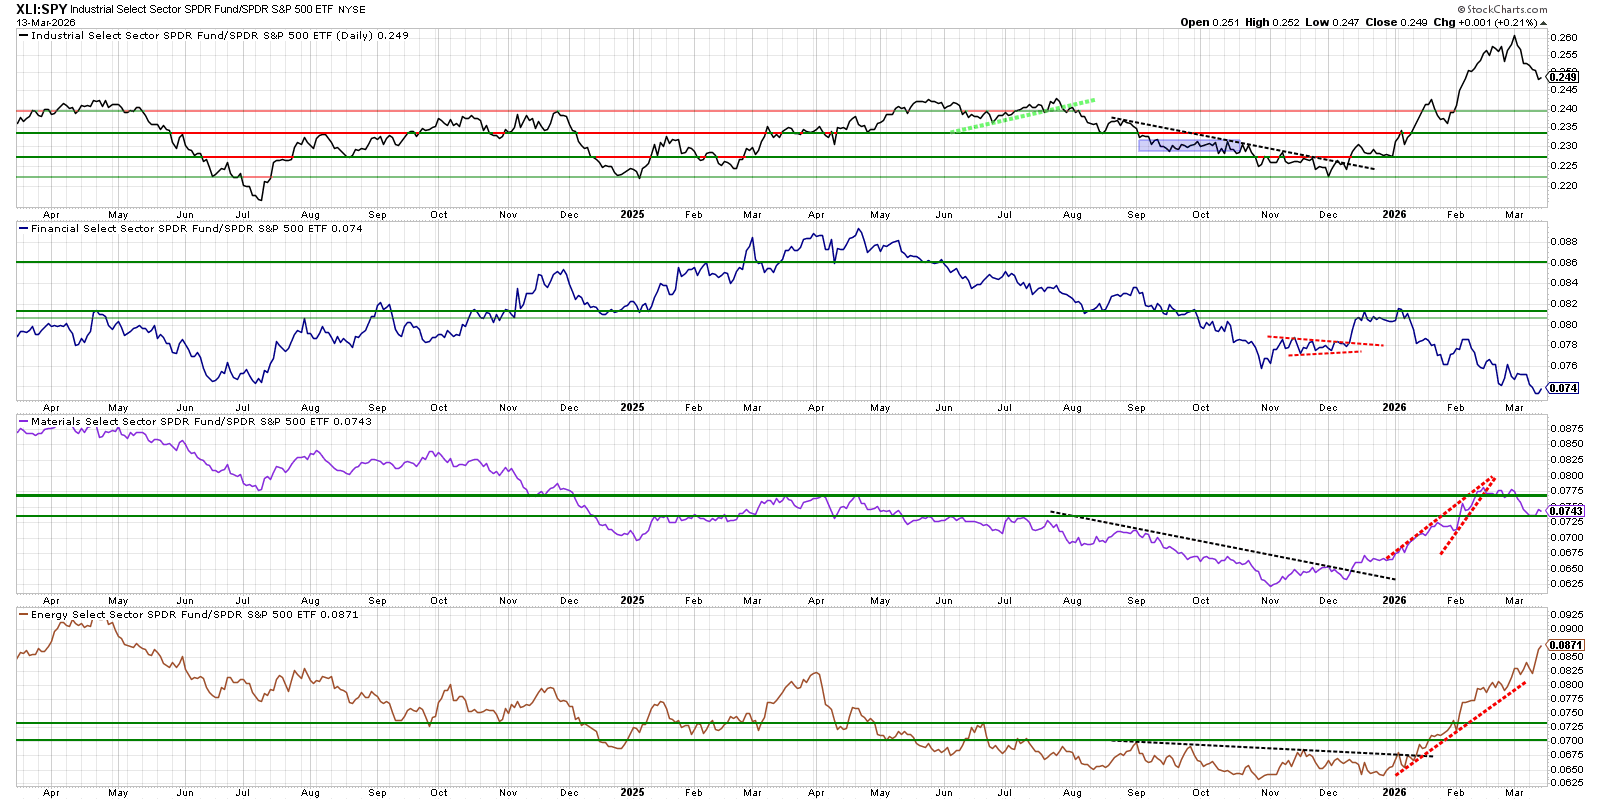
The chart shows a clear rotation within cyclicals: Energy is emerging as the clear RS leader, Materials broke its year‑long downtrend and is attempting to turn up off a key level after pulling back from the new higher high, while Industrials and Financials remain stuck in weakening/neutral ranges vs SPY.
Back to two list worth for Liquid Leaders in value this week…
Part 1: Liquid Leaders Value sector with Bullish RRG: DAWN, CF, COKE, CZR, AGX, DELL, CNQ, CHRD, LBRT, DOW, DAVE, COP, CVE, KR, IRM, FIX, LIN, CVX, KMI, CTVA, ADM, DVA, FRO, AEM, APD, CASY, SSPX
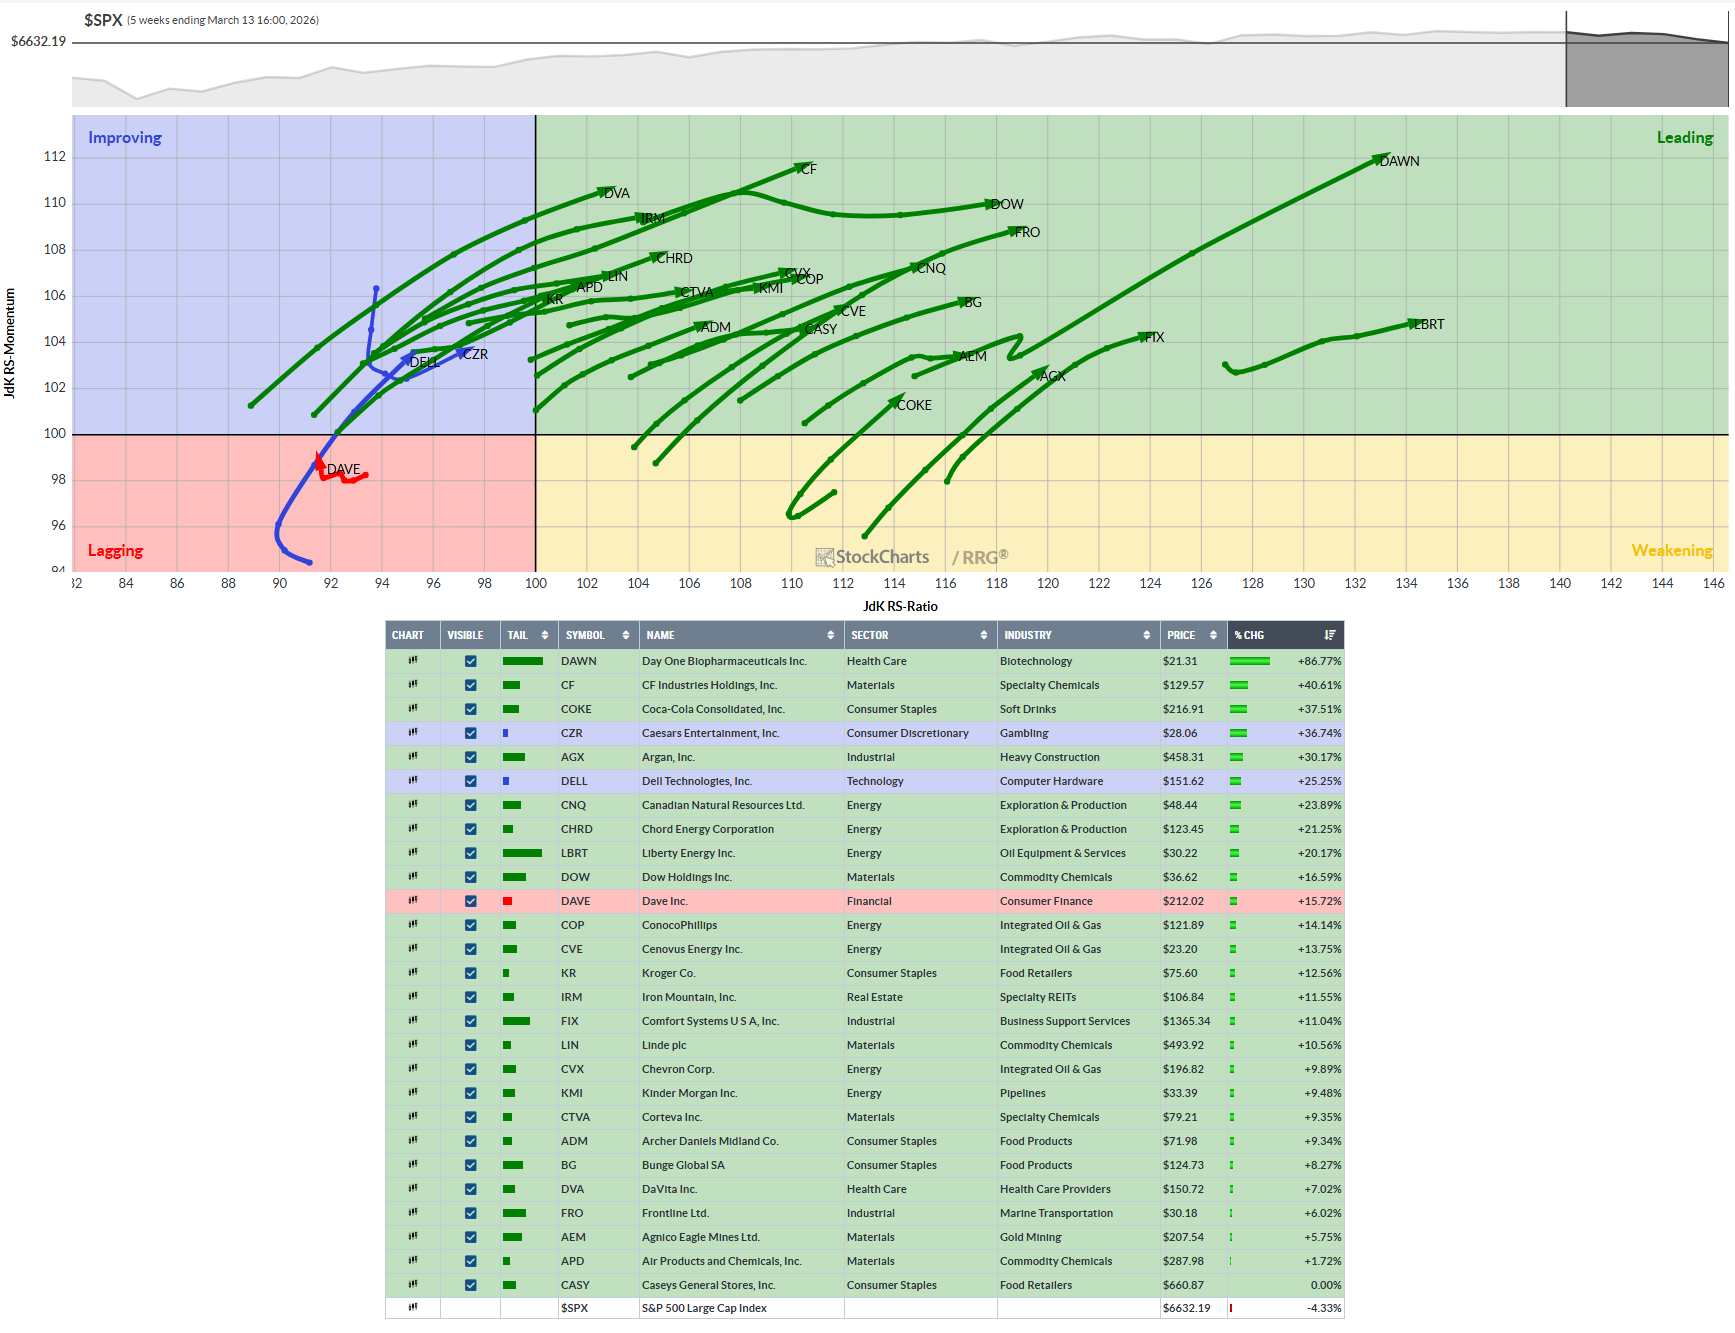
Part 2: Liquid Leaders Value sector with Bullish RRG: VAL, TPL, LYB, NBIS, TPH, SM, OXY, PBF, SFM, MTDR, NTR, OVV, LNG, SSRM, VLO, TRGP, TTE, SU, WMB, XOM, PWR, USFD
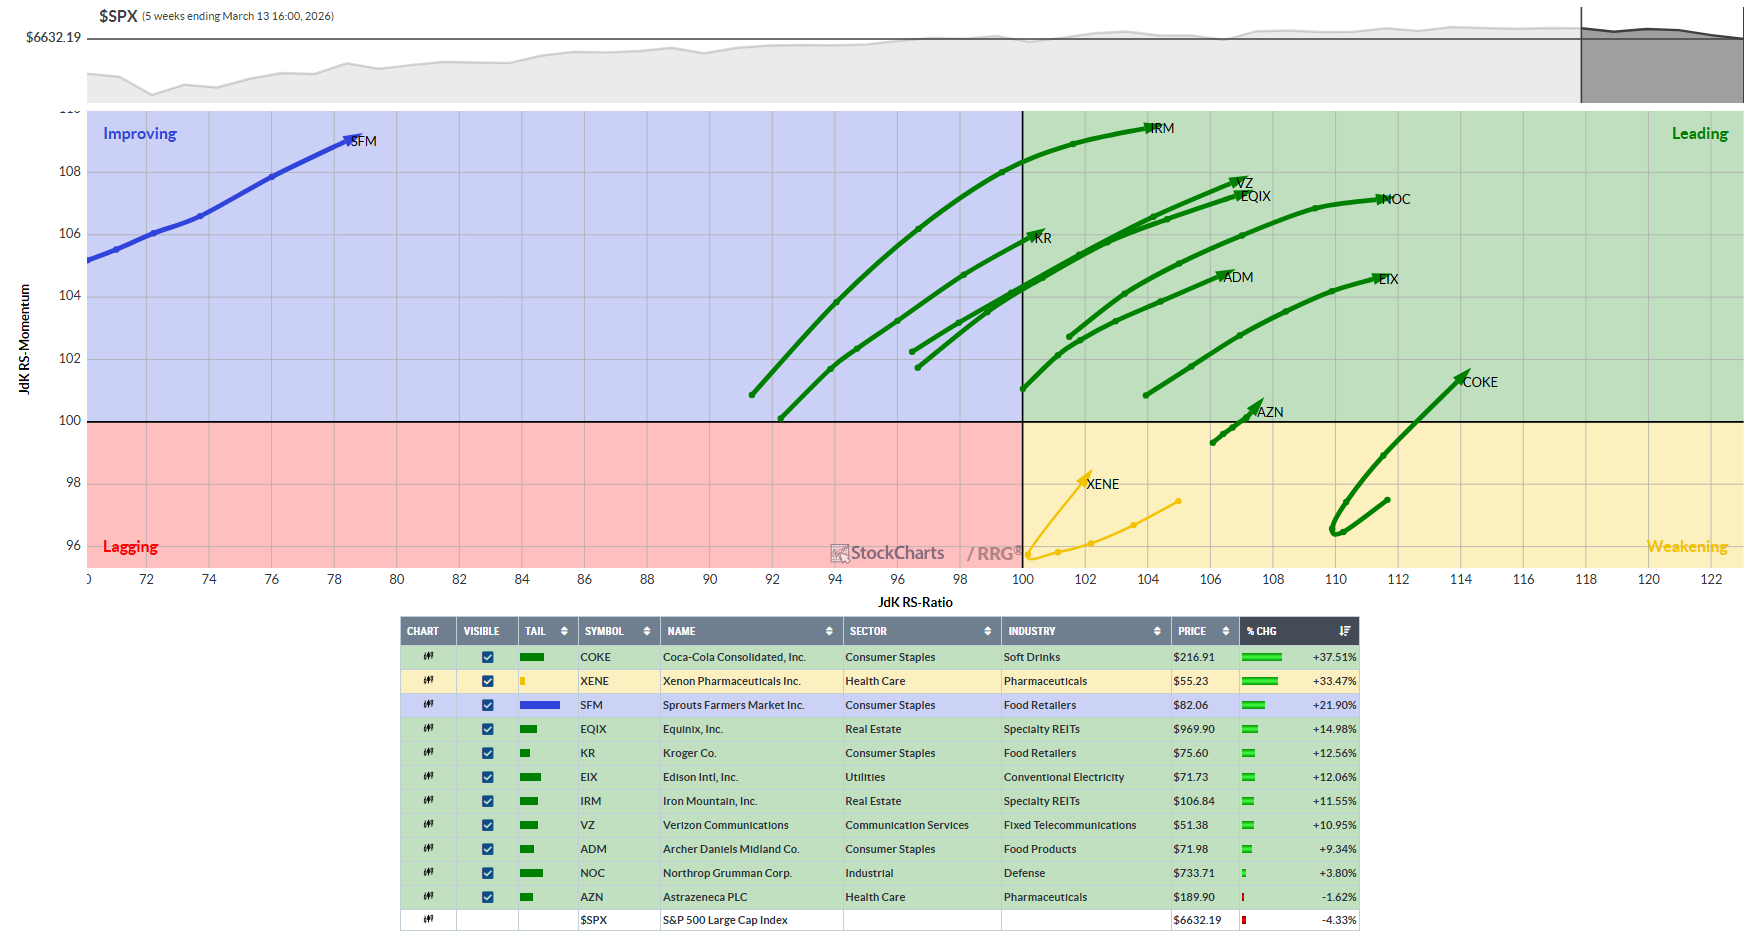
Defensives versus SPY
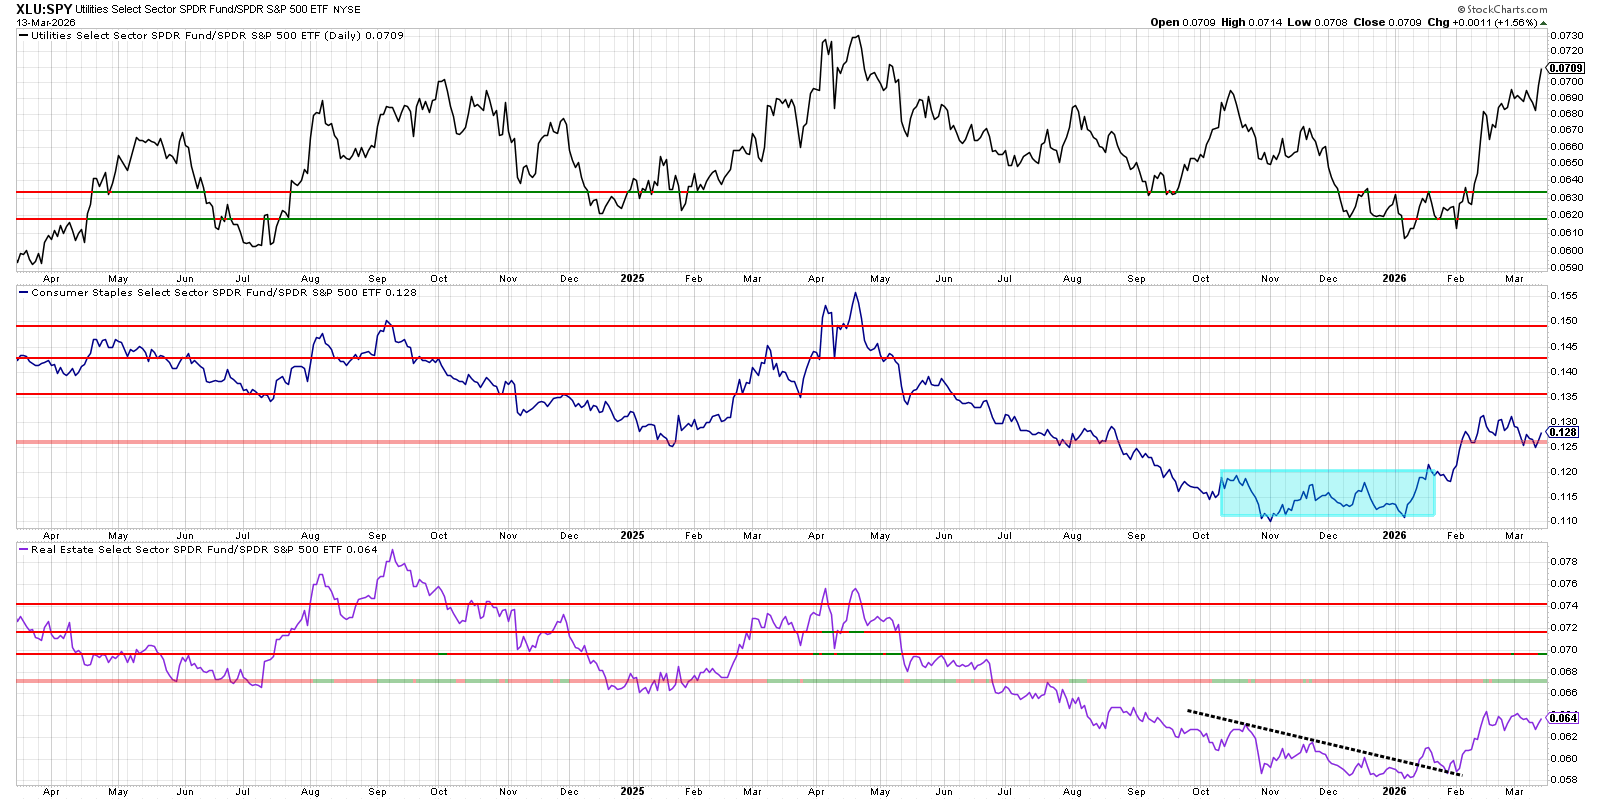
Trading takeaways:
For positioning into further volatility, XLU and XLP show the stronger, more actionable relative strength vs SPY, with XLU stretched and XLP earlier in its turn.
XLRE remains a laggard; for now, it is better suited for selective trades than for core defensive leadership.
Of note we have as expected quite a few more defensive tickers on the defensive leaders list. Still early in the potential trend.
Liquid Leaders Bullish Defensive RRG tickers: COKE, XENE, SFM, EQIX, KR, EIX, IRM, VZ, ADM, NOC, AZN
Bullish Relative Rotation Graph (RRG) ETFs of note
Bullish RRG etfs: XLRE, XLU, XLP, XLE, XLC, RTH, HACK, IHAK, IDNA, USO, XOP
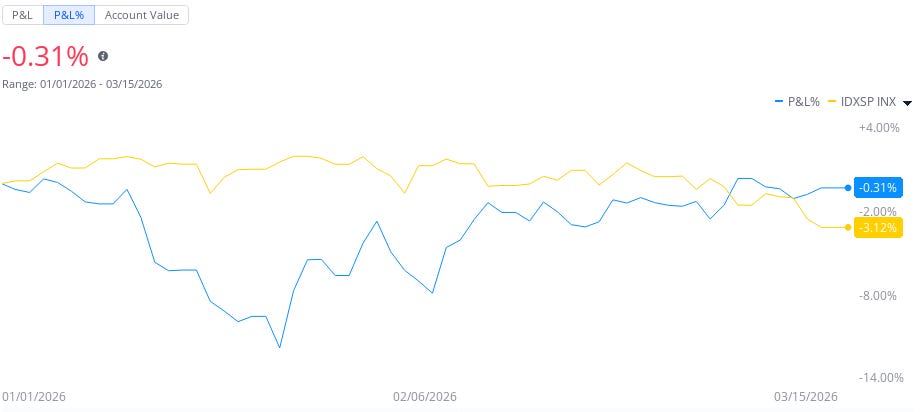
Thoughts this week: While I finished even on the week, the market is correcting, so now we are outperforming the S&P 500 on the year by +3%… Such a critical juncture. I lost some on gold this week and that drew me back despite some wonderful gains on a couple of my alerts. Probably just need to stick with my alerts only for now… Feels great and I’m well positioned with TRGP for potential gains longer term
You can do it, Keep Studying!
Most others don’t post their YTD because they can’t or frankly, they are lying. You better make sure, or you might lose it all…
Stock Talk Insiders discord
If you like this Phat Swing Plan, and you would like to receive alerts for my trades, click this link for the discord Stock Talk Insiders discord and enter the promo code: PHAT to get 10% off all packages for life...

Follow my alerts on Stock Talk Insiders discord Enter code: PHAT for 10% off
Follow my Phatstack for my Phat Swing Plan and updates during the week.
Follow me on X Phatinfantry Trading @Phatinfantry where I post/talk crap when I drink wine and make fun of dumb things.
Follow me on YouTube where I go through my process and review charts Phatinfantry