
Phat Swing Plans and Observations
For the week of 1/20/26


Iceland war of 2026 edition…
U.S. equities finished the week ended Friday, Jan. 16, 2026 essentially flat at the index level, with modest losses for large-cap benchmarks but notable outperformance from small caps and value.
Index performance
S&P 500 fell roughly 0.3–0.4% for the week, leaving the index just below recent highs.
Dow Jones Industrial Average slipped about 0.2–0.3% over the week as it continues to hover just below the 50,000 level.
Nasdaq Composite declined about 0.6–0.7%, reflecting some cooling in the mega-cap growth/tech complex.
Russell 2000 gained around 1–2% for the week, extending a recent stretch of small-cap leadership.
Sector and style trends
Large caps were slightly negative overall, while mid caps and small caps posted gains, with small caps up about 1.3% in aggregate.
Growth, blend, and value all finished higher on a style basis, but value and smaller-cap/value-tilted benchmarks outperformed, signaling continued rotation away from a narrow mega-cap tape.
Consumer defensives and real estate were among the best-performing sectors, each up roughly 3.6–3.7% for the week.
Financial services and communication services lagged, each down about 2% on the week.
Rates, dollar, and macro backdrop
Treasury yields ended the week slightly higher but remained in a tight range, with the 10-year around the low 4% area and volatility in rates still subdued.
The dollar index was modestly higher on the week, but still below its 2025 highs, reflecting a tempered but ongoing bid for the currency.
Markets weighed mixed signals: easing inflation and solid consumer data versus uncertainty around the Fed’s next steps and policy developments in Washington, contributing to the choppy but rangebound index action.
Earnings and themes to note
The early part of Q4 2025 earnings season kicked off, with a small number of S&P 500 names reporting, led by large financials that generally delivered better-than-expected results and stable credit commentary.
AI and semiconductor sentiment got a lift after Taiwan Semiconductor (TSM) reported strong results, reiterated robust AI-driven demand, and signaled higher capital spending over the next several years.
Cross-asset signals were mixed: equities were flat-to-mixed, small caps and value outperformed, and commodities and crypto showed strength, underscoring a fragmented environment without a single dominant risk-on or risk-off narrative.
The StockCharts Technical Rank (SCTR)
Proprietary ranking score (0-100) by Stockcharts.com that evaluates a stock or ETF’s technical strength compared to its peers, using a blend of multiple timeframes and momentum metrics.
Interpretation and Use
Top 10%: SCTR scores 90–100 indicate strong technical leaders.
Middle Range: Scores between 40–60 represent average technical strength.
Bottom 10%: Scores 0–10 indicate technical laggards.
Scores above 60 generally signal relative technical strength, while scores below 40 highlight weakness.
SCTR is best used for peer comparisons and screening for momentum, rather than as a standalone trading/signal tool.
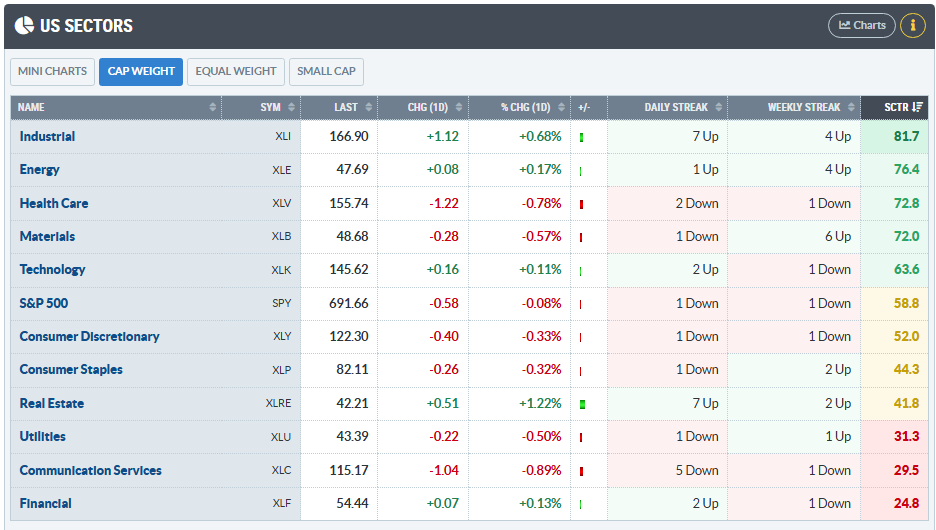
Industrial and Energy are currently the leading sectors on a relative-strength and momentum basis, while Financials and Communication Services are clear laggards and under distribution.
Leadership and momentum
Industrial (XLI) is top-ranked on SCTR and showing a strong upside momentum profile, with price up on the day, a 7-day positive streak, and multiple weeks up, confirming institutional accumulation.
Energy (XLE) is also in short-term leadership: green on the day, in an up streak, and near the top of the SCTR stack, suggesting continued rotation into cyclicals and commodities.
Real Estate (XLRE) shows an outsized 1‑day gain and high SCTR for a defensive sector, implying a bid into yield/REITs, likely tied to rate expectations.
Weakness and risk-off pockets
Financials (XLF) sit at the bottom of the SCTR rankings with only a marginal daily gain and a down weekly streak, indicating persistent underperformance and poor risk‑reward for swing longs.
Communication Services (XLC) and Utilities (XLU) also show low SCTR scores and recent downside streaks, flagging them as short or avoid zones for momentum strategies.
Core benchmark context
The S&P 500 (SPY) was red on Friday with a modest SCTR and has opened and closed red 4 days in a row. This is confirming sector rotation (into Industrials/Energy/Real Estate) rather than broad index strength is driving opportunity.
Technology (XLK) remains mid-pack on SCTR with a small daily gain and an up streak, signaling it is no longer the sole leadership group but still a neutral-to-constructive swing long space.
Swing-trading implications
Long bias: Focus on Industrials, Energy, and selective Real Estate names with liquid setups, as their strong SCTR and positive streaks favor continuation trades.
Short/hedge bias: Consider fades or relative-value shorts in Financials, Communications, and weaker defensives where SCTR and streak structure show persistent underperformance.
Market stance: Treat SPY as neutral/slightly corrective and prioritize relative strength/weakness plays over broad index exposure until sector dispersion narrows.
So once again, we see the “Great Rotation” pattern continuing.

Major Economic Events
This upcoming week (Jan 19–25, 2026) is heavy on inflation, growth data, and central banks, with the US PCE and Q3 GDP revision as the main macro catalysts.
Monday, Jan 19, 2026
China Q4 GDP, Industrial Production, Retail Sales – 9:00 PM (Sun, Jan 18, ET, prior evening).
US: Martin Luther King Jr. Day – US banks and stock exchanges closed all day.
Tuesday, Jan 20, 2026
China: PBoC Rate Decision – 8:15 PM ET (Mon, Jan 19).
Wednesday, Jan 21, 2026
UK CPI and Core CPI – 2:00 AM ET.
Thursday, Jan 22, 2026
US Q3 GDP (final) – 8:30 AM ET.
US Core PCE in GDP release – 8:30 AM ET.
US Core PCE Price Index (monthly) – 10:00 AM ET.
Friday, Jan 23, 2026
Japan: BoJ Rate Decision – after 10:00 PM ET (Thu, Jan 22), no fixed time.
BoJ Press Conference – 1:30 AM ET.
US PMIs (prelim) – 9:45 AM ET.
Key earnings for the week
Key earnings this week (Jan 19–23, 2026) are clustered Tue–Thu, with NFLX, INTC, JNJ, MMM, UAL, ISRG, PG and HAL among the main names to watch.
Tuesday, Jan 20, 2026
Netflix (NFLX) – after close.
United Airlines (UAL) – after close.
Interactive Brokers (IBKR) – time TBD (commonly before open).
Wednesday, Jan 21, 2026
Johnson & Johnson (JNJ) – before open.
3M (MMM) – before open.
Intuitive Surgical (ISRG) – after close.
Thursday, Jan 22, 2026
Intel (INTC) – after close.
Procter & Gamble (PG) – before open.
Halliburton (HAL) – before open.
Friday, Jan 23, 2026
Schlumberger (SLB)
Deepvue Market Themes
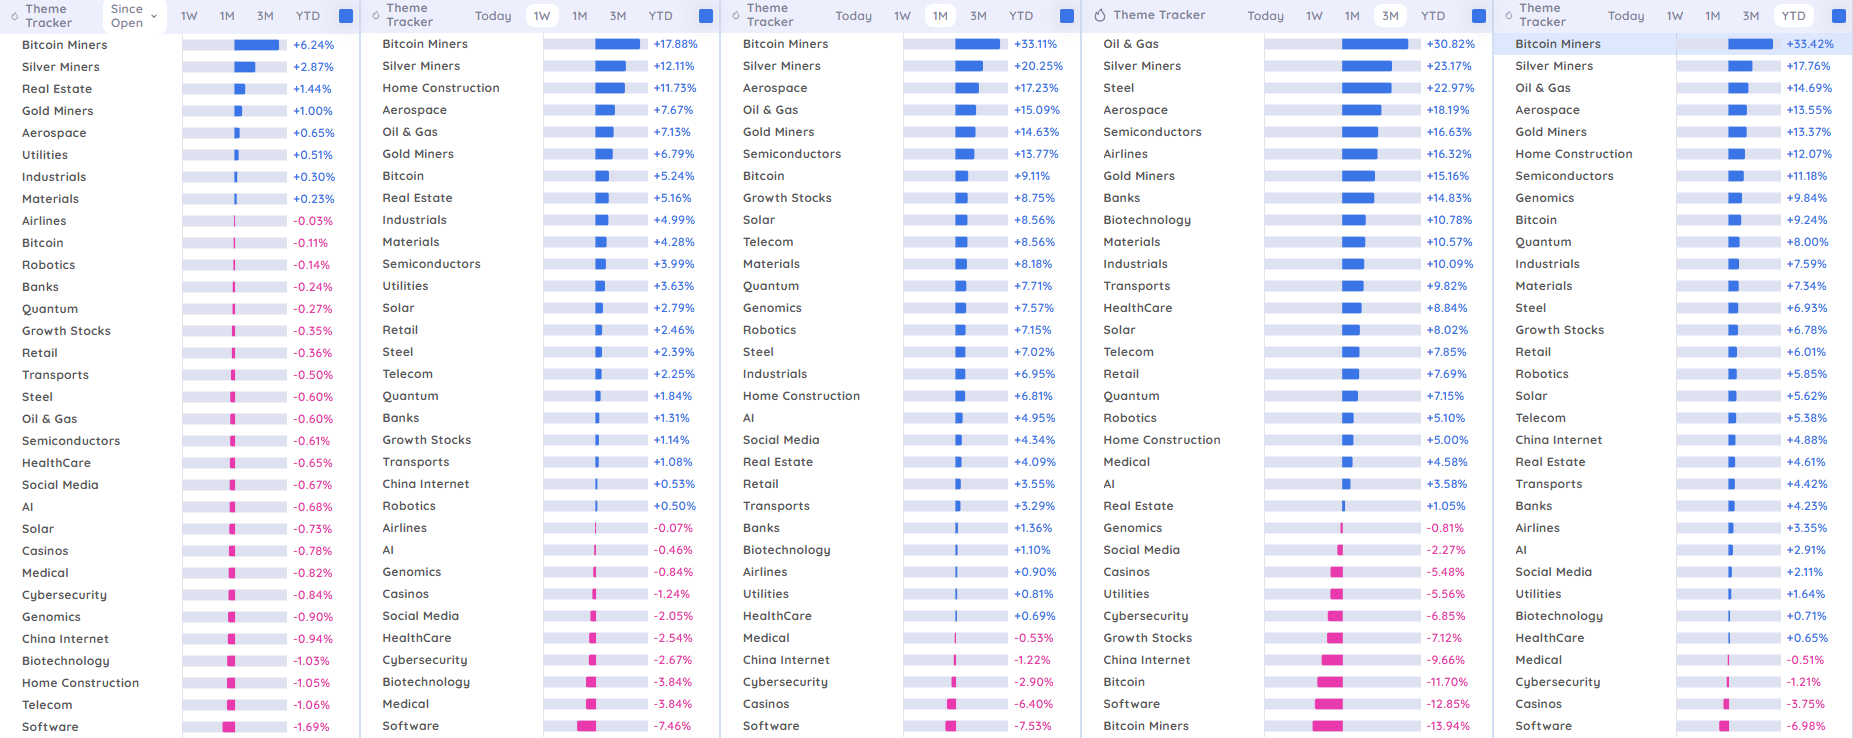
Trading Implications Phat Swings
Favor long setups in bitcoin miners/crypto, silver & gold miners, oil & gas, semis, and high‑beta cyclical groups (aerospace, homebuilders) as long as their 1M/3M strength and relative ranking stay intact.
TradersLab.io Themes
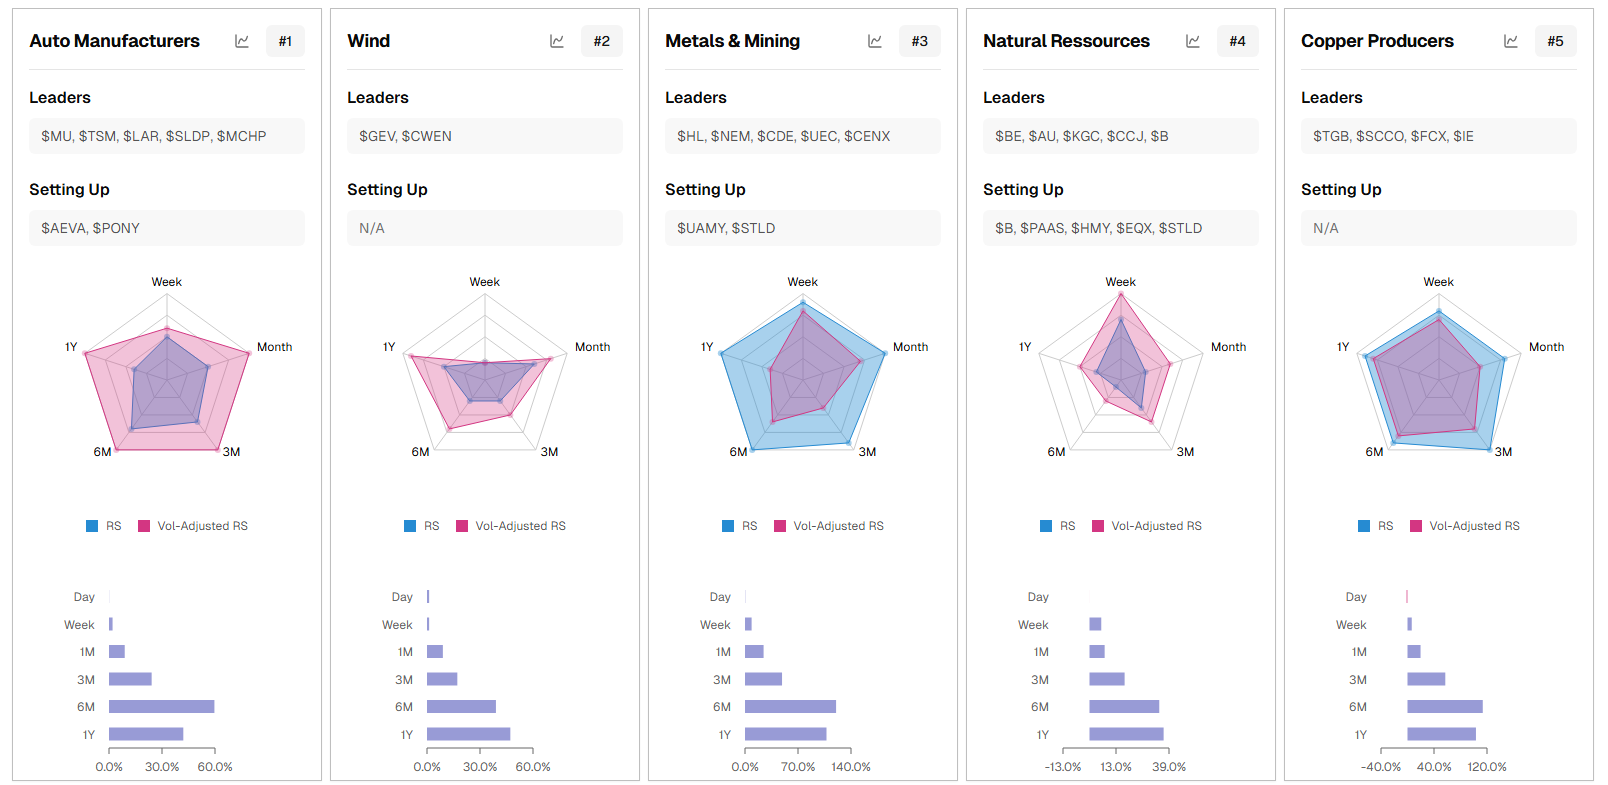
What’s clearly leading
Auto Manufacturers, Metals & Mining, Natural Resources, and Copper Producers sit at the top of the rank stack and show broad, outward‑bulging RS polygons and strong 3M–6M–1Y bars, marking them as current leadership clusters.
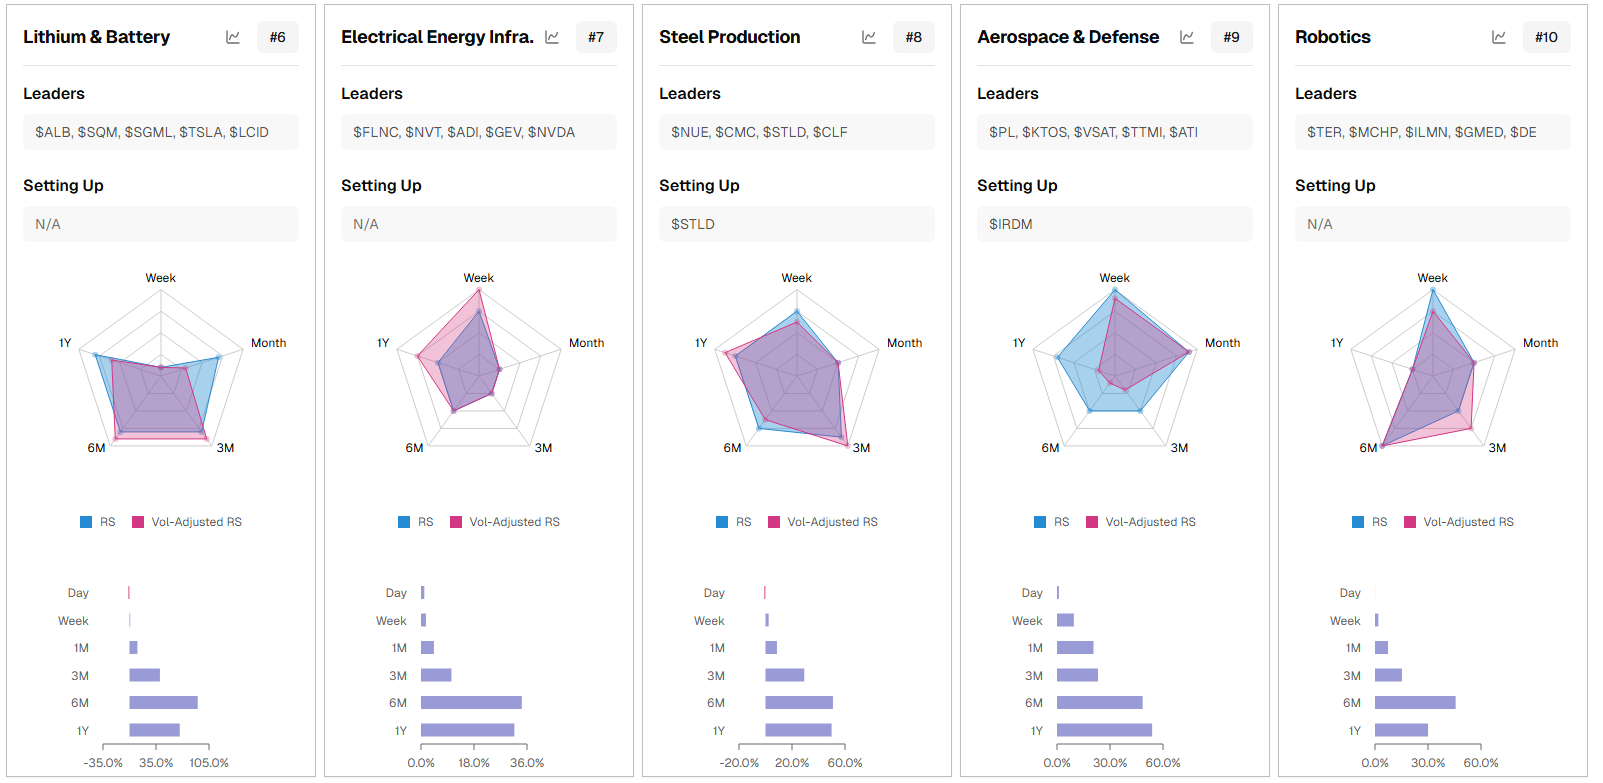
In the second row, Lithium & Battery, Electrical Energy Infra., Steel Production, Aerospace & Defense, and Robotics have solid but slightly less uniform RS, so they are secondary leaders but still fertile swing‑trading ground while their Week/Month RS stays firm.
What’s improving or “setting up”
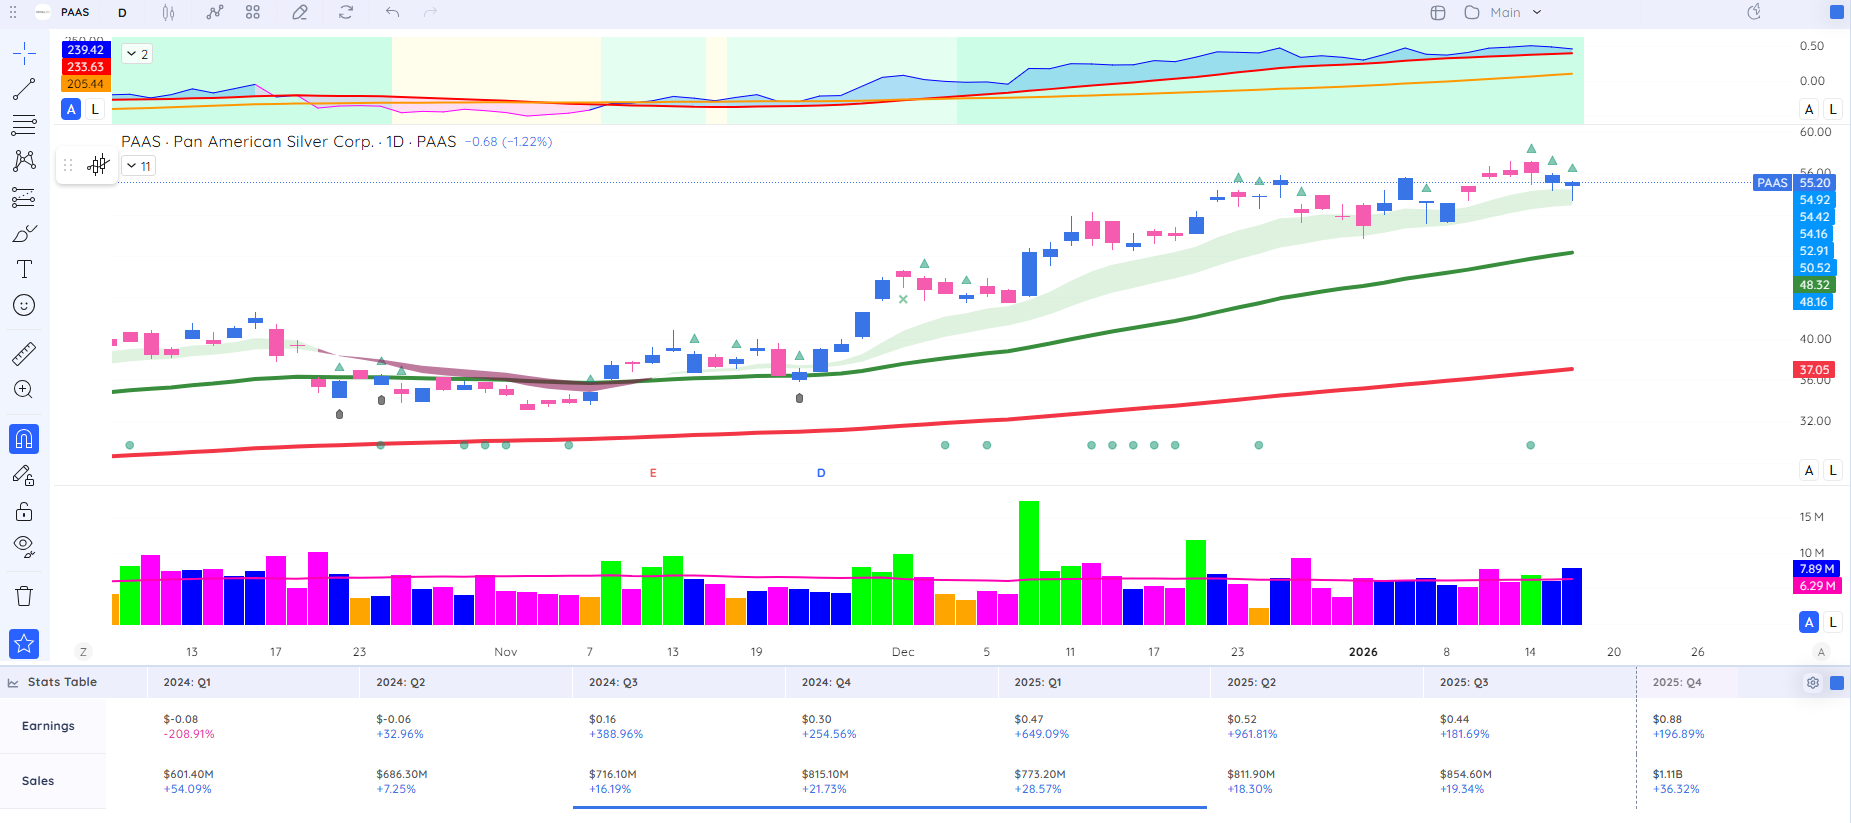
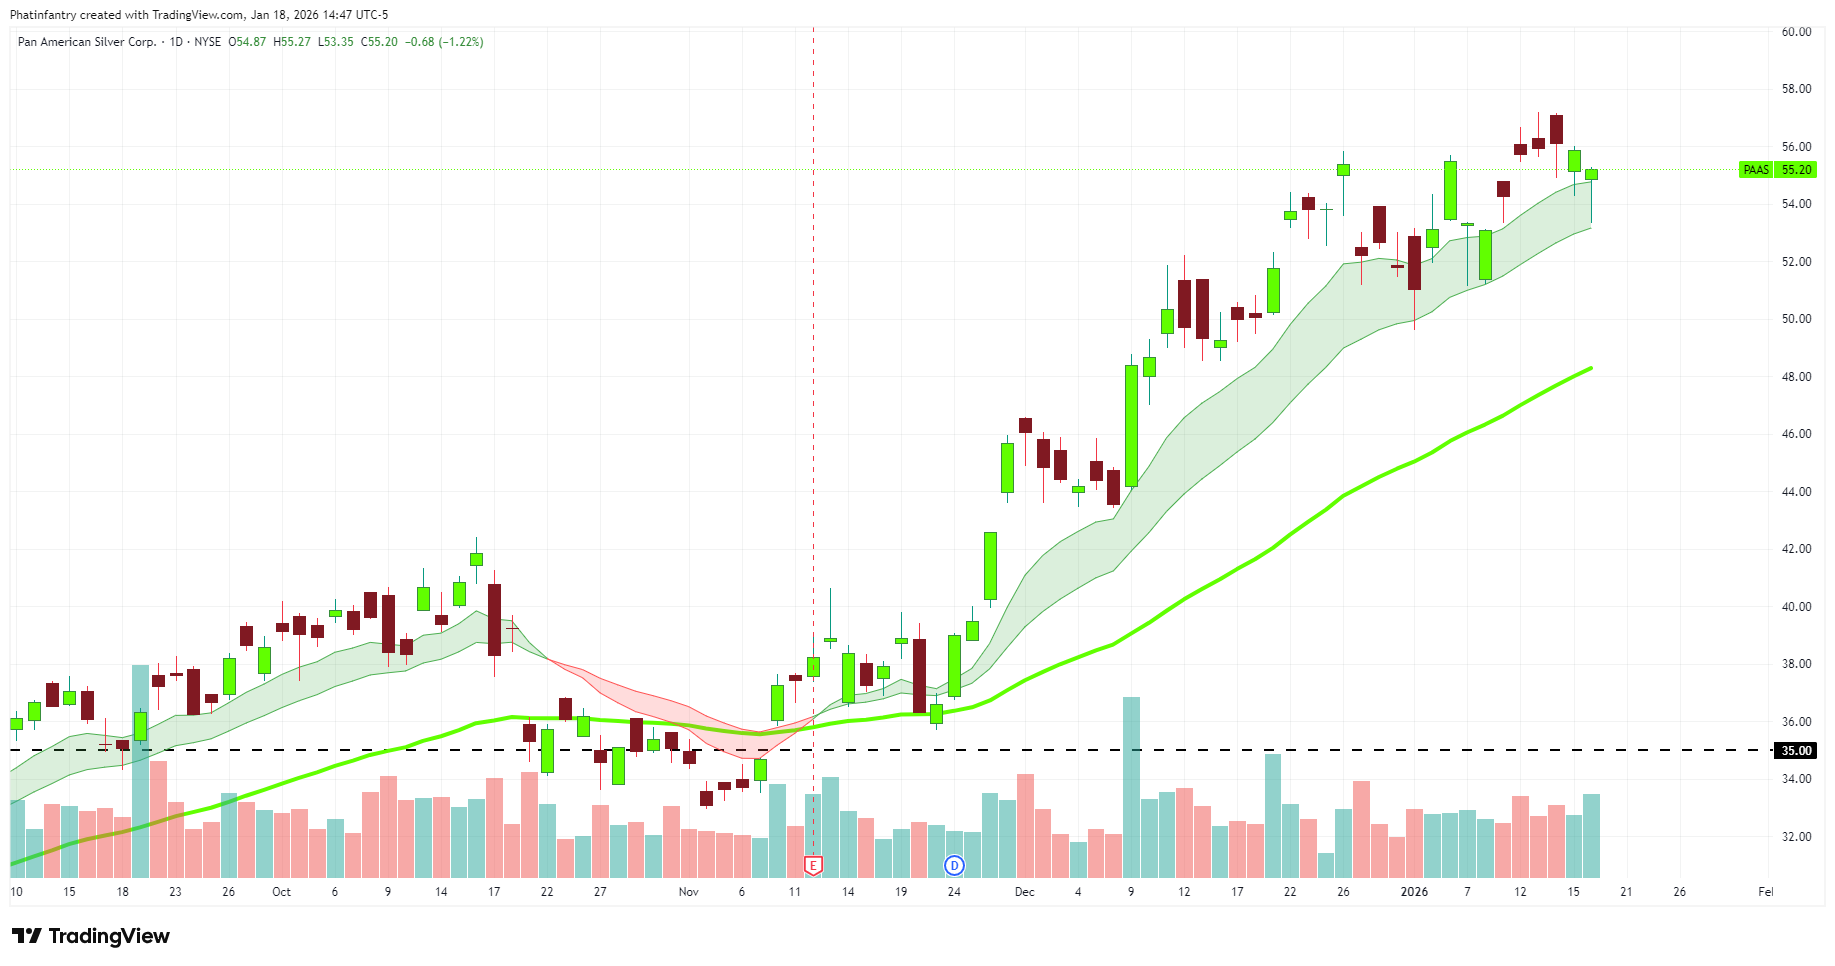
Themes like Wind and Natural Resources. Wind has strong RS on the monthly, but we could see a pullback soon for entry, as the RS on the weekly was weak this week. Natural Resources have several tickers setting up. Notably PAAS with silver is in an upside reversal on the price chart.
Market Carpet for the week
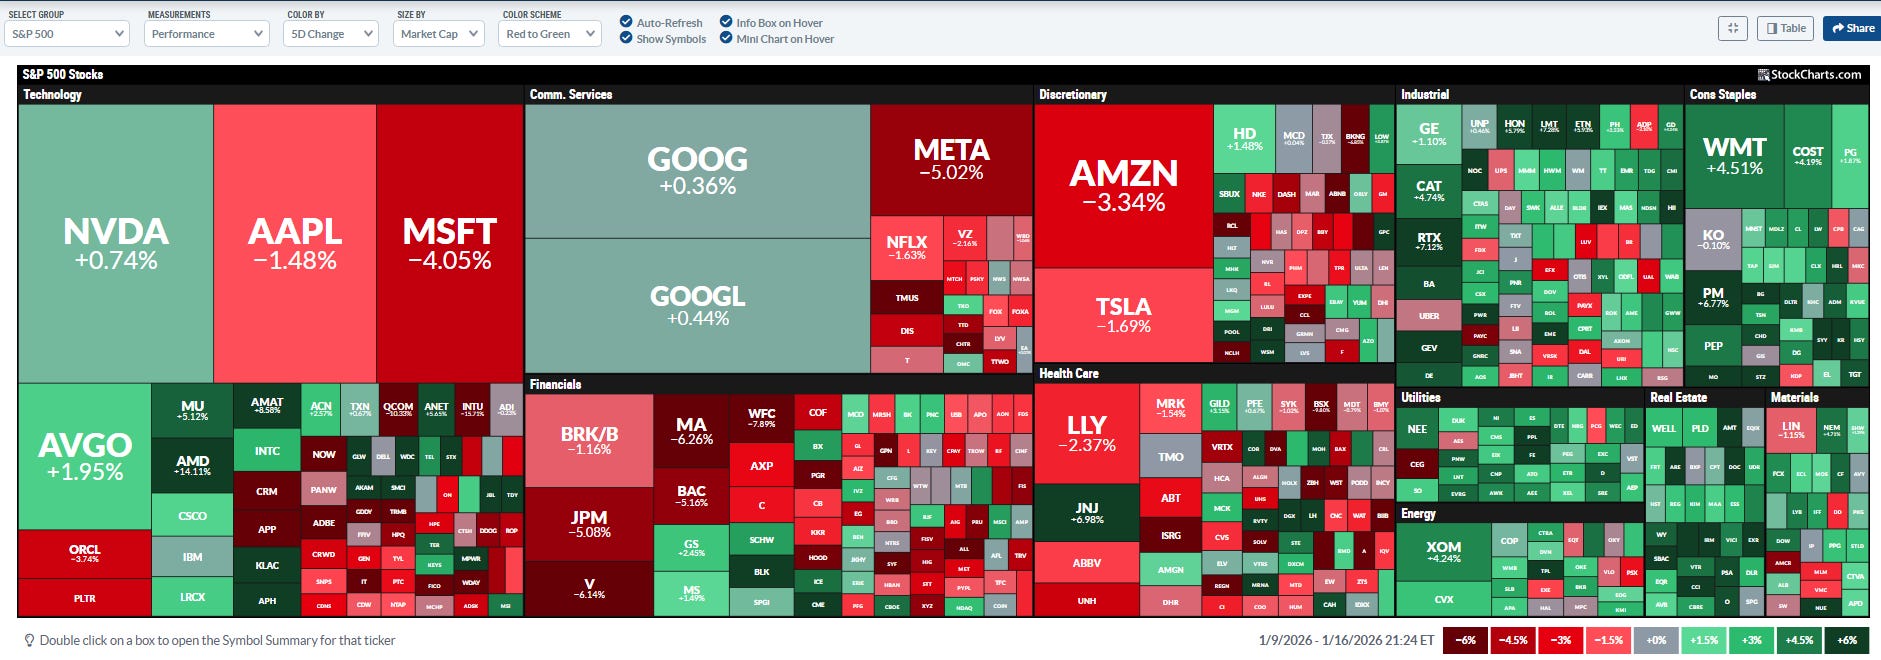
The S&P 500 had a defensive, rotation-heavy week: big Tech and growth were sold while staples, industrials, and energy caught a strong bid.
Tech and communication
Mega-cap Tech was net risk-off: MSFT and AAPL showed sharp 5‑day underperformance, while NVDA and AVGO held slightly positive, signaling continued preference for AI/semis over broad mega-cap growth.
In Comm Services, GOOG/GOOGL were marginally green while META and NFLX were notably red, hinting at profit-taking in prior leaders and mild rotation into more “value-ish” parts of the complex.
Discretionary vs defensives
AMZN and TSLA were down over the last 5 days, and much of consumer discretionary skewed red, suggesting pressure on high-beta consumer risk.
In contrast, consumer staples led: WMT and several packaged-goods names printed strong 5‑day gains, showing a move into defensive earnings stability.
Financials and rates sensitivity
Large banks (JPM, BAC, WFC) and brokers were negative on the week, which often aligns with either curve flattening concerns or fears of slower credit growth.
GS and a few niche players were green, implying selective appetite for capital markets exposure rather than broad financials beta.
Health care, utilities, and real estate
Health care was mixed to slightly negative; large pharmas like LLY and JNJ were red, reducing their recent leadership footprint.
Utilities and many REITs tilted green, which together with staples strength reinforces a lower‑beta, yield/defensive rotation theme.
Industrials, energy, and materials
Industrials had broad strength, with names like CAT and parts of aerospace/defense solidly green, consistent with ongoing infrastructure and defense spending narratives.
Energy (XOM, CVX) was strongly positive, indicating renewed interest in commodity and cash‑flow plays, while materials showed selective strength, hinting at reflation/infrastructure positioning rather than pure growth chasing.
Psych Charts of note
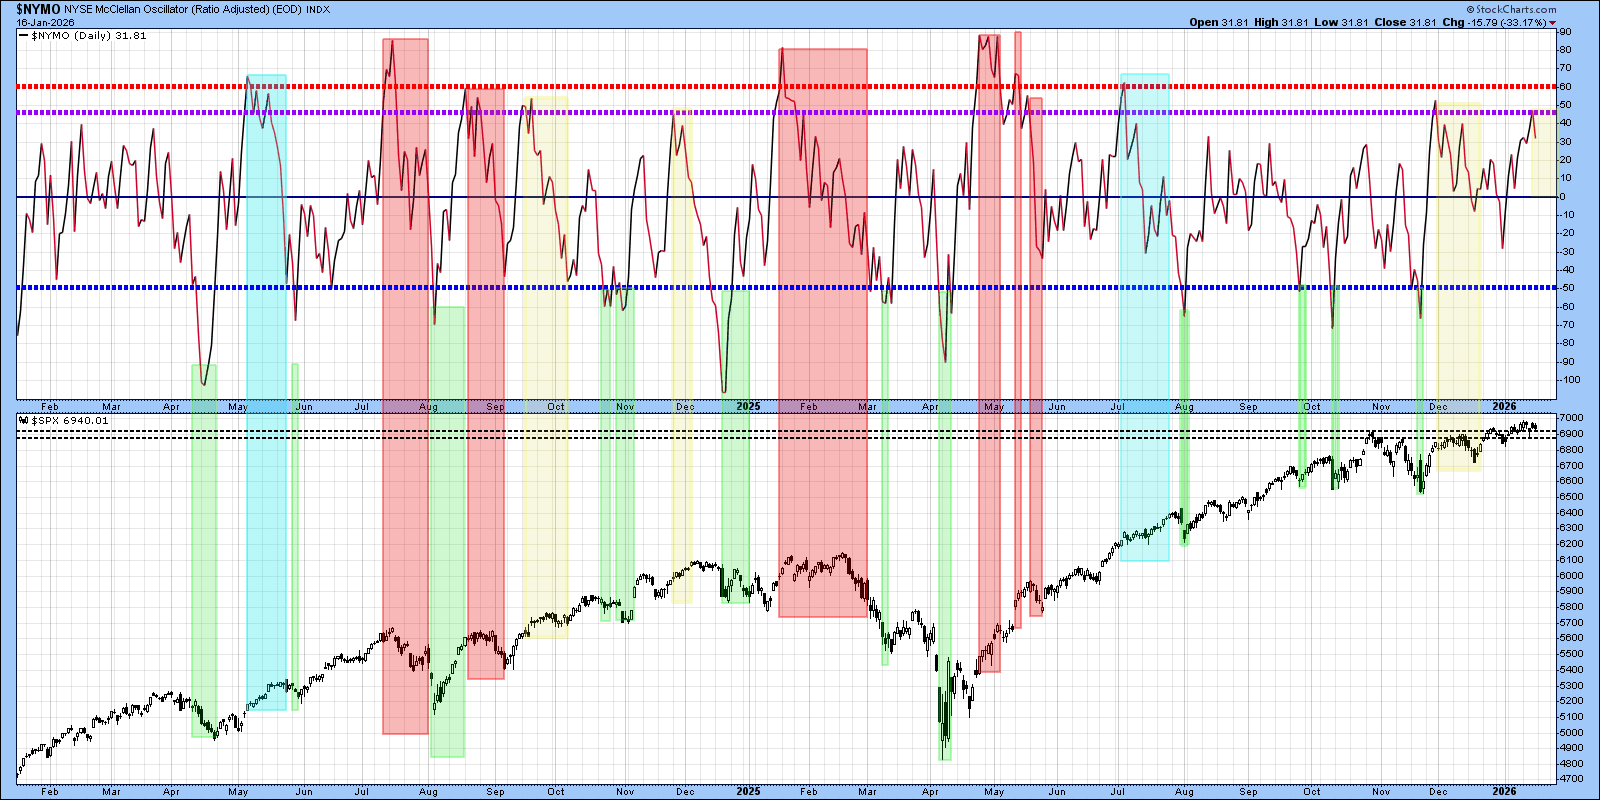
$NYMO
It doesn’t always work but over the past two years that purple line has been certainly at least an area of caution. As you can see in the cyan colored shading, it doesn’t always mean we cool off… Remember we are in a run-it-hot environment, so news from Trump can trigger reversals but it leans cautious.
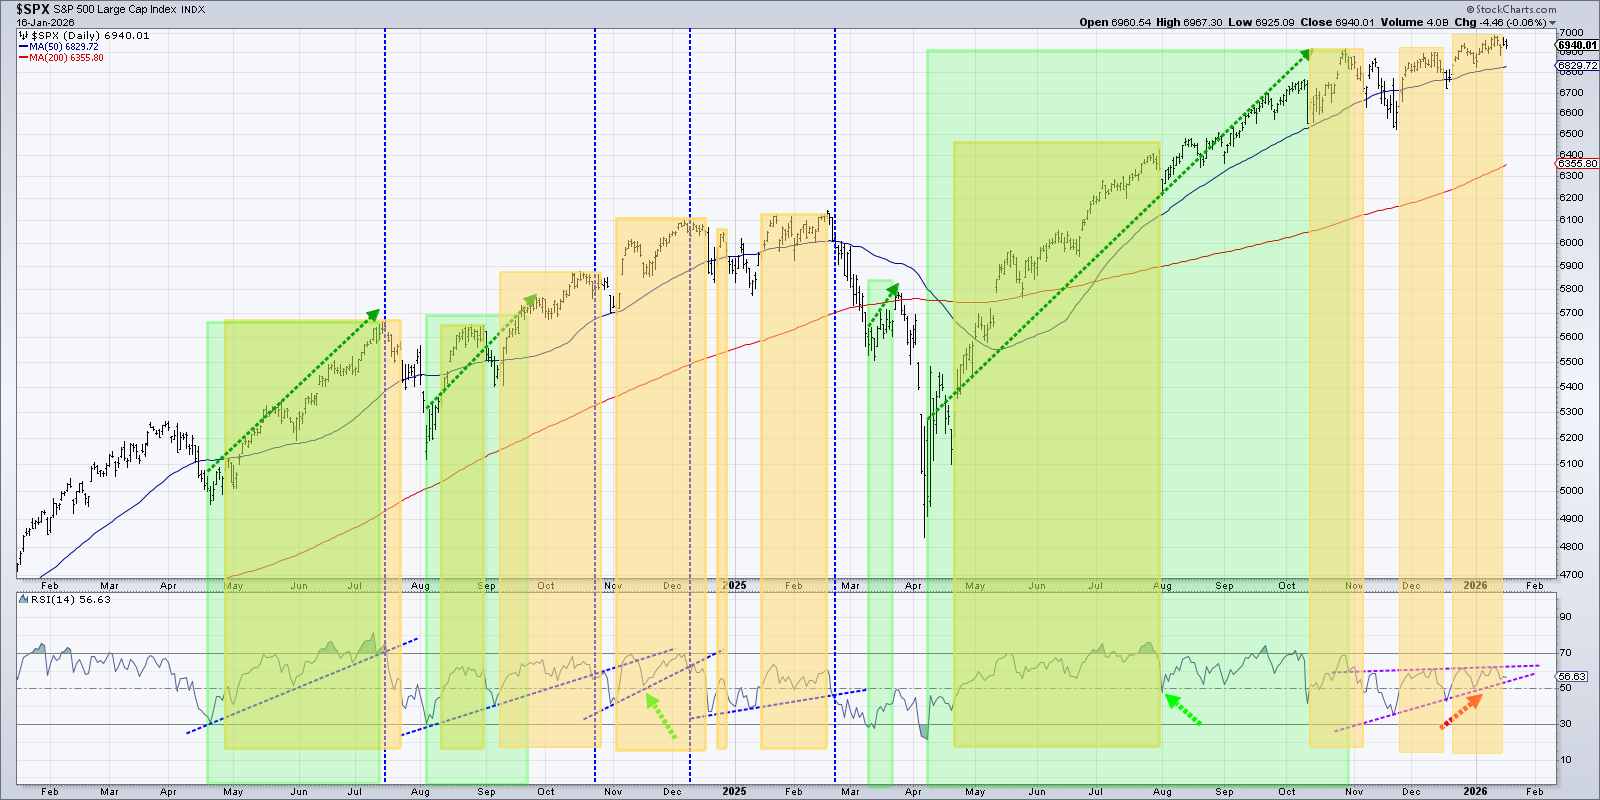
SPX RSI
Probably looks ridiculous but I don’t care. RSI with an ascending wedge. You can see the results of prior ascending wedging… Play until the music stops…
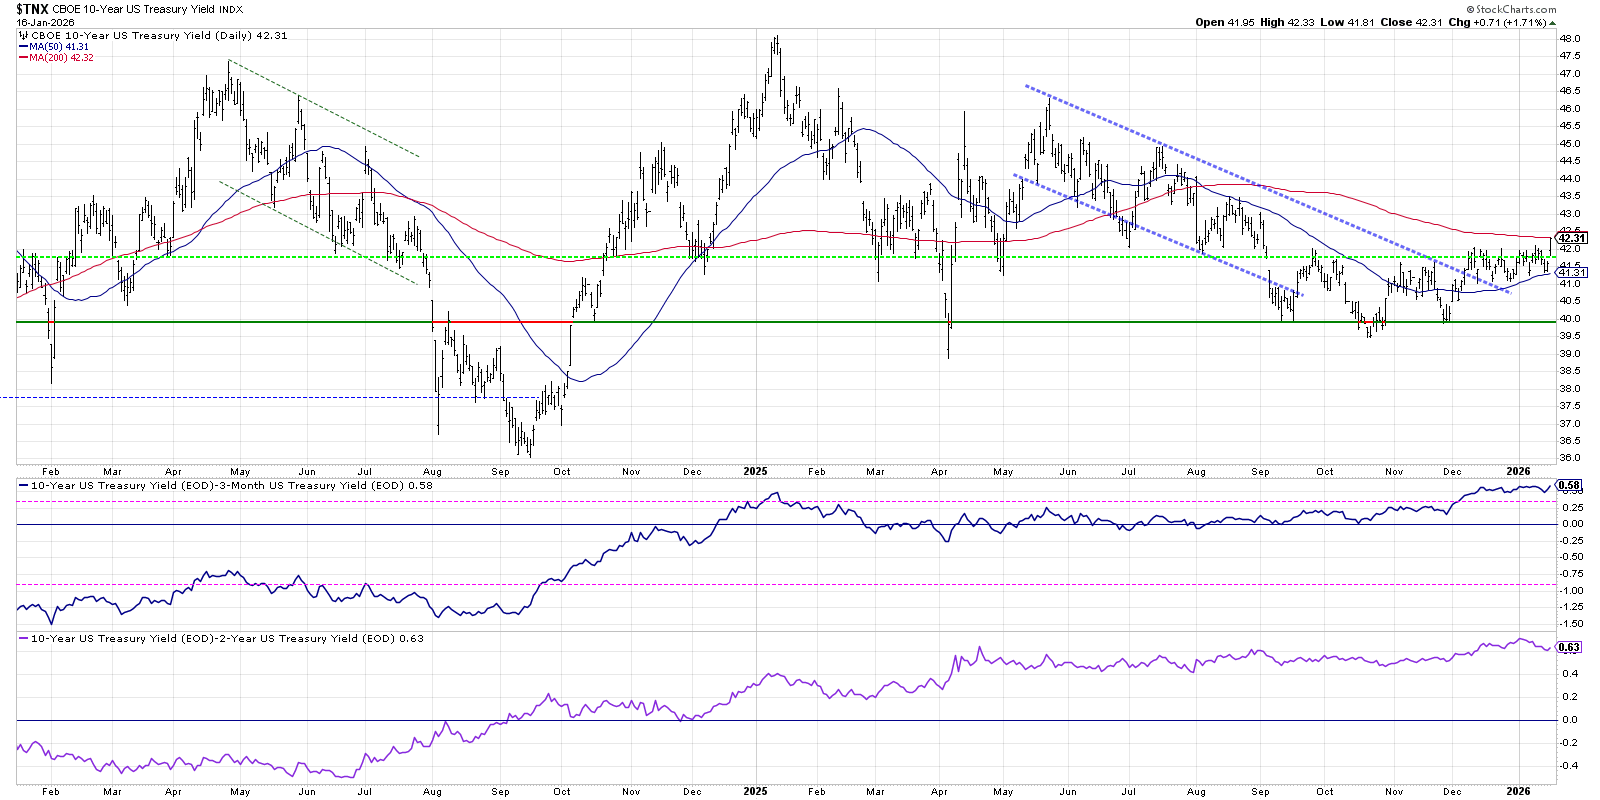
TNX
Breaking consolidation and up against the 200 SMA
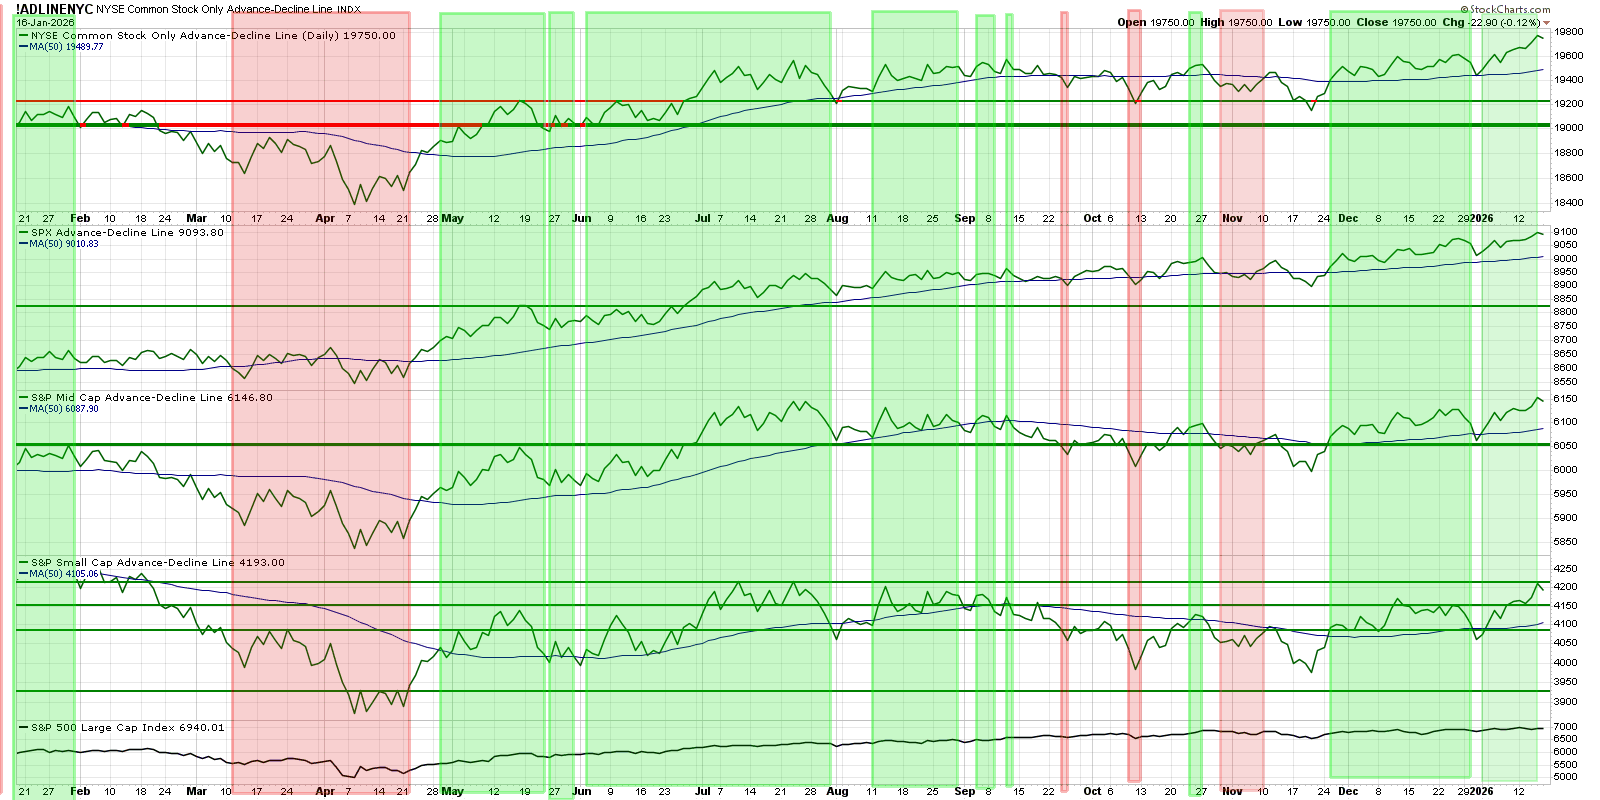
Advancing Declining for S&P Small/Mid/Large caps Bullish AF…
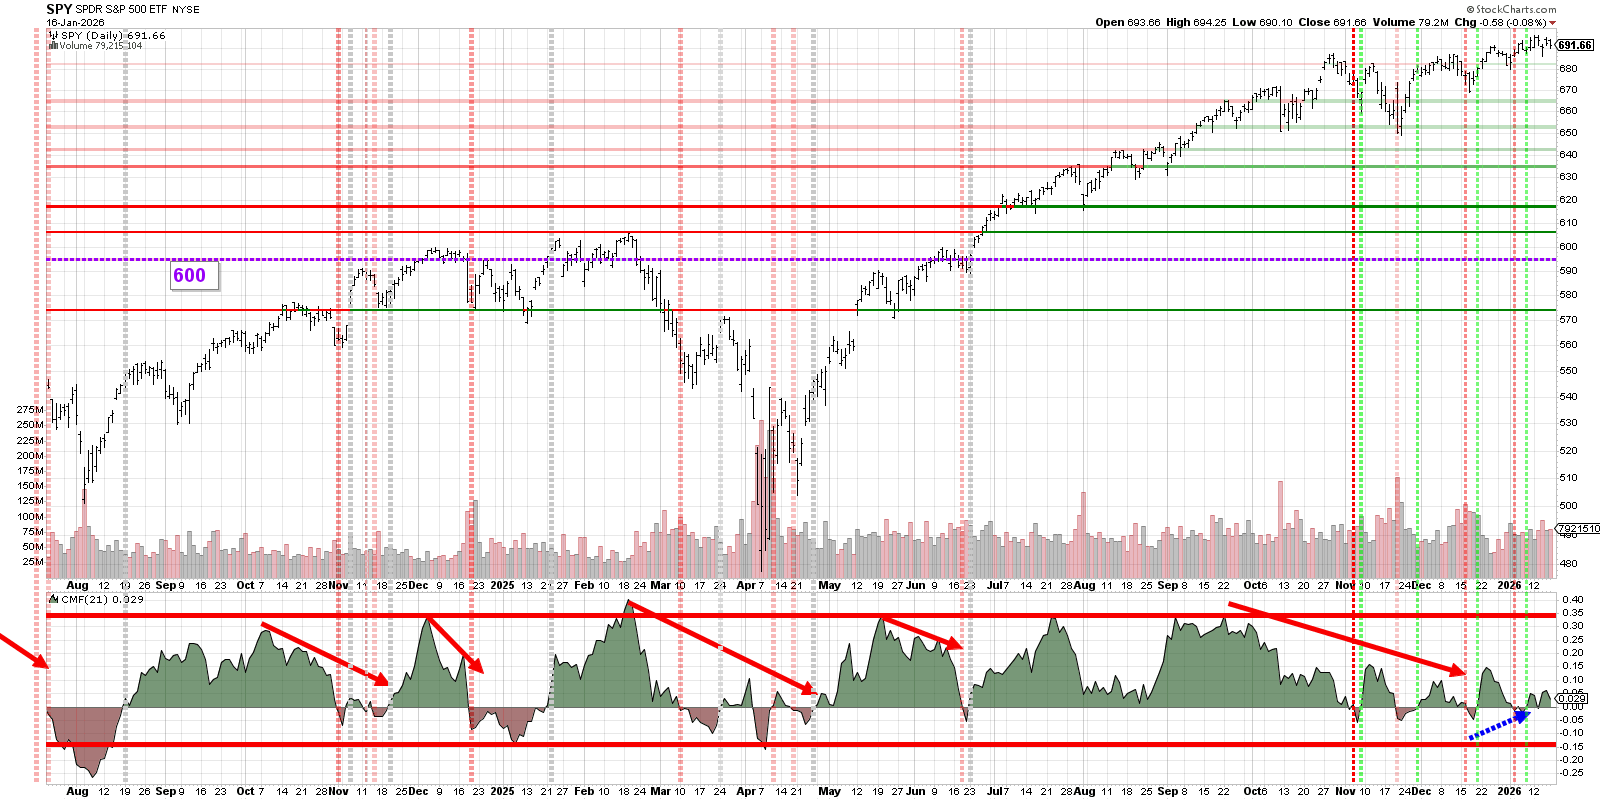
SPY
Just my opinion which I shouldn’t give, but it looks like this as a late‑stage uptrend leg. Buying the dip is still good but maybe we lessen our expectation of sustained moves unless CMF starts to expand again. Could be selling by institutions into strength…
SPY chart with Deepvue market trend analysis
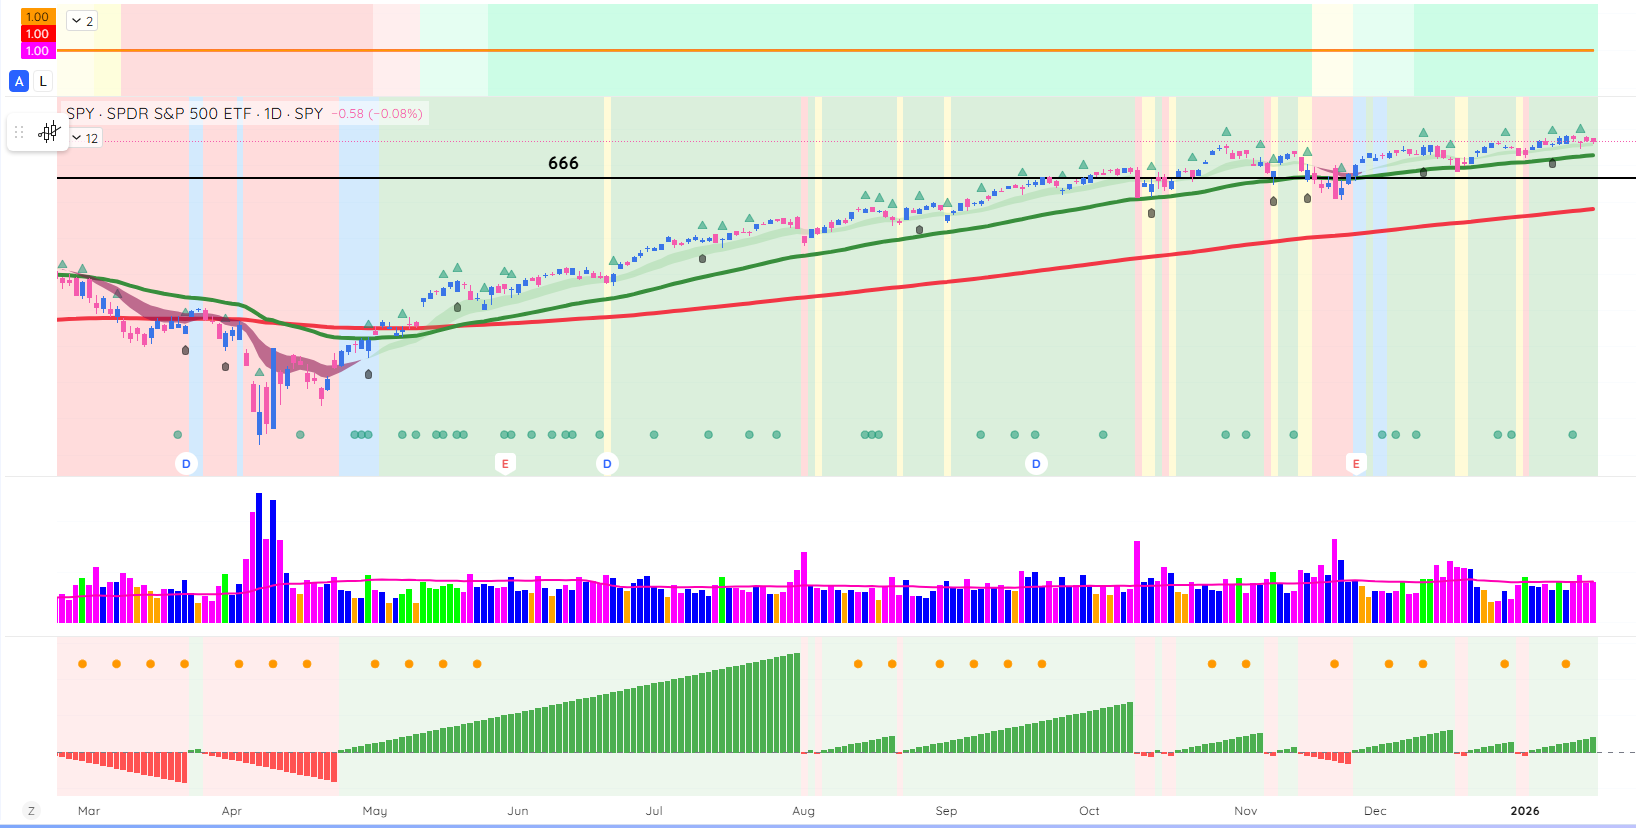
We are Green-Green-Green… Can’t deny the cycle.
In his 2015 Numberphile interview, Jim Simons described Renaissance Technologies as “100 percent model driven,” noting that success requires “religious sticking to the model” because human intuition can’t be reliably simulated or quantified.
Weekly- Relative Rotation Graph (RRG)
This chart provides a relative strength and momentum snapshot for all S&P sector ETFs against the SPY over the 5-week period.
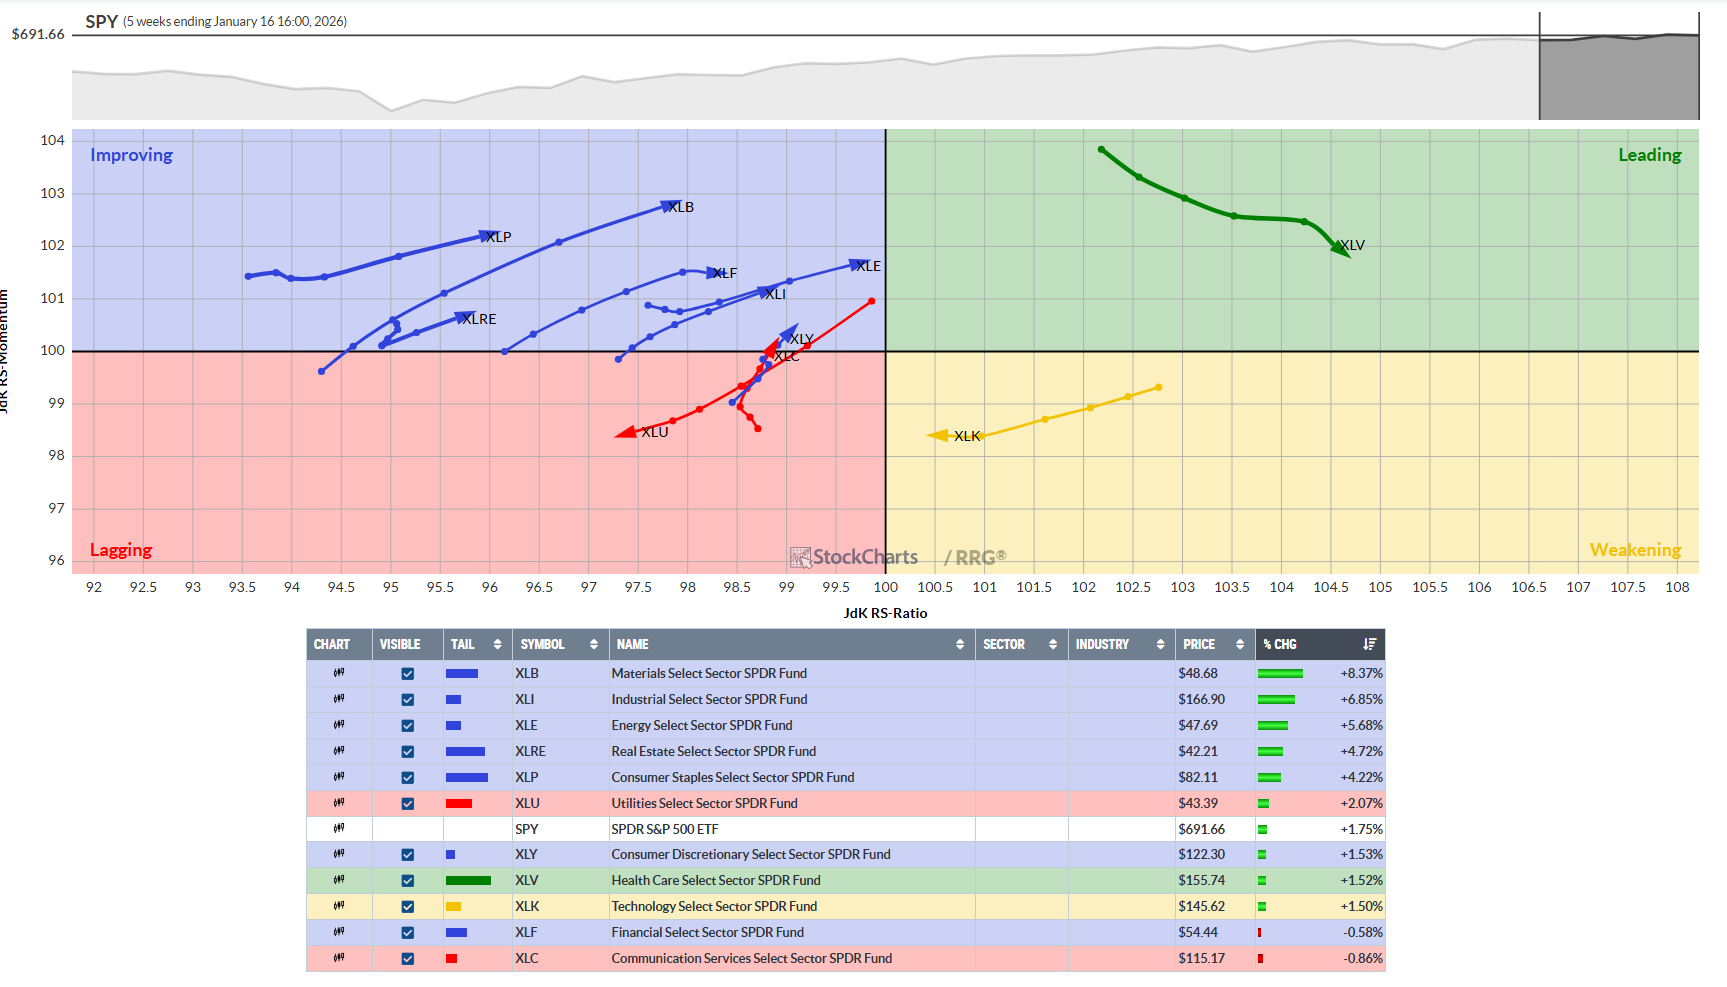
Defensives starting to show improvement. XLP Outperforming growth the past five weeks.
Before we look further at the S&P 500 sectors, let’s look at the offensive versus defensive chart below…
Trading implications
With both consumer and equal‑weight risk‑on/risk‑off ratios failing at resistance simultaneously, odds favor at least a pause in the pro‑cyclical trade and outperformance from staples/defensives in the short to intermediate term.
For swing positioning, this setup argues for tightening risk on high‑beta longs, favoring pullback entries only near clearly defined support, and selectively rotating into lower‑volatility, cash‑flow‑stable names or sector ETFs until these ratios can reclaim their broken channels or make fresh highs.
Growth versus Spy
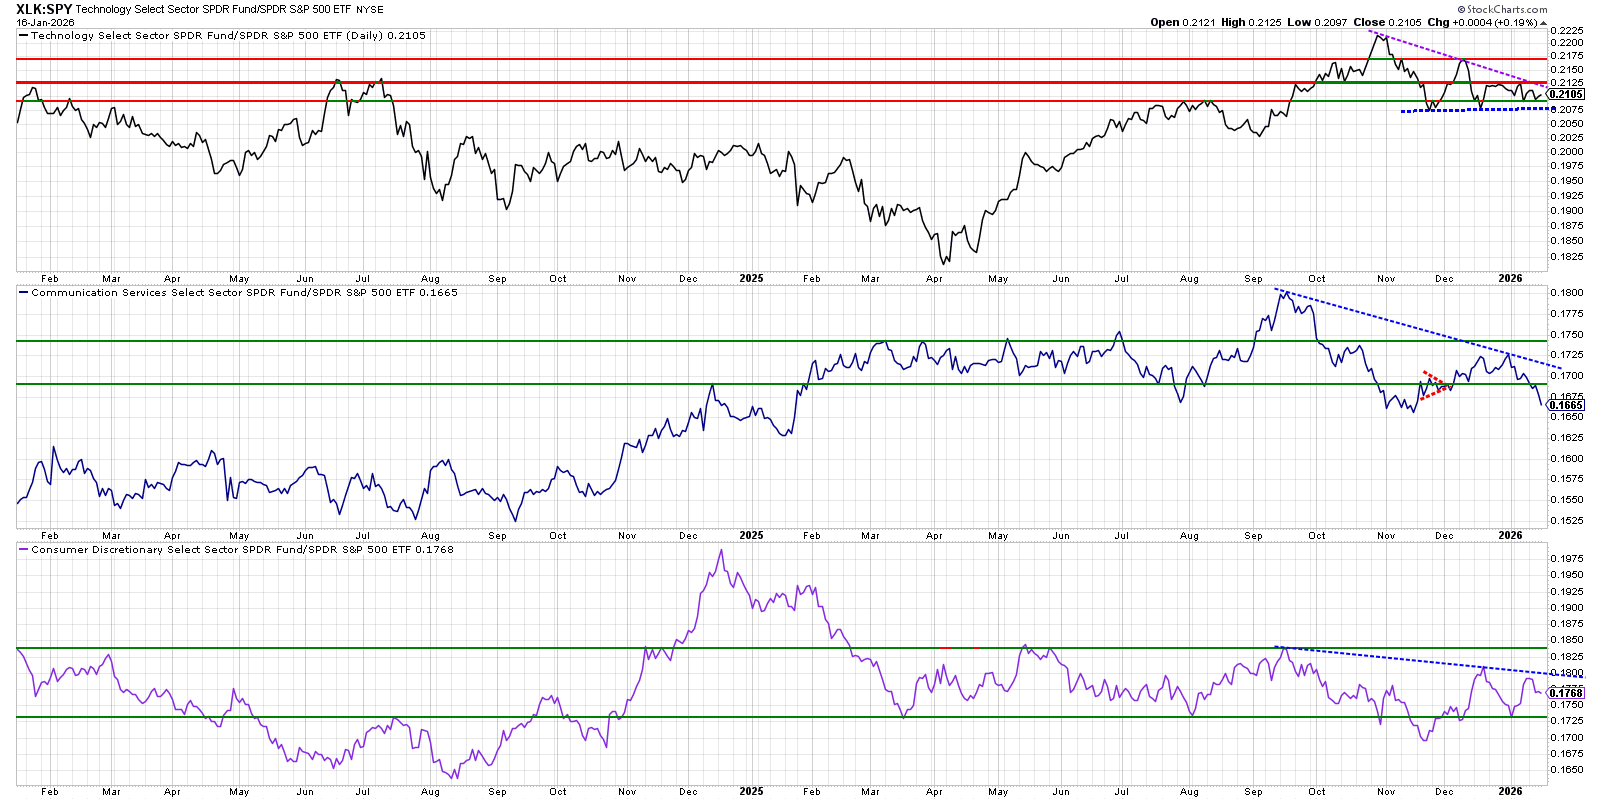
Cross‑sector read
Taken together, the charts show a maturing leadership profile: tech is still relatively strong but vulnerable to a topping process, while prior beta leaders (communications and discretionary) are in relative corrections versus SPY.
For swing positioning, that favors selectively leaning into XLK on pullbacks as long as its support band holds, while being more tactical or underweight XLC/XLY until their ratio downtrends vs SPY are broken with convincing breadth and volume.
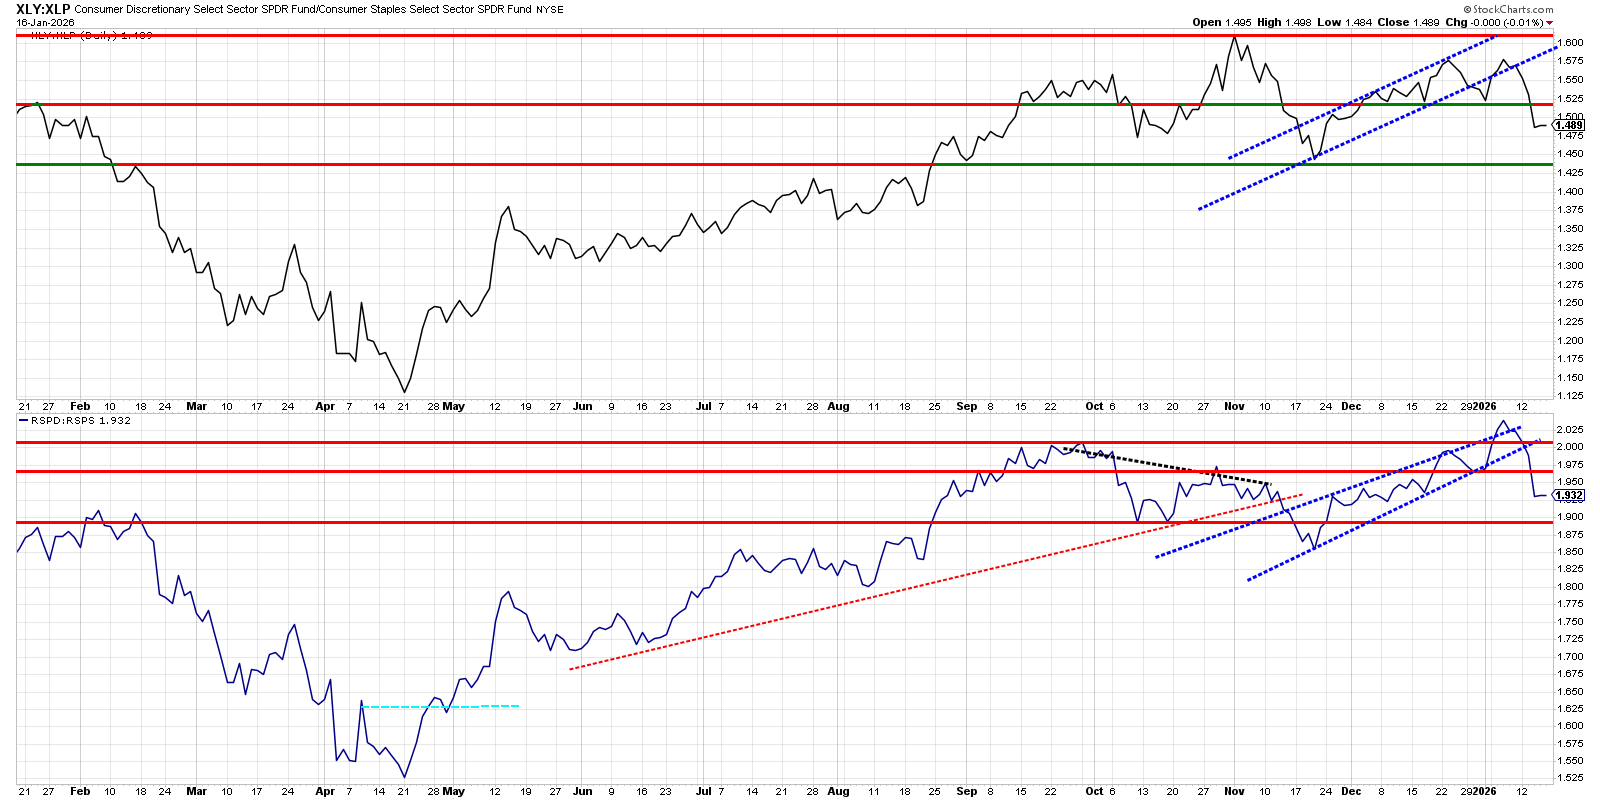
Value versus SPY
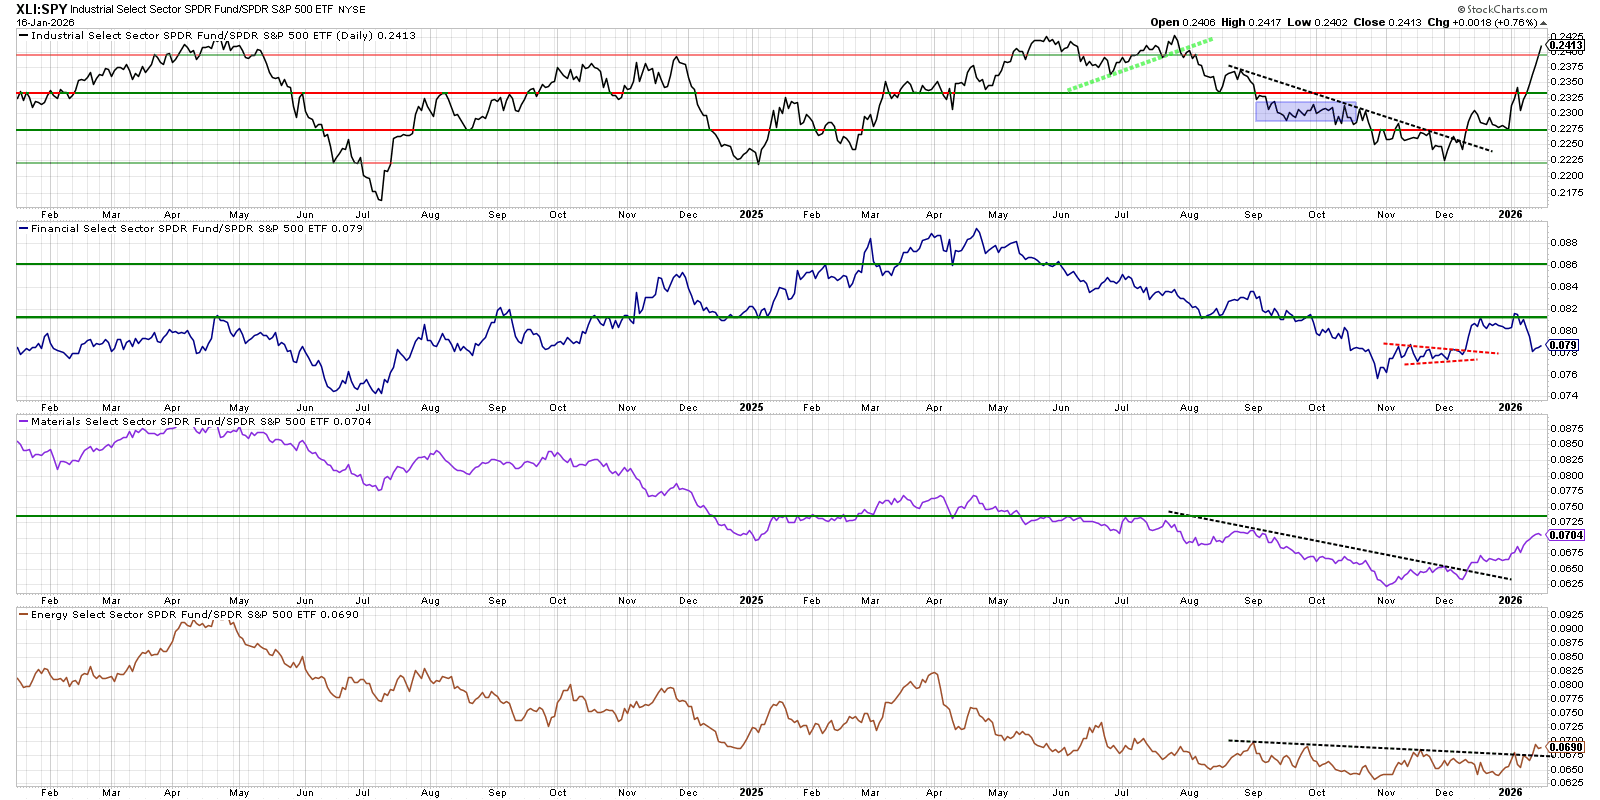
Trading implications
For swing allocations, Industrials look like the best candidate to overweight on pullbacks while the ratio holds above the broken downtrend and mid‑range support.
Materials and Energy are secondary ideas: watch for breakouts above their respective lower highs to justify rotation, while using Financials more selectively given their slide back into relative neutrality.
Defensives versus SPY
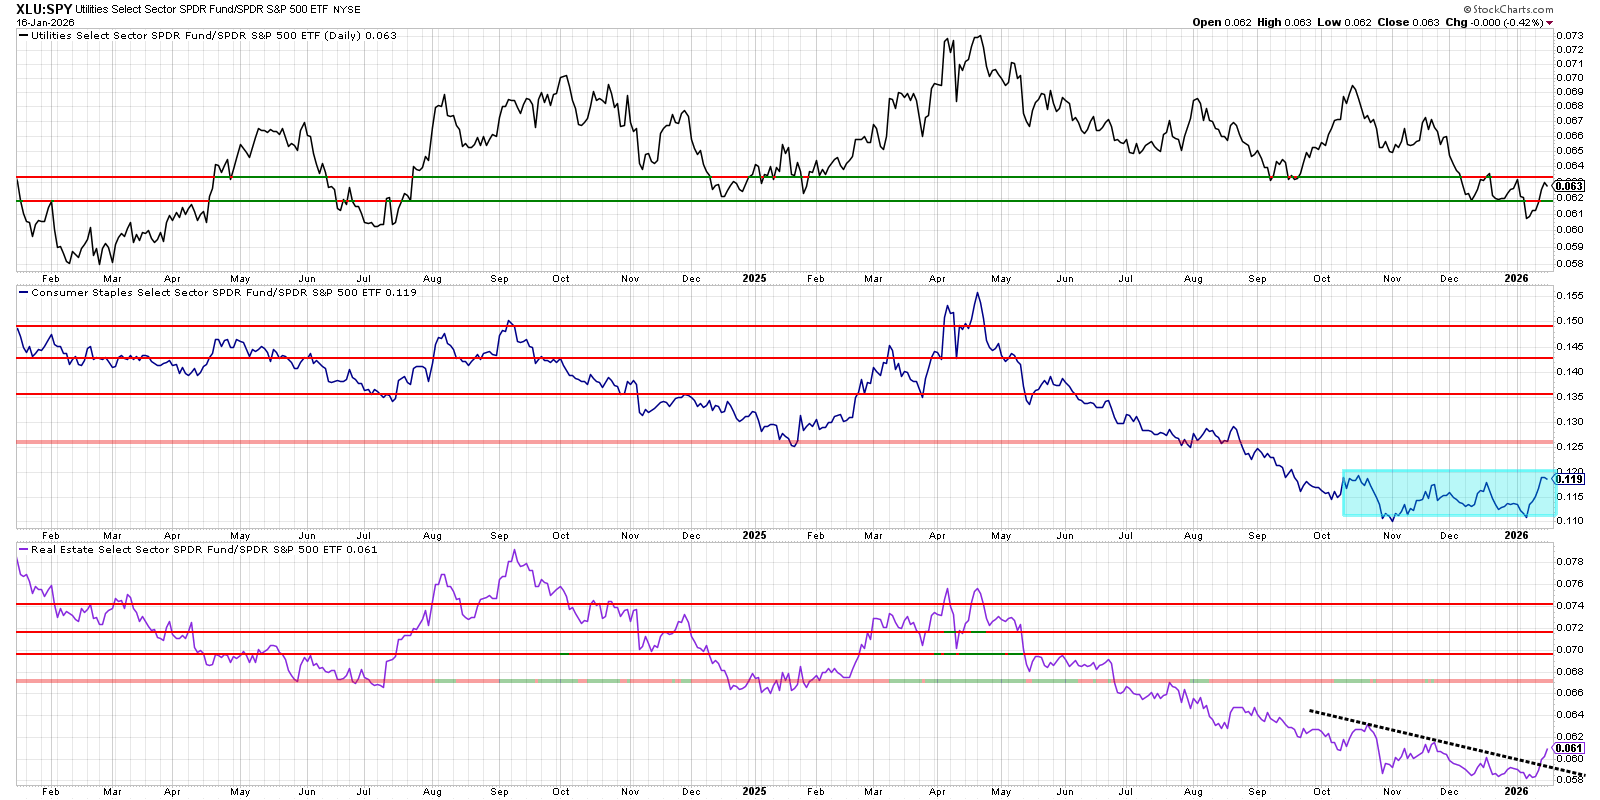
The chart shows all three defensives (Utilities, Staples, Real Estate) In different phases. Utilities at resistance, Staples attempting to base, and Real Estate trying to break a downtrend line and work up the right side.
Bullish Relative Rotation Graph (RRG) ETFs of note
Increasing velocity and pointed at the money angle
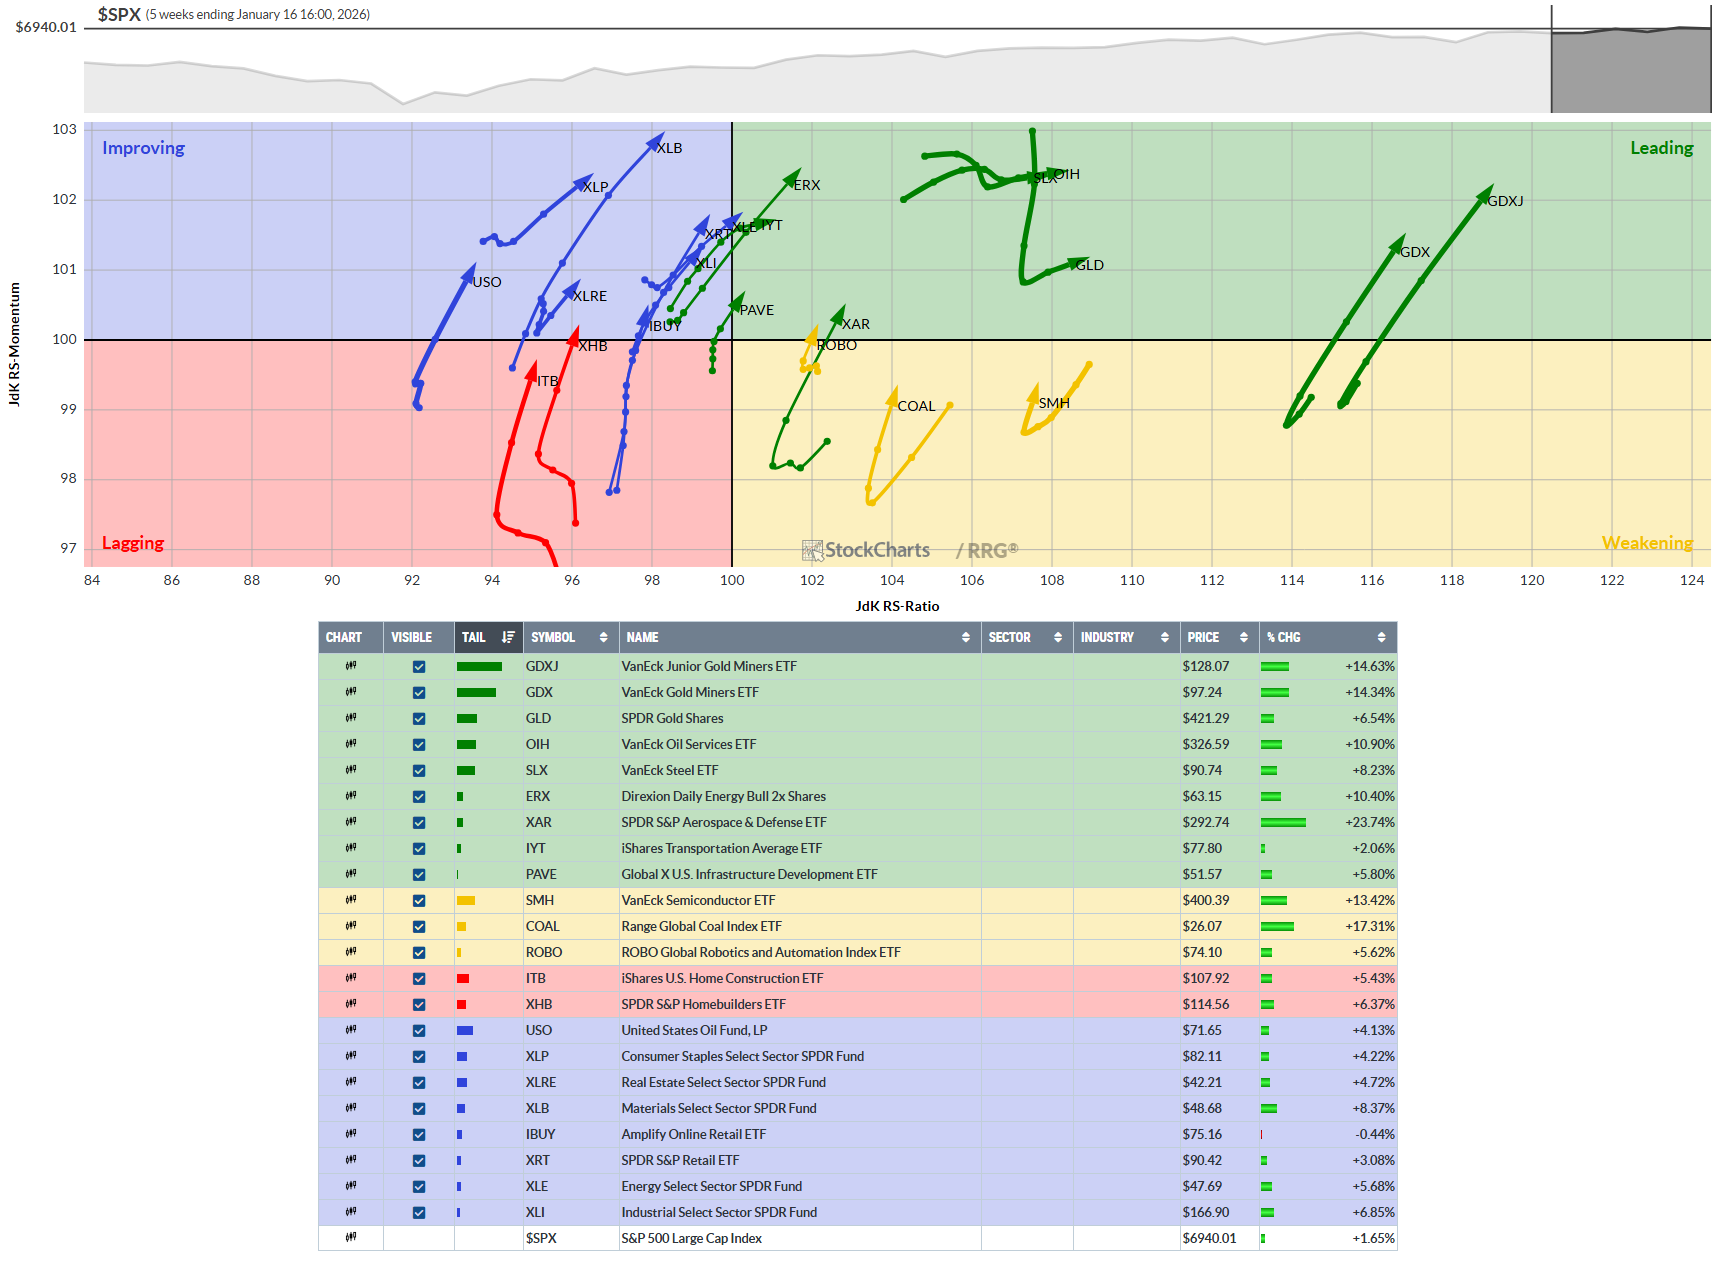
Bullish RRG Tickers: GDXJ, GDX, GLD, OIH, SLX, XAR, IYT, PAVE, SMH, COAL, ROBO, ITB, XHB, USO, XLP, XLRE, XLB, IBUY, XRT, XLE, XLI,
So, what are swinging?
Core swing themes to prioritize:
Metals/Miners: Metals & Mining, Steel, Copper, Gold/Silver – high RS Traderslab polygons plus strong Deepvue 1M–3M–YTD.
Autos / EV & Lithium/Battery – Auto Manufacturers, Lithium & Battery, and Electrical Energy Infra.
Semiconductors / AI hardware & Robotics – Semiconductors rank highly with Deepvue and appear through Autos, Robotics, and Energy‑infra Traderslab spiders.
Oil & Gas / Natural Resources – Oil & Gas and Natural Resources show strong 1M–3M–YTD and supportive spiders as well.
Themes to avoid or trade tactically: Software, Bitcoin/BTC miners, Casinos, and pure defensive Utilities remain weak and are outside the current leadership rotation. Why not bitcoin and BTC miners? Still in a stage four to me. Could be wrong and if I am, I’ll play a pullback.
Bullish Relative Rotation Graph (RRG) tickers
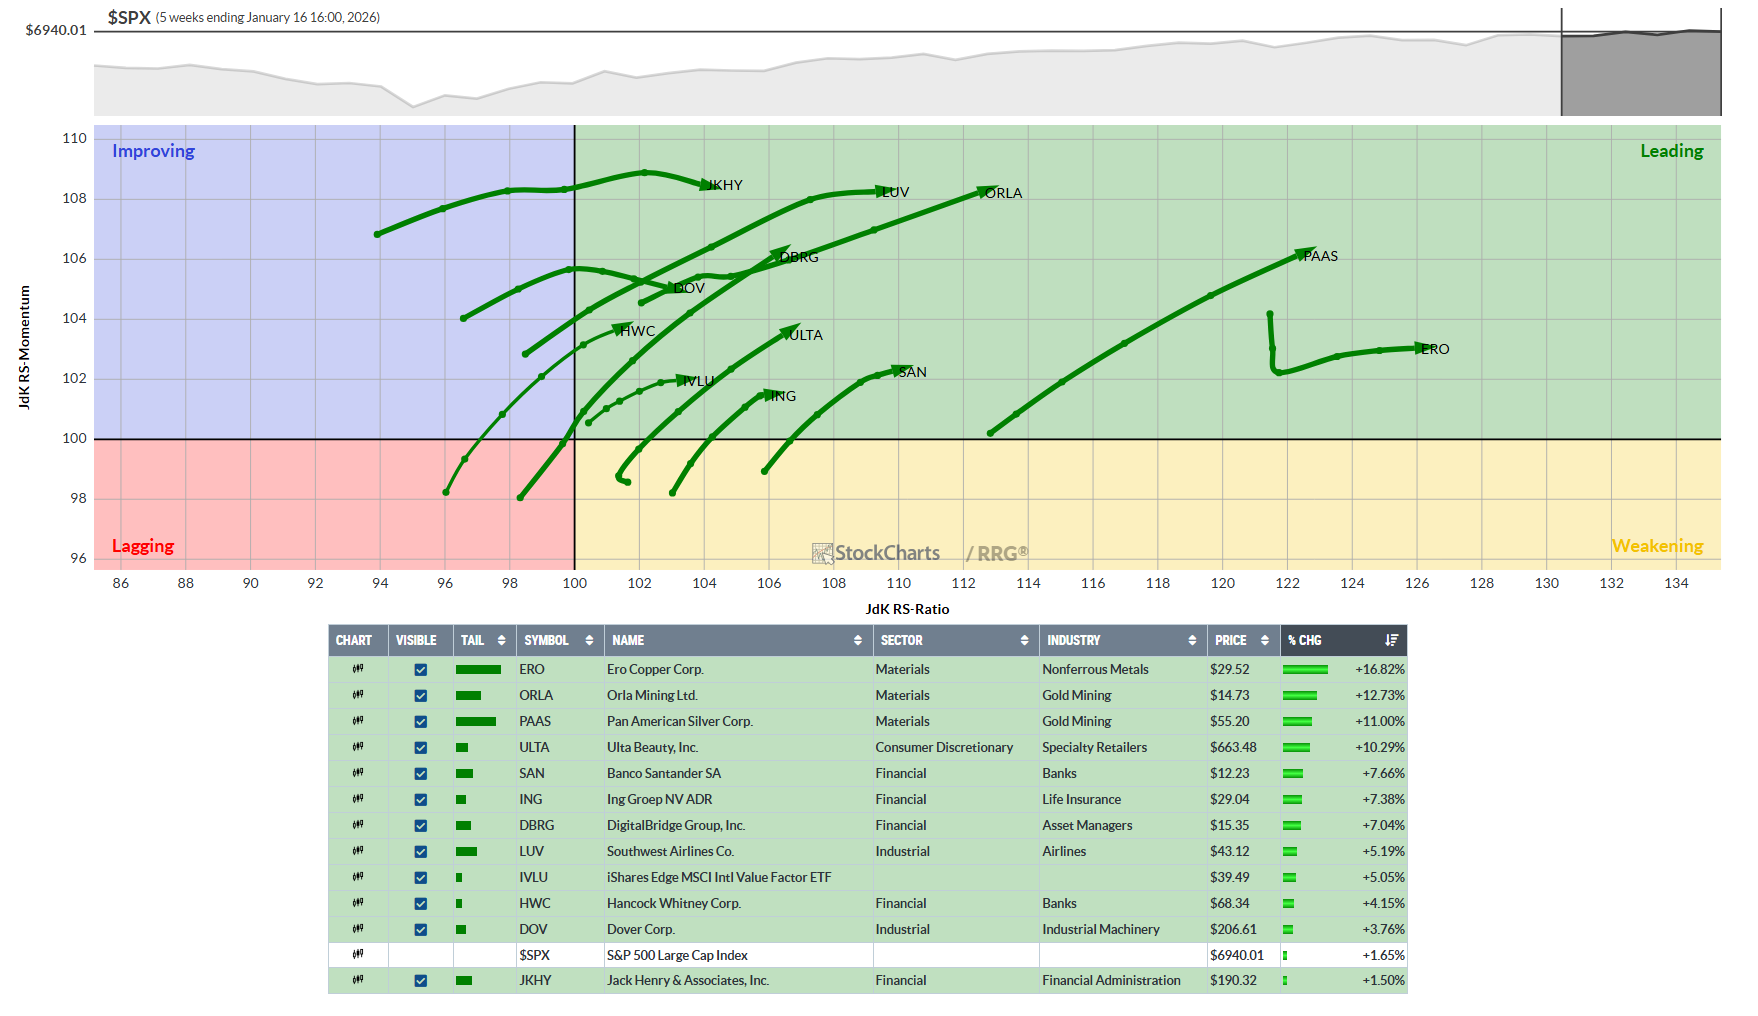
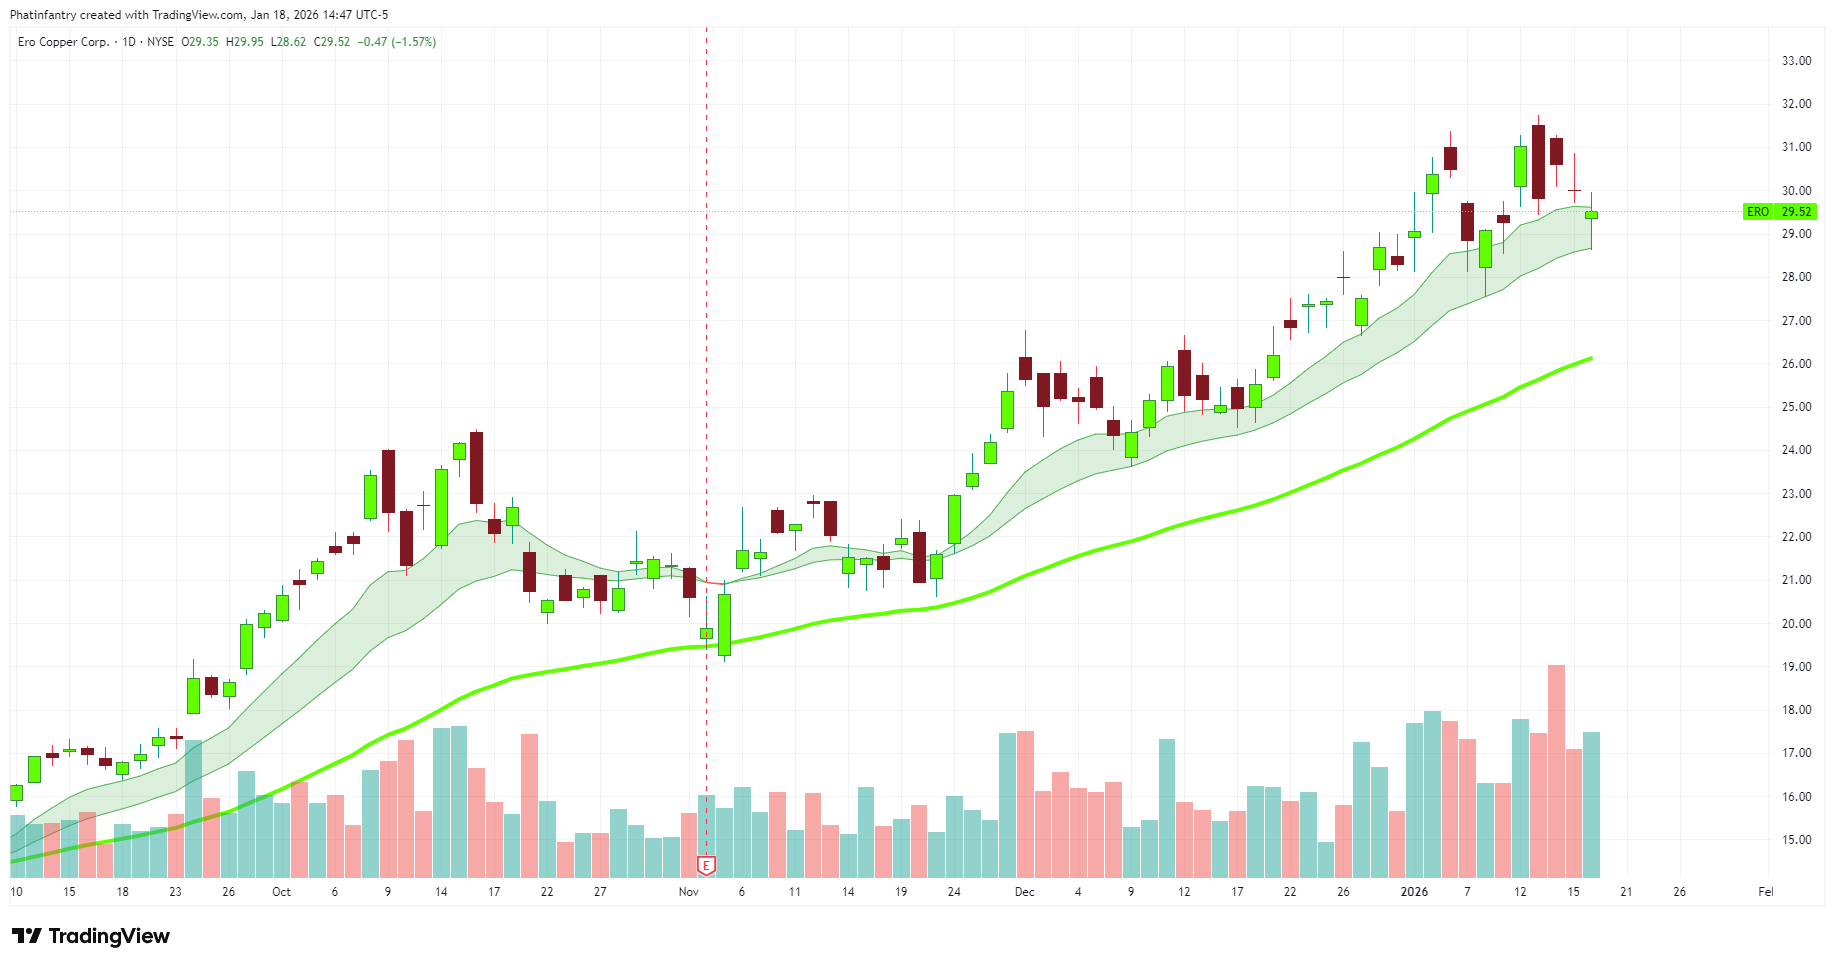
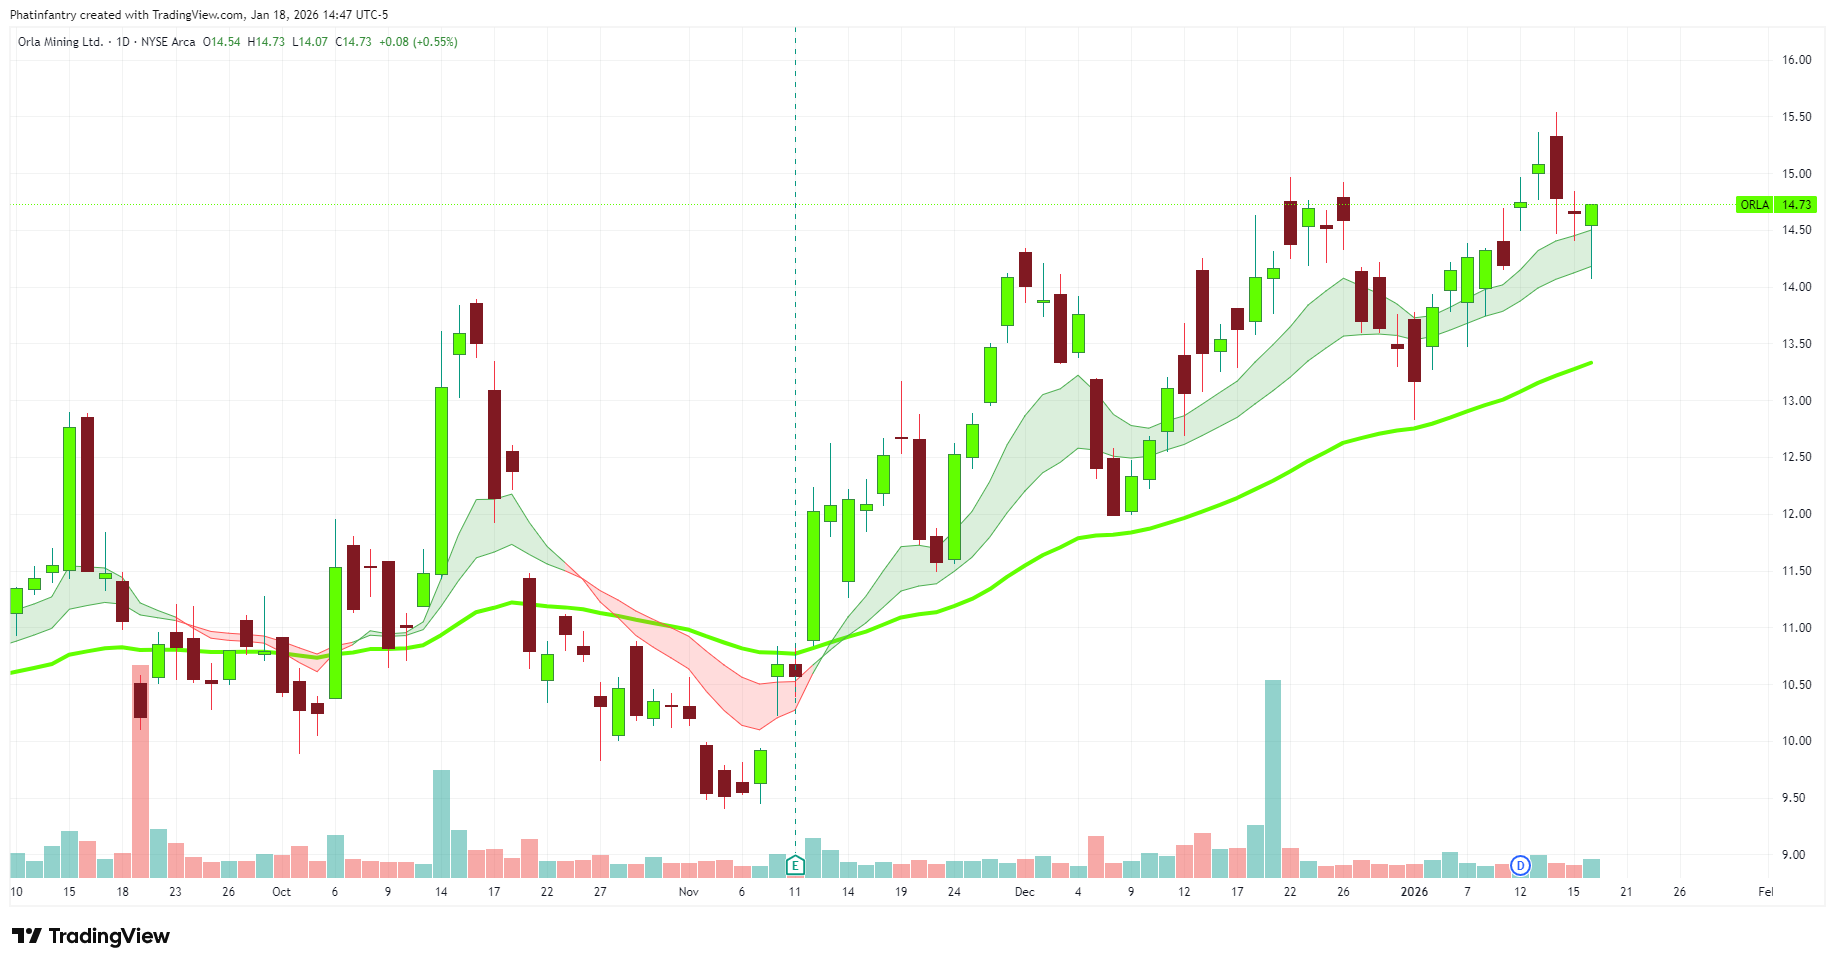
Tickers: ERO, ORLA, PAAS, ULTA, SAN, ING, DBRG, LUV, IVLU, HWC, DOV, SSPX, JKHY
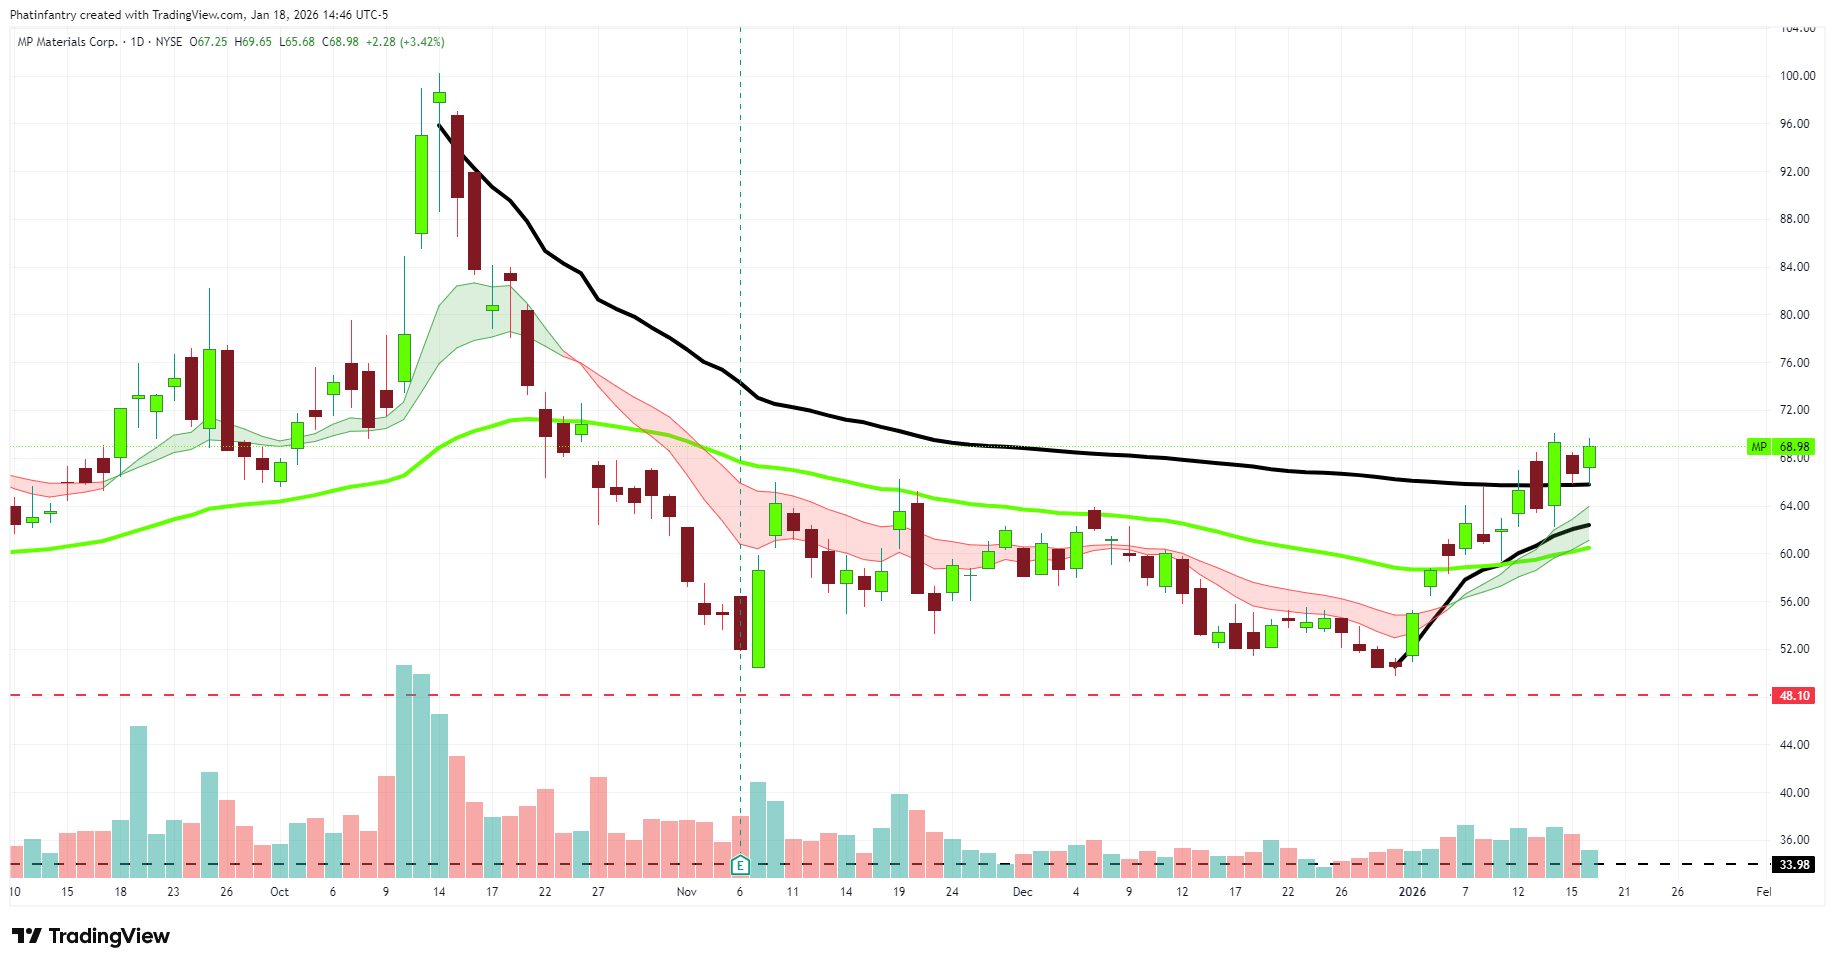
Setups for TUESDAY: MP, ERO, ORLA, PAAS, LUV

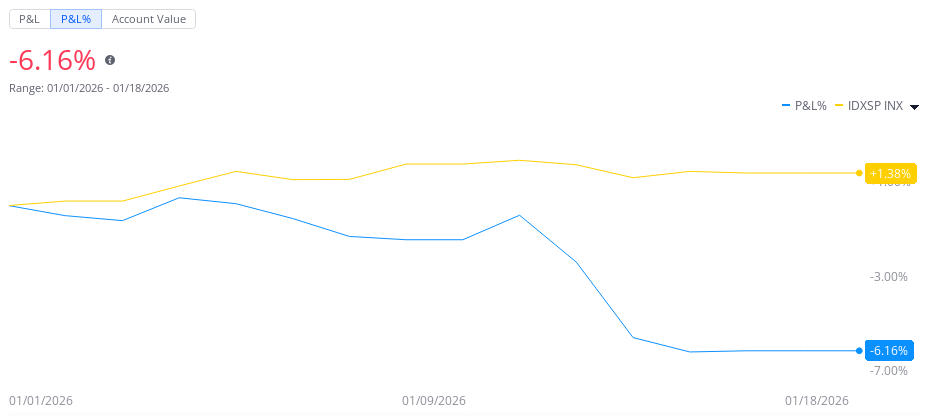
Thoughts this week: Well, that’s embarrassing… Down -6% YTD after swinging big at natural gas and not following the plan. Stopped out of PLAB which left me twice. It happens. The key is not letting it happen again…
You can do it, Keep Studying!
Most others don’t post their YTD because they can’t or frankly, they are lying. You better make sure, or you might lose it all…
Stock Talk Insiders discord
If you like this Phat Swing Plan, and you would like to receive alerts for my trades, click this link for the discord Stock Talk Insiders discord and enter the promo code: PHAT to get 10% off all packages for life...

Follow my alerts on Stock Talk Insiders discord Enter code: PHAT for 10% off
Follow my Phatstack for my Phat Swing Plan and updates during the week.
Follow me on X Phatinfantry Trading @Phatinfantry where I post/talk crap when I drink wine and make fun of dumb things.
Follow me on YouTube where I go through my process and review charts Phatinfantry
Great Stuff.