
Phat Swing Plans and Observations
For the week of 11/23/25


Market Summary for the week
U.S. markets ended a volatile week with gains on Friday, but all the major indices closed the week with losses as AI valuation worries, delayed economic data, and shifting Federal Reserve expectations weighed on sentiment.
Major Index Performance
The S&P 500 declined about 2% for the week, rebounding nearly 1% on Friday but still logging its biggest weekly drop since March.
The Nasdaq Composite fell further, down 2.7%, with technology stocks leading the decline amid persisting anxiety over an “AI bubble” and aggressive spending in tech.
The Dow Jones Industrial Average decreased 1.8% this week, similarly bouncing on Friday with a near-500-point gain.
Key Drivers
Tech pullback: Mega-cap technology and semiconductor names including Nvidia, Advanced Micro Devices , and Broadcom traded sharply lower after initial optimism post-earnings gave way to valuation and sustainability concerns.
Macroeconomic backdrop: The resumption of delayed federal economic reports after the government shutdown injected new volatility, with investors digesting mixed labor and inflation data.
Defensive strength: Consumer staples and health care outperformed, while energy and discretionary stocks lagged behind.
Notable Moves
Nvidia initially jumped on strong earnings and guidance, but losses followed on Friday as market fears around the sustainability of AI-driven growth persisted.
Tesla fell nearly 5% in response to the board’s reapproval of its CEO pay package and renewed concerns about dilution and the challenges facing its core auto business.
Walmart rallied 6.5% after a strong earnings report, with value-based retail continuing to attract consumers trading down.
Eli Lilly surged past a $1 trillion market capitalization milestone as growth in its pharmaceutical pipeline and GLP-1 segment drove health care momentum.
Broader Themes
Crypto continued to slump, with Bitcoin nearing technical support levels below $80,000 as digital assets weaken.
Volatility remained elevated, driven by options expiration and the clash between stale government data and real-time corporate results.
Markets remain highly sensitive to any signals from the Federal Reserve about the path of interest rates, and asset rotation favored defensive sectors over cyclicals as the year heads into its final stretch.
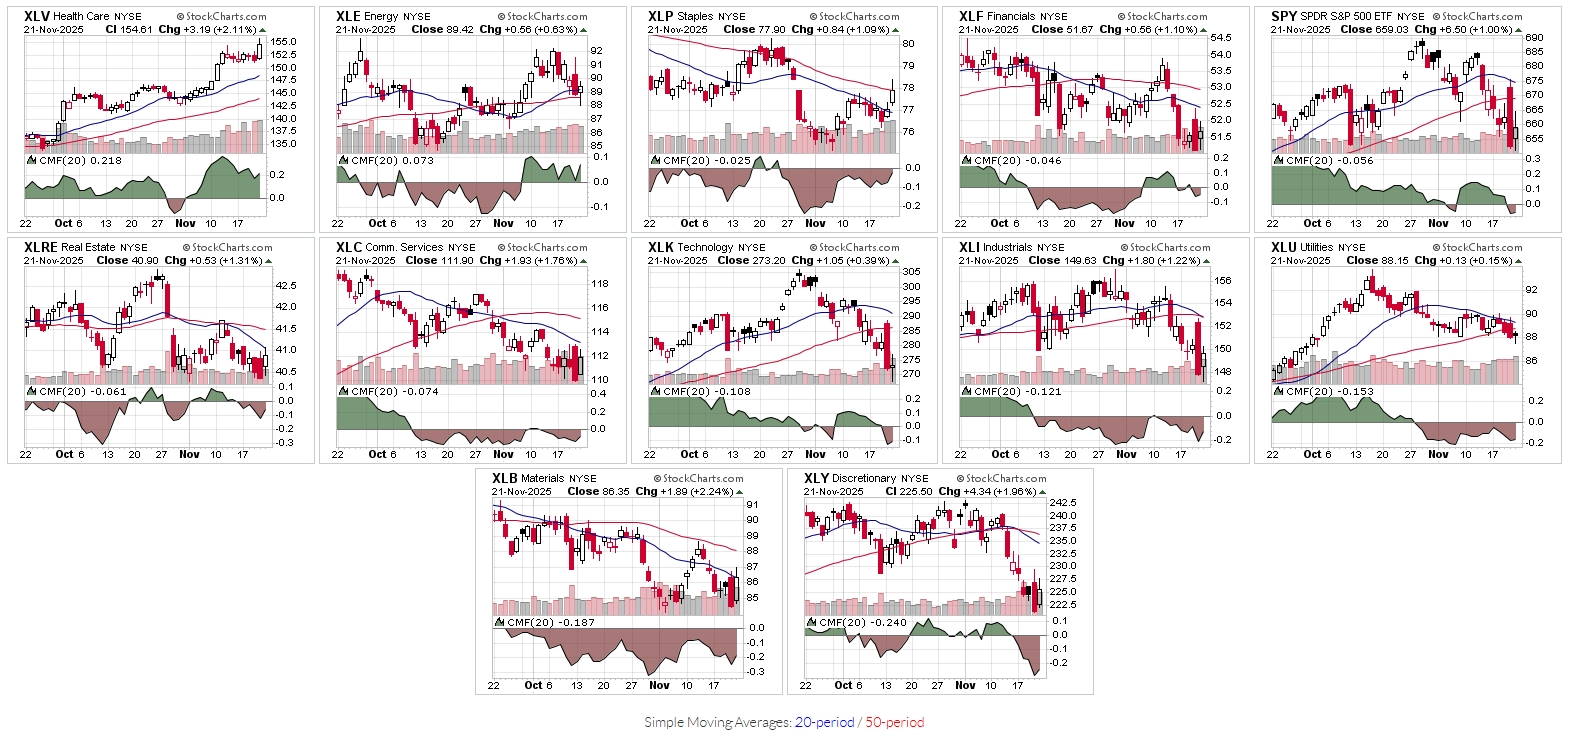
Sector Overview
Health Care and defensive areas outperformed this week, while Technology, Energy, and other growth/cyclical sectors led the downside as money rotated away from crowded AI and high-multiple plays into more stable earnings and defensives.
Sector Leaders
Health Care was the clear leader, up roughly 1.8–1.9% on the week, benefiting from defensive flows and strong fundamentals.
Communication Services and Consumer Staples also finished positive, with Communication Services up about 1.4–3% and Staples around +0.8%, reflecting a tilt toward steady cash-flow sectors.
Utilities showed relative strength as well, one of the few sectors green on some of the heavier down days, consistent with the defensive bid as rates expectations wobbled.
Sector Laggards
Technology was the primary laggard, down roughly 4.8–5.2% for the week, as profit-taking and AI-bubble fears hit mega-cap and semiconductor names hardest.
Energy dropped around 2.8–3.1%, pressured by weaker oil sentiment and rotation away from cyclicals even as some value managers added selectively on the pullback.
Financials also traded heavy on several sessions, participating in the broad risk-off move as markets repriced Fed and curve expectations, even though some commentary flags medium-term rotation potential into banks and insurers.
Rotation / Style Takeaways
The week reinforced an ongoing rotation theme: capital moving out of AI/growth beneficiaries in Information Technology, Industrials, and related areas and into value-oriented and defensive groups like Health Care, Consumer Staples, and parts of Energy and Materials.
Only 3 of 11 S&P 500 sectors finished green, underscoring that this was more about factor/sector rotation within an overall risk-off tape rather than a broad risk-on advance.
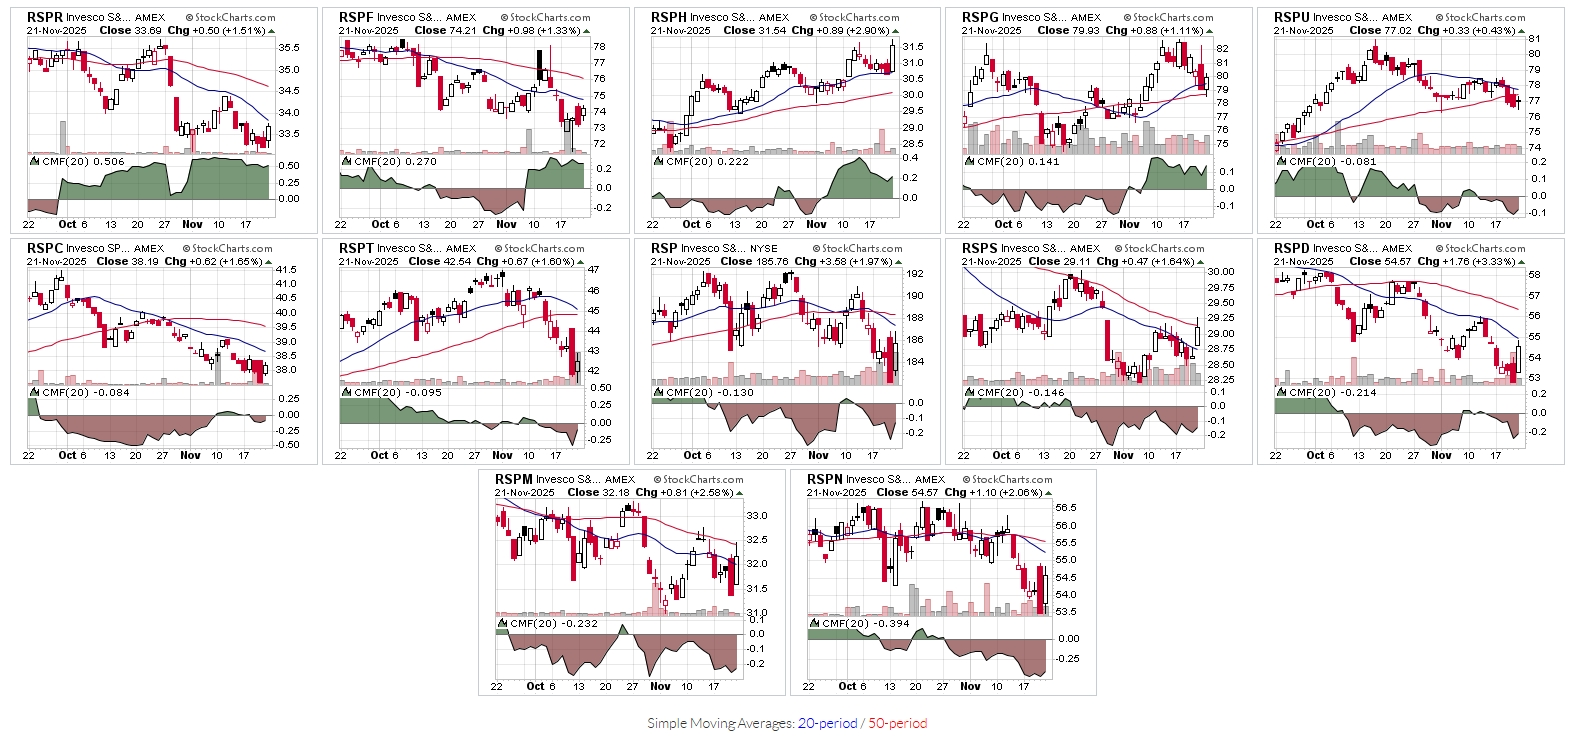
Small caps (via the Russell 2000 ) outperformed large-cap growth on a relative basis, highlighting some bid for value and domestic cyclicals even as headline indices were red for the week.
Key Market Themes
Key U.S. market themes this week included the moderation of the artificial intelligence trade, a sharp sector rotation into defensives, and renewed scrutiny of high valuations in tech and energy.
AI Bubble / Tech Valuation Concerns
Soaring valuations in leading AI stocks such as Nvidia and other mega-cap techs have led to persistent fears of speculative excess, with some analysts now openly discussing similarities to previous bubbles as these stocks began to correct despite strong earnings.
This week, the failure of AI-levered companies to rally even on positive news highlighted concerns that enthusiasm might be outpacing the underlying technology’s near-term earnings impact.
Evidence suggests that while long-term tailwinds for AI infrastructure remain, investors are increasingly focused on “real demand” and business model durability over hype-driven price action.
Sector Rotation and Defensive Shift
There was pronounced capital rotation from cyclical growth sectors—Information Technology, Energy, and some Industrials—into defensive segments like Health Care, Utilities, and Consumer Staples.
Defensive names attracted funds on relative safety and stable earnings, while previously crowded leadership sectors experienced profit-taking.
This rotation is underpinned by growing caution regarding macro headwinds and extended valuations, and the possibility of impending Fed rate cuts further supporting traditionally defensive assets.
Fragile Market Leadership, Froth, and Concentration
A handful of large-cap stocks have driven most 2025 gains, creating concerns about fragile market breadth and heightened sensitivity to negative headlines for these “market generals”.
Despite earnings resilience from major banks and selected consumer segments, a sense of late-cycle behavior persists, with market leadership narrowing and investors seeking diversification beyond just technology and “Magnificent Seven” names.
Additional Noteworthy Themes
Persistent volatility and intraday swings are being caused by portfolio rebalancing, options activity, geopolitical headlines, and discrepancies between government and real-time private data.
Market participants are weighing how much further equity indexes like the S&P 500 , Nasdaq Composite , and Russell 2000 can run amid narrow leadership, macro risks, and looming monetary policy shifts.
Altogether, the market is increasingly focused on earnings quality, tangible profits, and risk mitigation as excitement over AI and other speculative drivers meets valuation and macroeconomic reality.
Sectors sorted by Chaikin Money Flow Weighted:
Sectors sorted by Chaikin Money Flow Equal Weight:
The StockCharts Technical Rank (SCTR)
Proprietary ranking score (0-100) by Stockcharts.com that evaluates a stock or ETF’s technical strength compared to its peers, using a blend of multiple timeframes and momentum metrics.
Interpretation and Use
Top 10%: SCTR scores 90–100 indicate strong technical leaders.
Middle Range: Scores between 40–60 represent average technical strength.
Bottom 10%: Scores 0–10 indicate technical laggards.
Scores above 60 generally signal relative technical strength, while scores below 40 highlight weakness.
SCTR is best used for peer comparisons and screening for momentum, rather than as a standalone trading/signal tool.
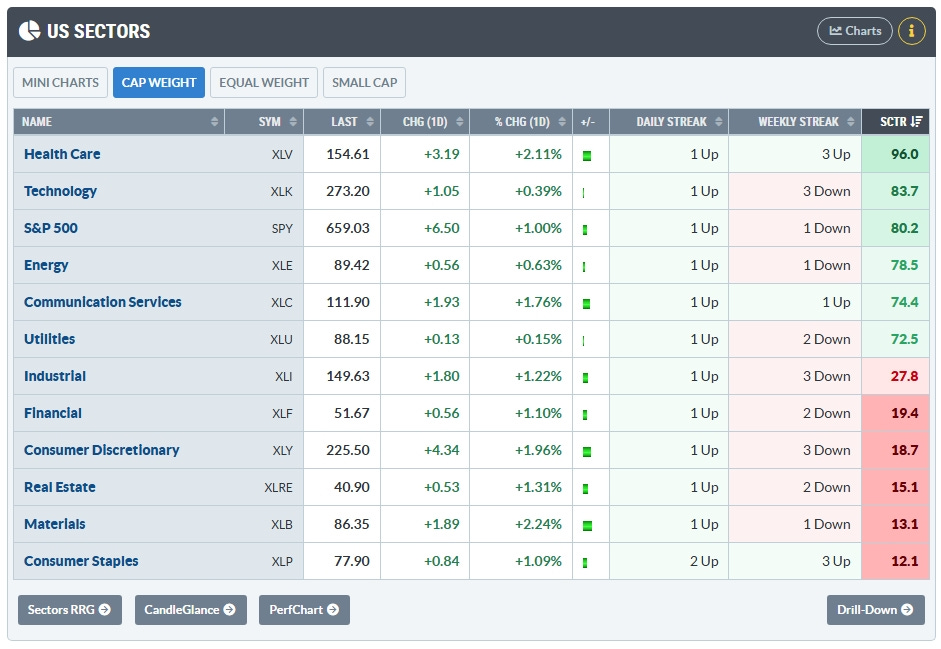
Health Care has overtaken Technology with a SCTR score of 96
Major U.S. Economic Events
This is a roundup of last week and this week now that we are back open as a government…
Major U.S. economic events this week centered on the effects of the government reopening, the resumption of delayed data releases, and continued debate over Federal Reserve policy amid labor market uncertainty and persistent inflation risks.
Government Reopening and Data Backlog
After the longest shutdown in U.S. history, the federal government resumed operations, prompting the release of a substantial backlog of economic reports, including employment and inflation data that had been postponed.
The Bureau of Labor Statistics began publishing the September jobs report on November 20, with additional releases on retail sales, wholesale inflation, and trade data trickling out throughout the week.
The Bureau of Economic Analysis adjusted its release schedule for third-quarter GDP and corporate profits, as well as October personal income and outlays—meaning investors are still catching up on key macro data.
Federal Reserve Policy and Rate Cut Debate
The Federal Reserve signaled caution on further rate cuts, following a 25 basis-point reduction in October to 3.75%–4.00%. Fed Chair Jerome Powell indicated that an additional cut at the December meeting was “not a foregone conclusion,” and published meeting minutes revealed substantial internal disagreement.
Market participants recalibrated expectations for future policy, with chances of a December rate cut dropping to about one in three and January probabilities rising to two in three, reflecting the committee’s ongoing debate.
The Fed also agreed to halt the reduction of its securities holdings starting December 1, ending the quantitative tightening process as policymakers balance inflation and employment mandates.
Economic Calendar Highlights
Key macro reports released or scheduled for release included the Empire State Manufacturing Index, Industrial Production & Capacity Utilization (October), Housing Starts/Building Permits, and FOMC meeting minutes.
Upcoming reports announced due to the backlog featured the Producer Price Index, retail sales figures, and updates on construction spending, manufacturers’ shipments, and international trade.
Holiday-shortened trading and earnings releases from major retailers like Lowe’s, Target , and Walmart also shaped market sentiment ahead of Thanksgiving.
This week’s economic narrative is defined by efforts to process missing data, divergent Fed perspectives, and anticipation of how labor and inflation trends will guide interest rate decisions into year-end.
Key economic releases and events for the upcoming week (November 24–29, 2025) in the U.S. are scheduled as follows, taking into account the Thanksgiving holiday’s impact on market hours:
Economic Reports: Dates & Times
Monday, November 24
S&P Case-Shiller Home Price Index (Sep): 9:00 AM ET
Chicago Fed National Activity Index (Oct): 8:30 AM ET
Retail sales advance (delayed release): 8:30 AM ET
Tuesday, November 25
Conference Board Consumer Confidence (Nov): 10:00 AM ET
Richmond Fed Manufacturing Index (Nov): 10:00 AM ET
Wednesday, November 26
Durable Goods Orders (Oct): 8:30 AM ET
Initial Jobless Claims: 8:30 AM ET
Pending Home Sales (Oct): 10:00 AM ET
Federal Reserve Beige Book: 2:00 PM ET
New Home Sales (Oct): 10:00 AM ET
Thursday, November 27
Markets closed for Thanksgiving Day
Friday, November 28
Early market close (1:00 PM ET); no major economic data releases
Earnings Announcements
Major companies including Dell Technologies , HP , John Deere , and Alibaba have earnings releases scheduled throughout the week, generally pre-market or after the close on corresponding days.
Tuesday, November 25: DELL, HPQ, BABA
Wednesday, November 26: DE
With several key macro data points compressed into the first three trading days and earnings from major technology and retail firms, traders should watch for heightened volatility and market moves particularly before the holiday break
Deepvue Market Themes
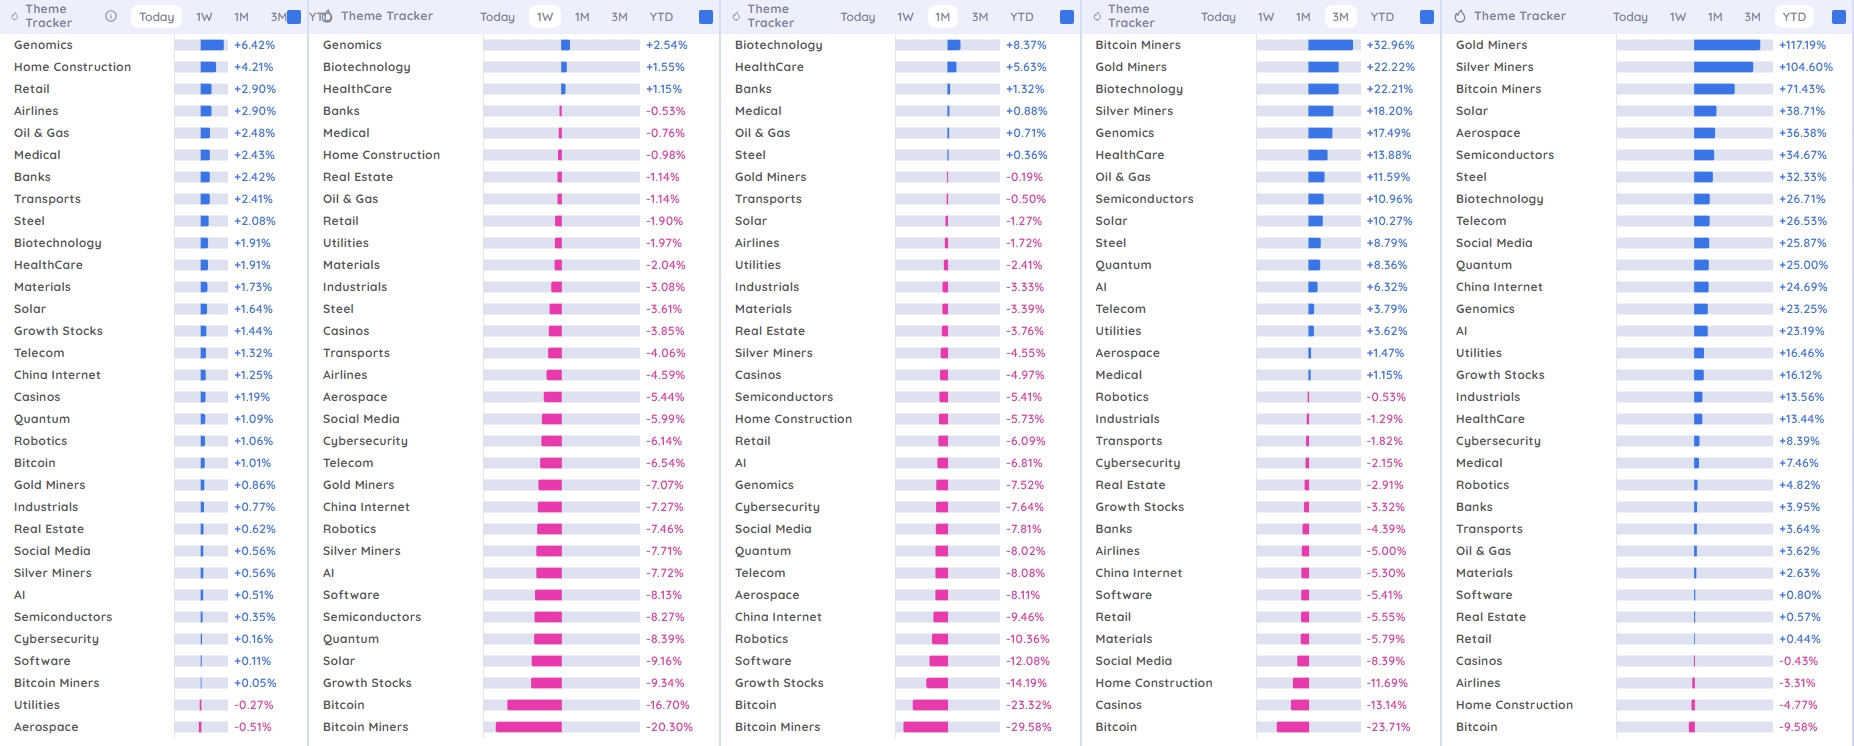
Tactical Insights for Swing Traders
Short-term traders may focus on biotech and genomics today for momentum; Bitcoin Miners and Gold/Silver Miners retain the hottest medium- and longer-term momentum.
Bitcoin and Bitcoin Miners are notably volatile, ranking top in 3M and YTD but bottom in 1M and 1W—this suggests trend reversals or pullbacks are common, favoring aggressive mean-reversion swing setups.
Emerging tech and disruptive sectors (AI, Quantum, Semis, Genomics) remain attractive for swing or breakout setups, especially with positive 3M and YTD momentum.
Weaknesses in Home Construction, Airlines, and Casinos YTD could favor short-side or hedging opportunities.
TradersLab.io Themes
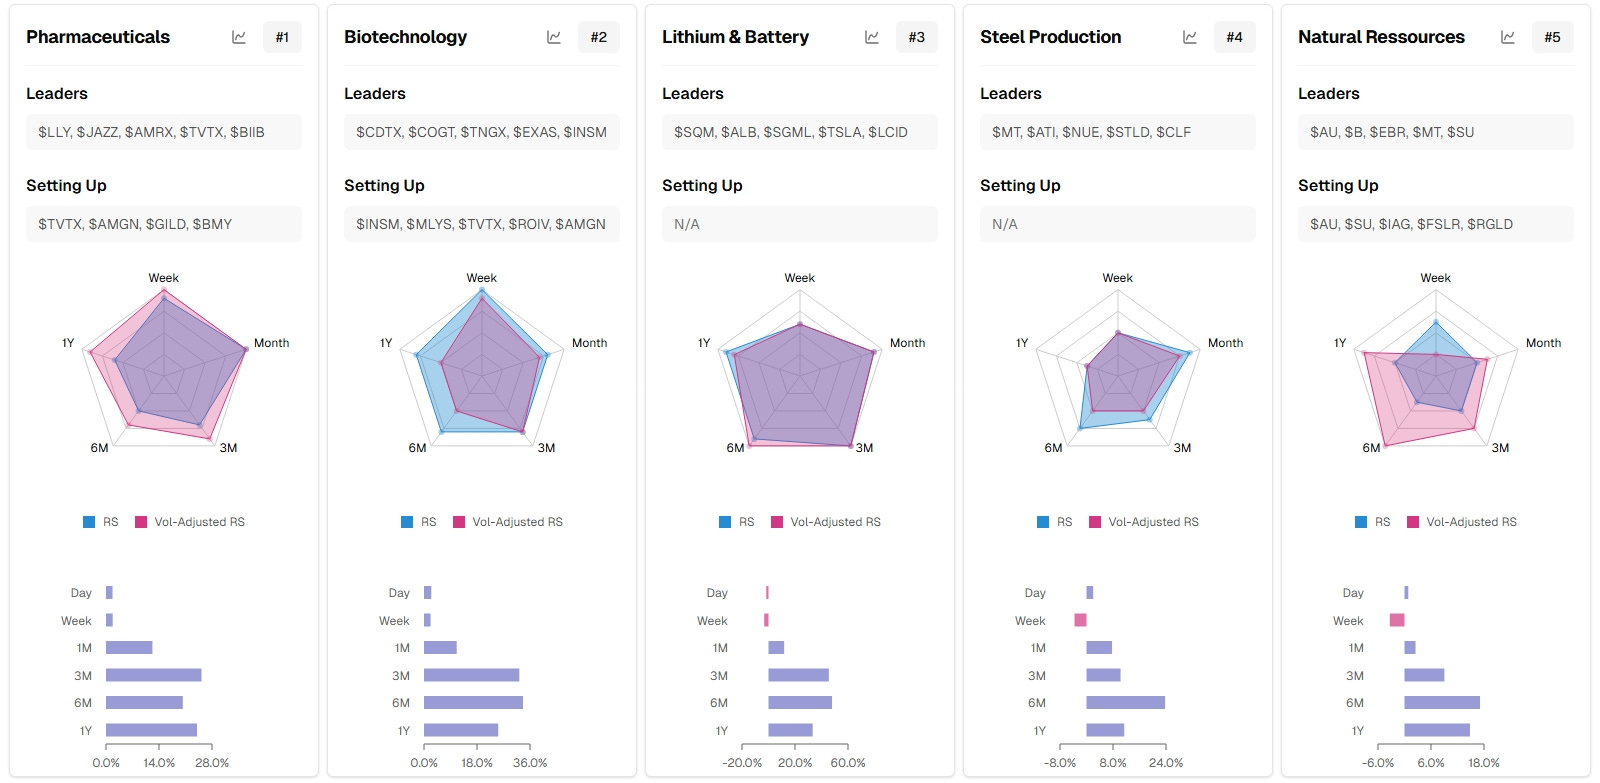
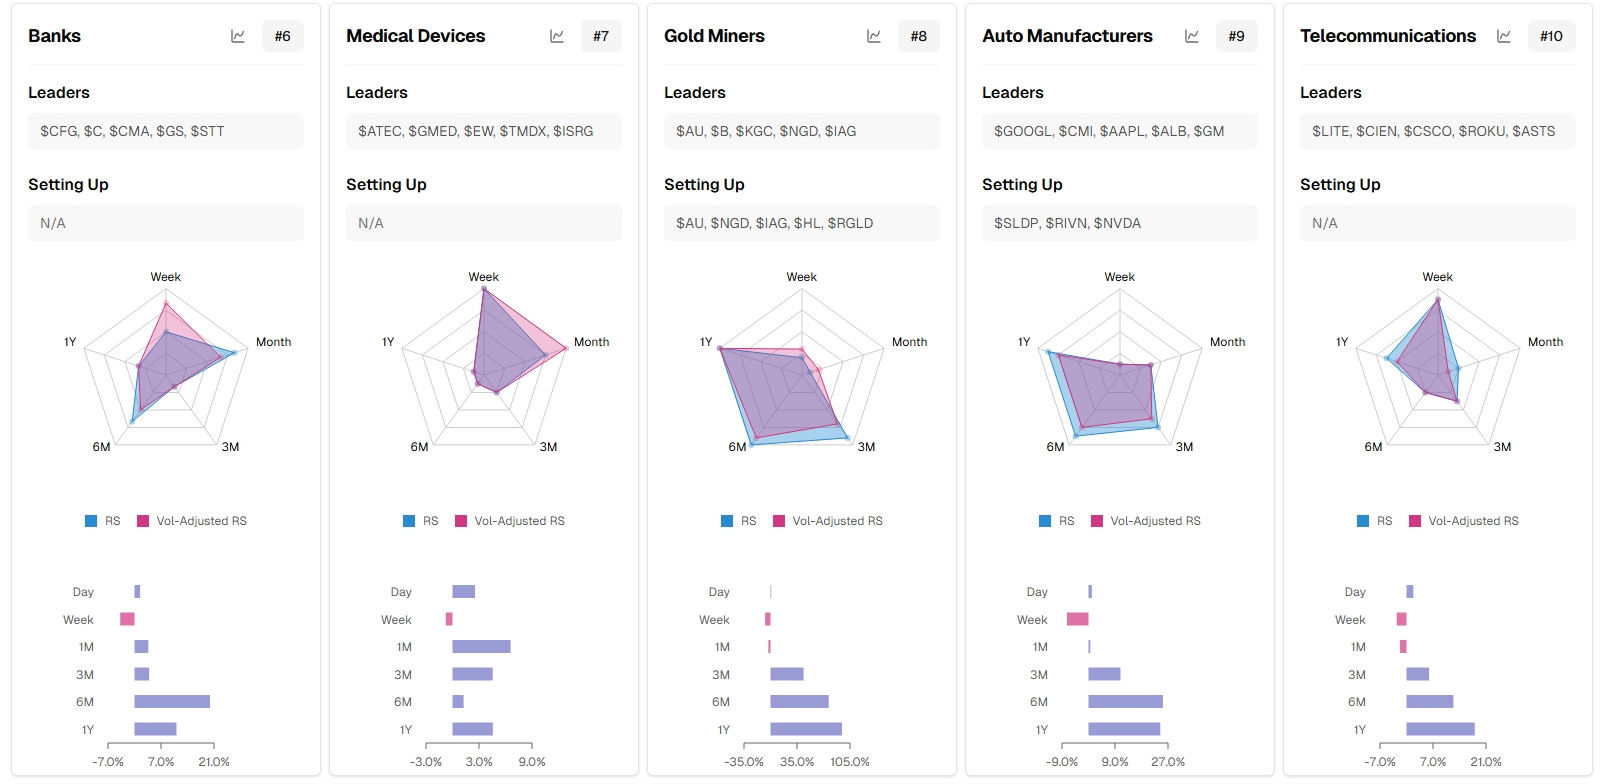
General Insight:
Sectors like Pharmaceuticals and Biotechnology appear to be strong leaders currently with good momentum.
Natural Resources and Lithium & Battery sectors exhibit healthy long-term relative strength, fitting potential themes around energy/materials.
Banks and Gold Miners show somewhat mixed signals indicating possible consolidation or rotation phases.
Auto Manufacturers and Telecommunications may be setting up for moves but are relatively less strong compared to other sectors.
Market Carpet for the week
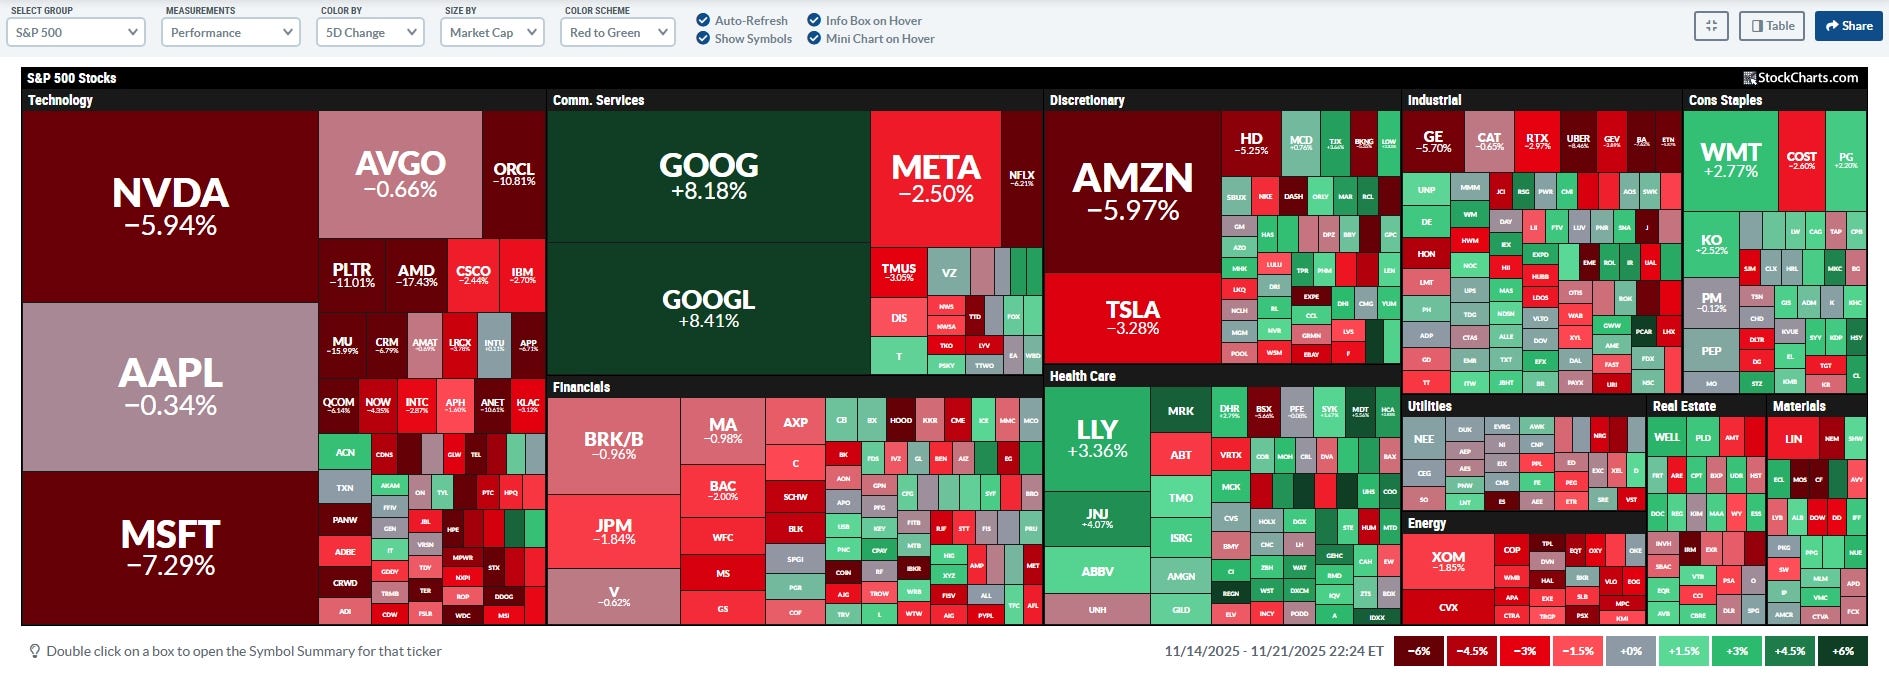
Breadth and Technical Themes
Mega-cap tech was broadly weak, contributing major drag on indices, but Alphabet (GOOG/GOOGL) provided large upside counterweight.
Defensive sectors (consumer staples, health care) saw significant flows and outperformance, characteristic of risk-off rotation.
Discretionary and industrials showed notable weakness, likely affected by macro concerns or earnings disappointments.
The overall market breadth was negative as most sectors had a majority of stocks declining over the 5-day period, with only a few sectors staying positive.
Swing Trading Notes
The sharp reversal in big tech and semis signals increasing volatility; caution is warranted on tech swing positions, but large reversals may set up fast bounce days if breadth flips intraday.
Strength in Google and defensive sectors like staples/healthcare may suggest tactical shifts for short-term swing setups, particularly if risk preferences pivot back toward cyclicals or growth after this pullback.
Unusual outperformers (like JNJ, LLY, WELL, WMT) may offer relative strength swing setups vs. their sector peers.
This period marks a notable rotation-led pullback across major market caps, with defensive and select names showing relative strength as mega-cap tech and cyclicals drop sharply.
Psych Charts of note
NYMO McClellan Oscillator
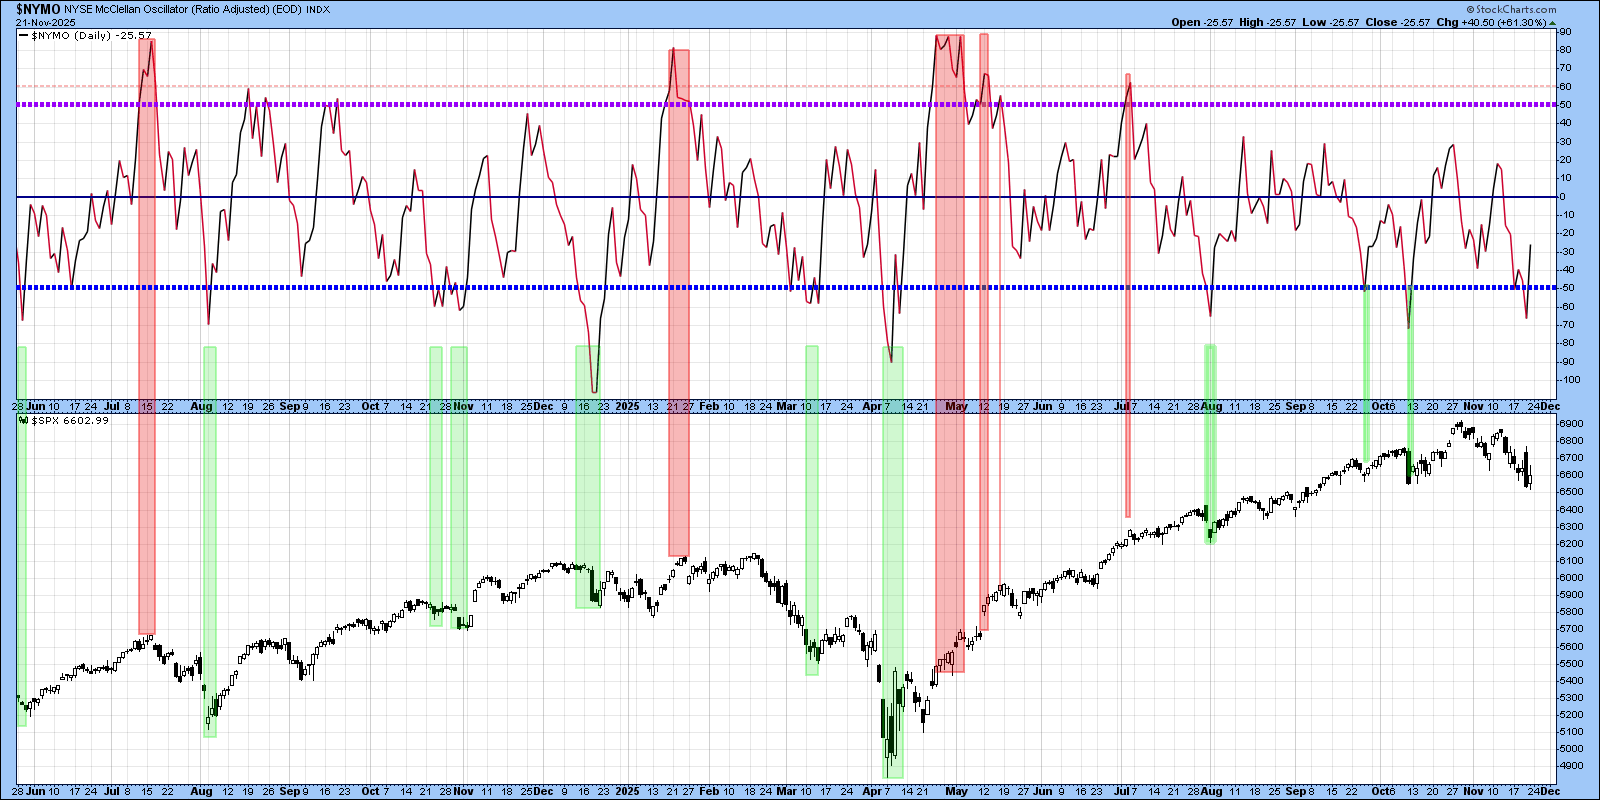
NYMO oversold has been a wonderful time to watch for long opportunities.
Newer Dow Theory
Watch for a rally Monday into the overhead resistance. A likely scenario IMO but that overhead is thick, so I would expect it to fail. That's just my opinion, which I should not be giving, but something to be aware of… Strong open, weak close is a hallmark of broader market weakness. If that occurs Monday, the doomers will come out in full force, and potentially rightly so…
TNX 10-year US Treasury
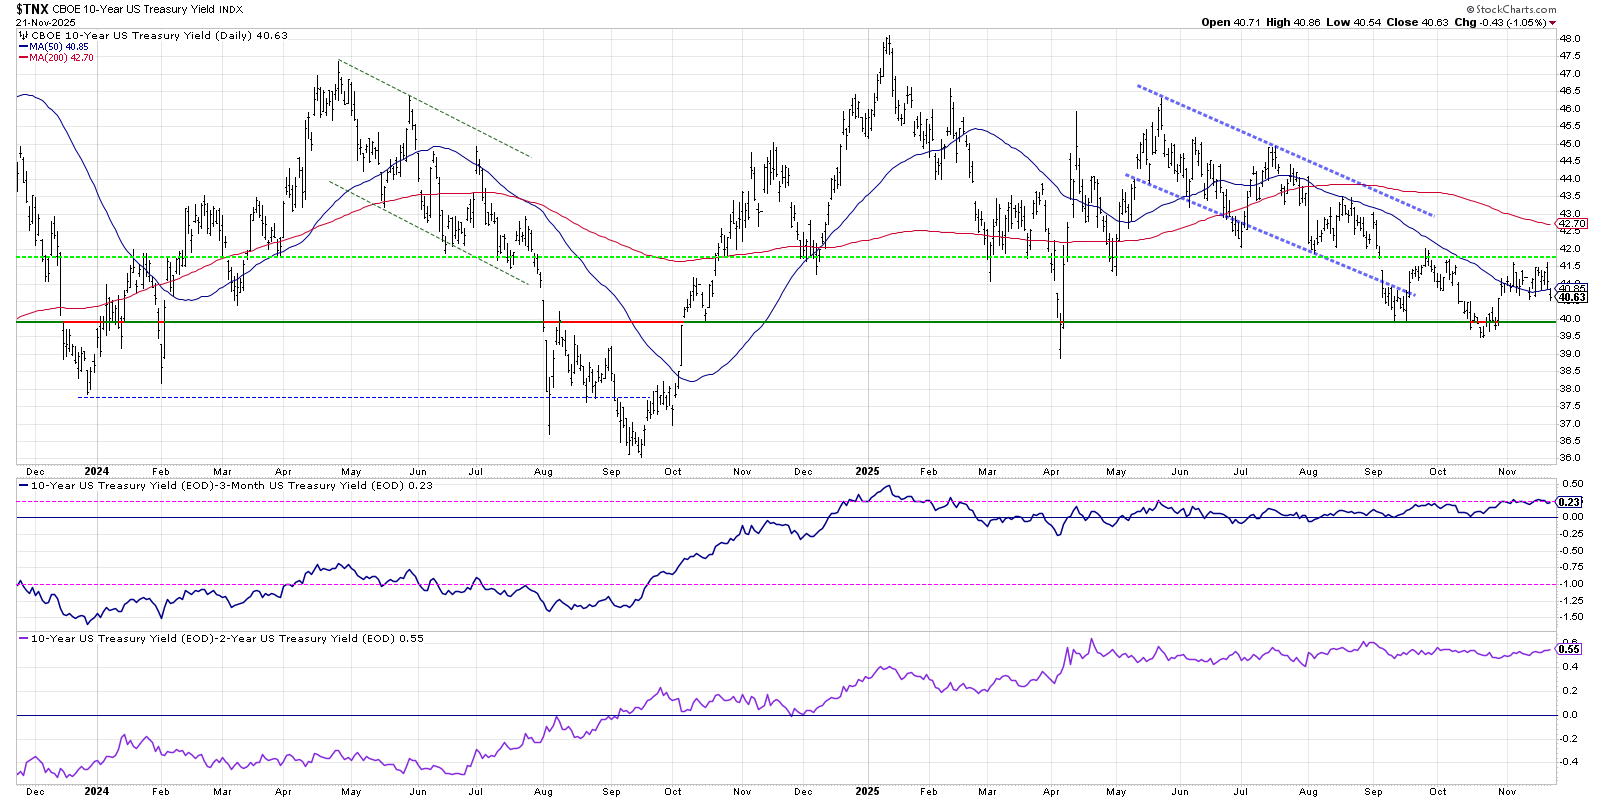
TNX Moved below the 50 day SMA
Dollar versus Gold…
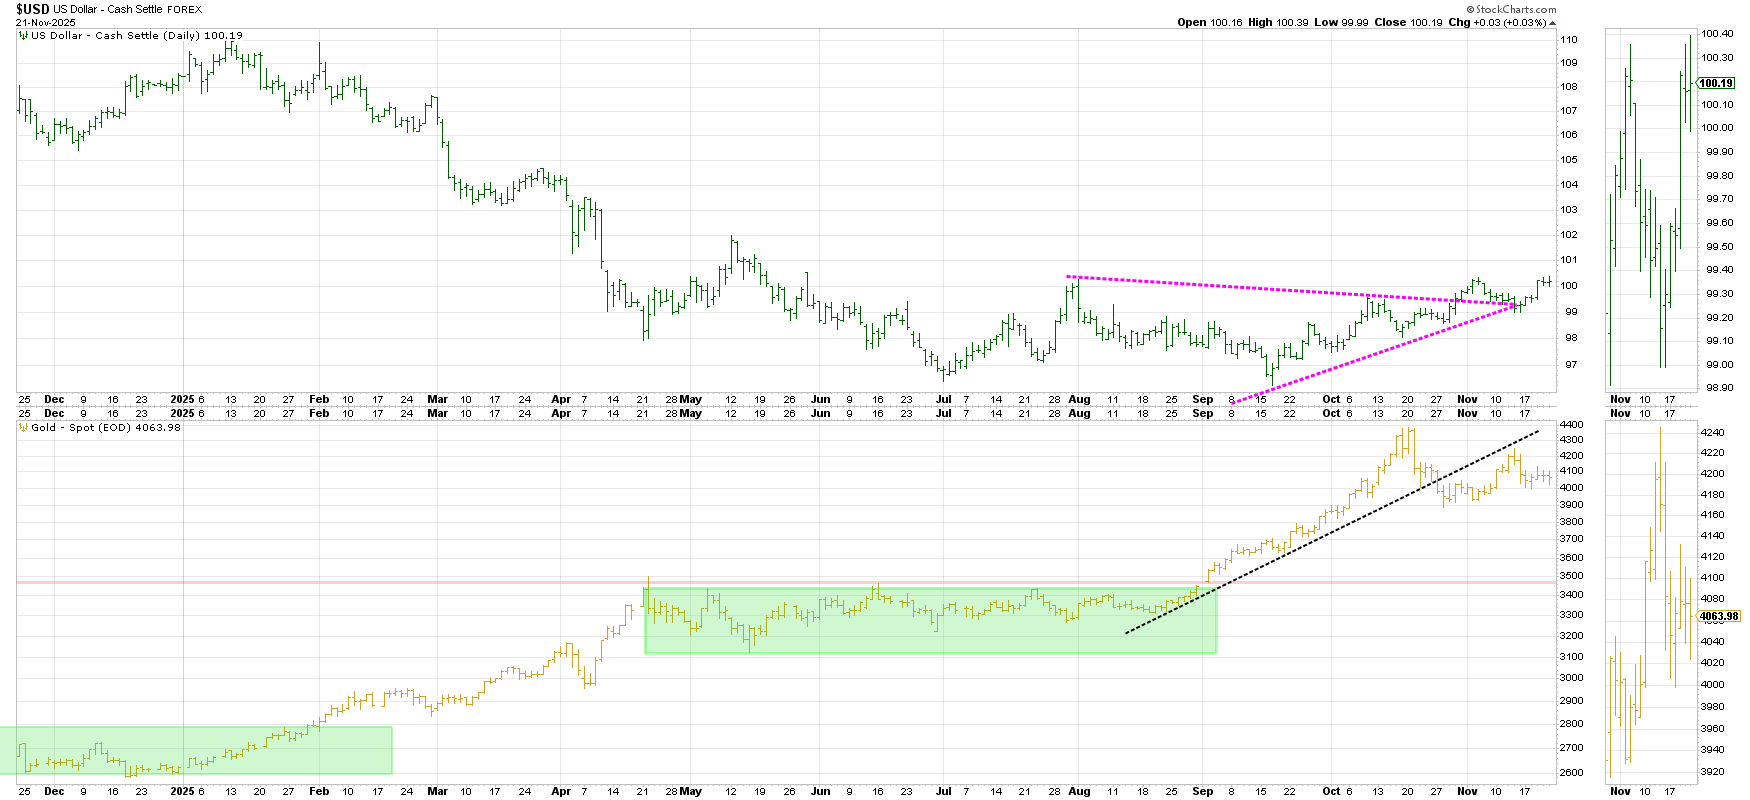
DXY with Higher highs and higher lows…
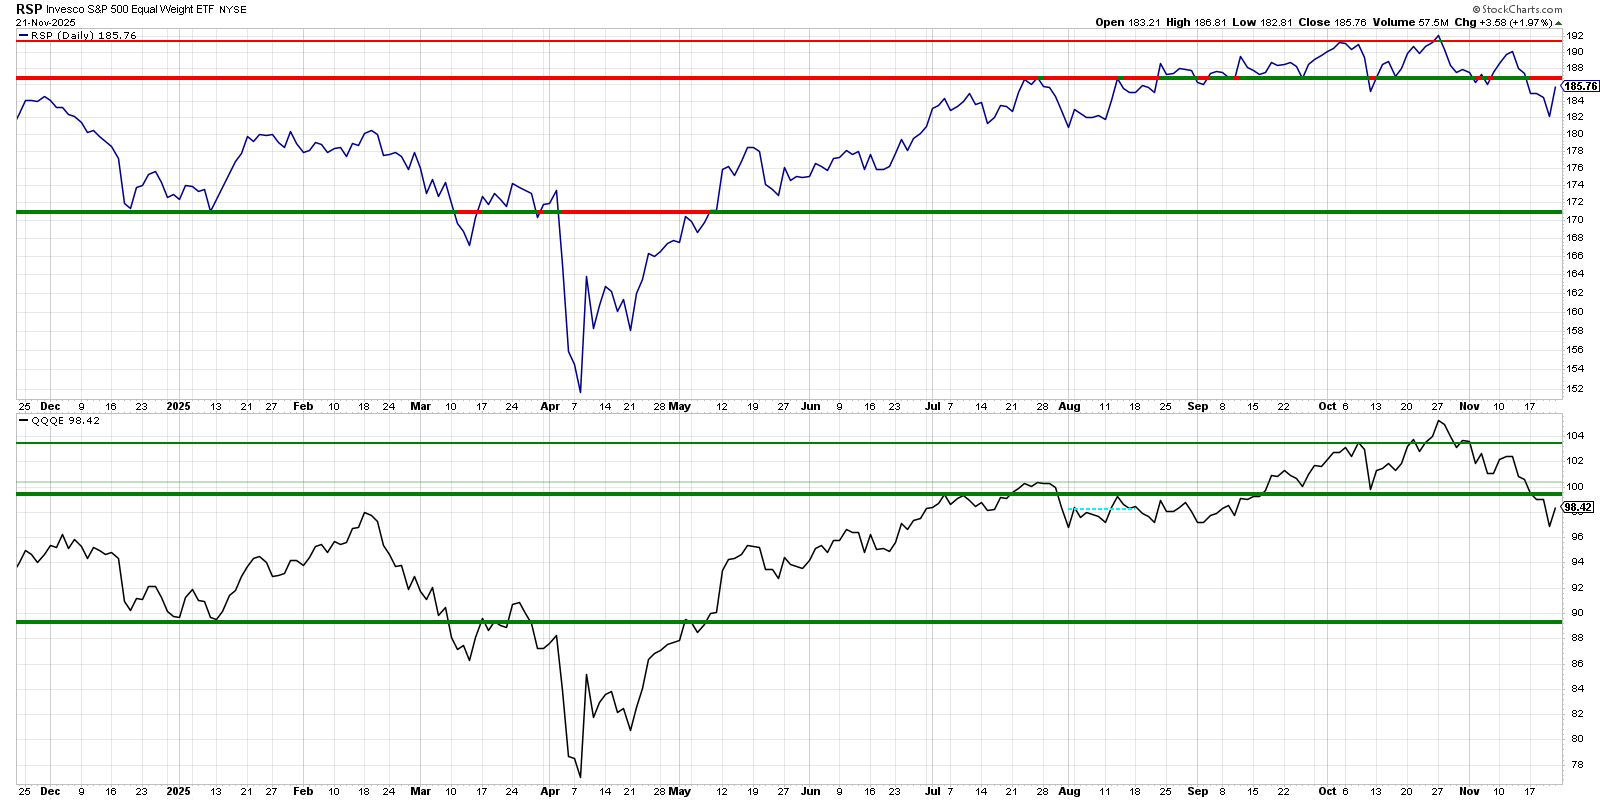
SPX and NYC new hi/lo
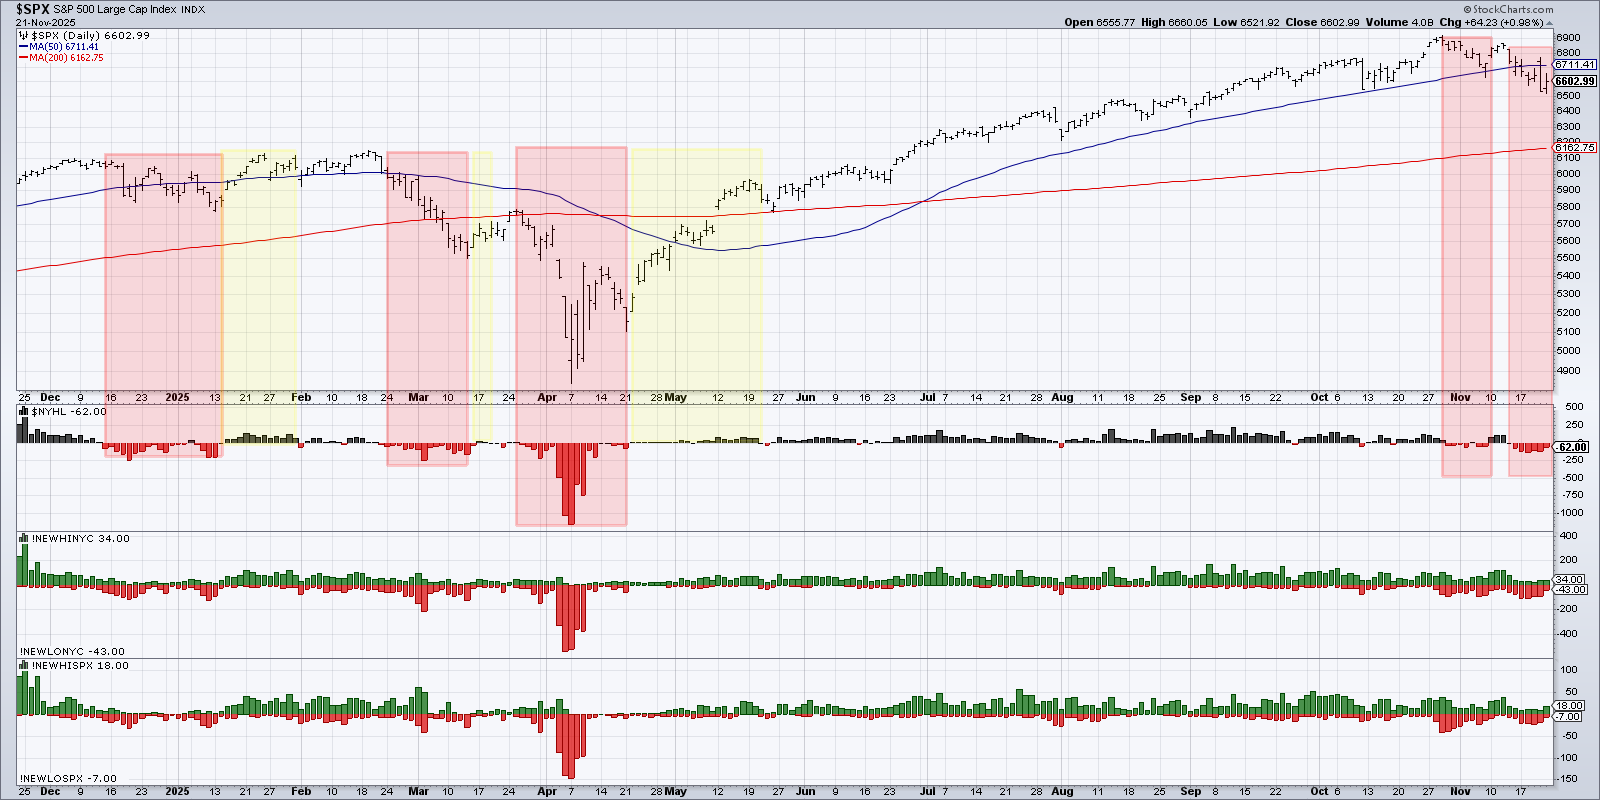
SPX and NYC new hi/lo, the red continues to shine but I suppose it is decreasing, so that is better than increasing…
SPY chart with Deepvue market trend analysis
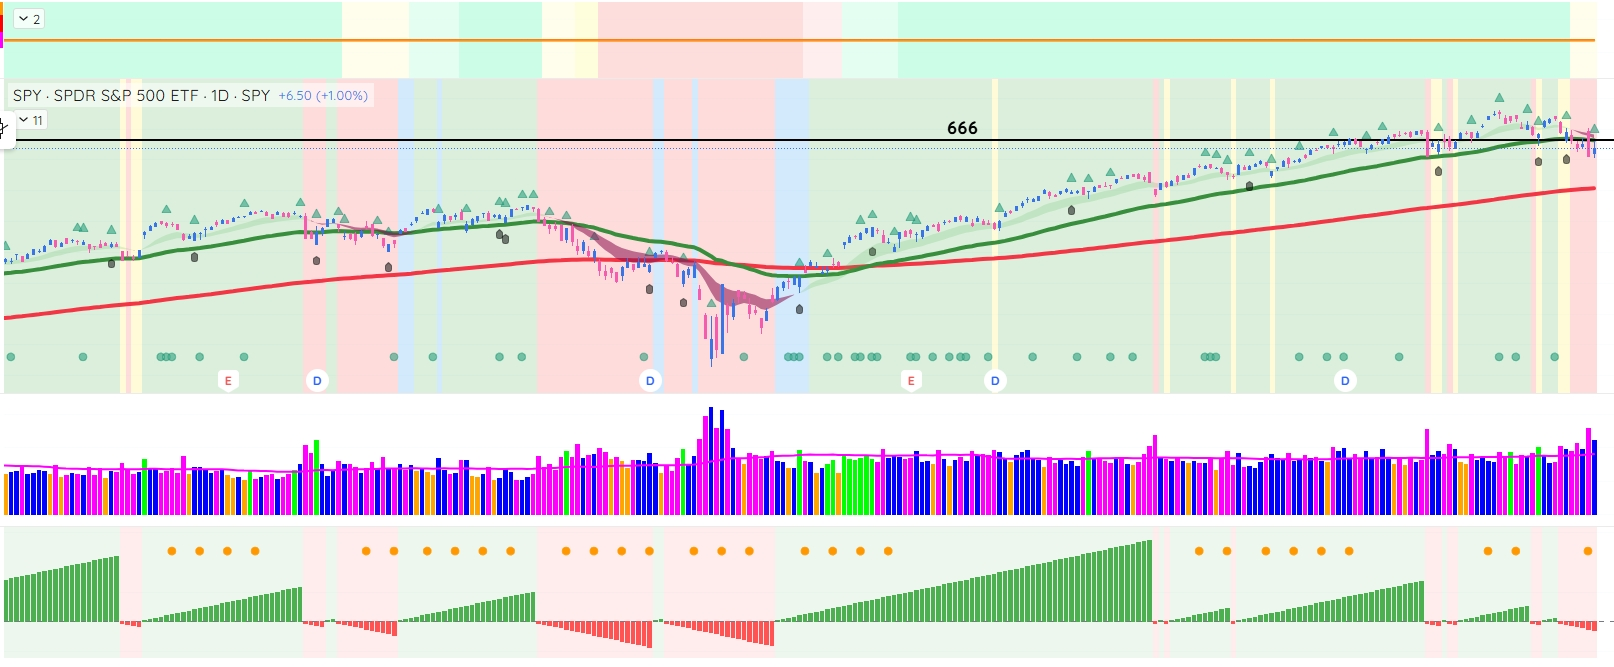
Pretty simple… Sit on your hands below 666 and participate in the next market cycle startup attempt… Above 666 good and below 666 bad… Easier said than done…
Weekly- Relative Rotation Graph (RRG)
This chart provides a relative strength and momentum snapshot for all S&P sector ETFs against the SPY over the 5-week period.
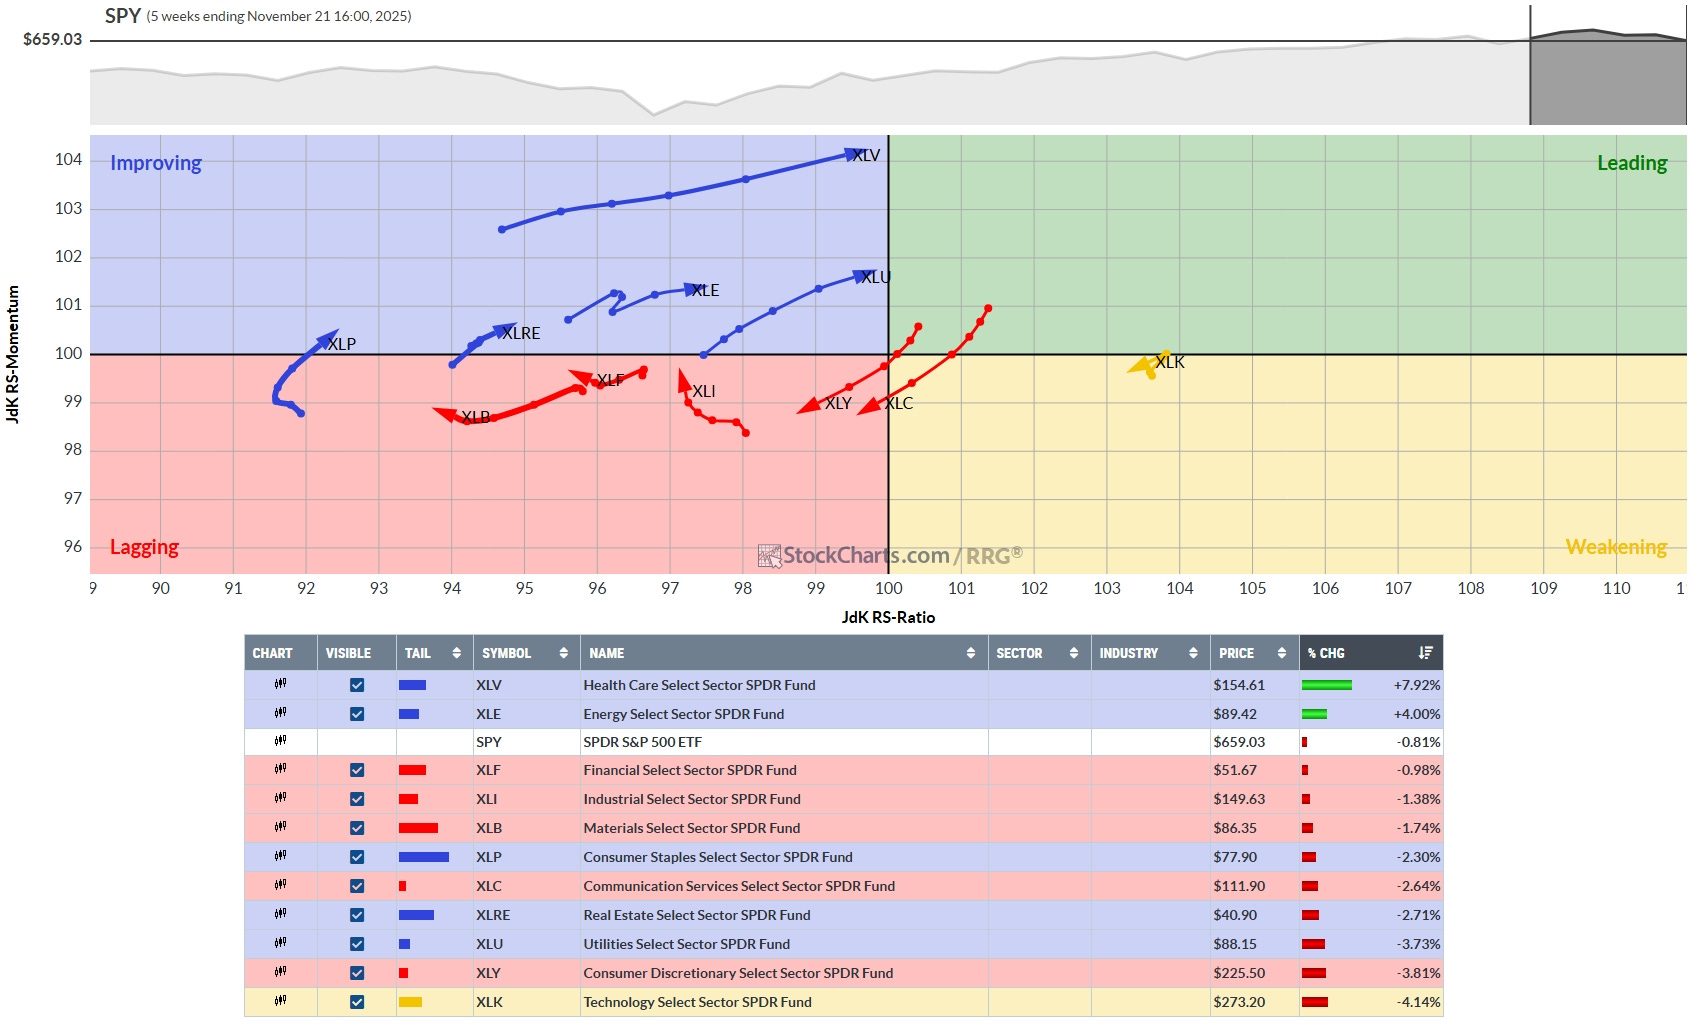
Leading and Weakening Sectors
Technology (XLK) is still in the Leading quadrant but is moving toward Weakening, with a significant decline in price over the period (-4.14%). XLK shows strong RS-Ratio but waning momentum, suggesting it may be topping out in relative performance.
No other sectors are currently in the Leading quadrant. Utilities (XLU) and Health Care (XLV) are in Improving, hinting at possible future leadership.
Improving Sectors
Health Care (XLV) has strong upward momentum and RS-Ratio, posting the largest gain over the period (+7.92%). Its tail is extending deep into the Improving quadrant, making it a likely candidate to enter Leading soon.
Energy (XLE) is also improving, up +4.0%, moving toward Leading status.
Utilities (XLU) and Real Estate (XLRE) are in the Improving quadrant, gaining momentum, though their price performance is still negative.
Lagging and Weakening Sectors
The majority of defensive and cyclicals—Financials (XLF), Industrials (XLI), Materials (XLB), Consumer Staples (XLP), Communication Services (XLC)—are in Lagging, with negative price change and weakness in both RS-Ratio and RS-Momentum.
Consumer Discretionary (XLY) is Lagging and shows the worst price loss for the period (-3.81%), while XLC and XLB are also notably weak.
The SPY itself is slightly down (-0.81%), confirming an overall weak market with select sector outperformance.
Summary Table
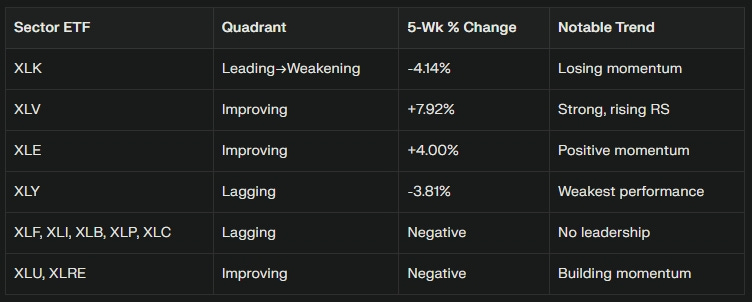
Tactical Implications
Focus is shifting toward defensive sectors like Health Care and Energy, which are showing relative strength versus a soft tape.
Tech is losing steam—XLK’s weakening momentum may signal a reversal or sector rotation ahead.
Weakness in cyclicals and consumer stocks creates a risk-off environment for swing trades in those areas.
Short- and medium-term outperformance looks strongest in XLV and XLE, while tech traders should keep caution on XLK given the recent momentum loss.
Before we look further at the S&P 500 sectors, let’s look at the offensive versus defensive chart below…
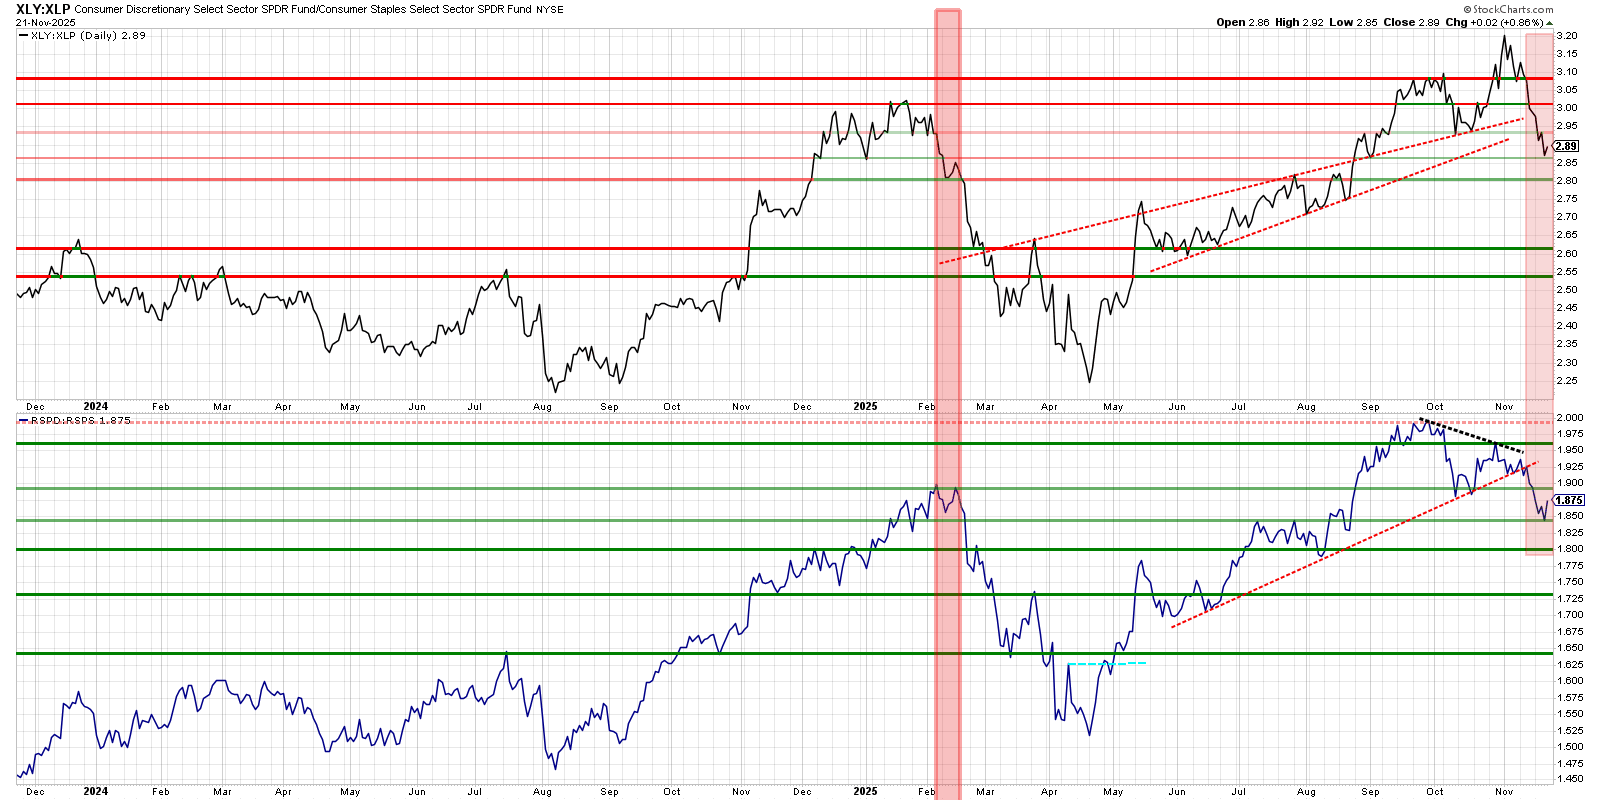
Technical Analysis
Both XLY:XLP and RSPD:RSPS broke below upward-sloping support trends (red dotted lines), hinting at a transition from strong discretionary outperformance to potential mean reversion or defensive shift.
Both ratios currently rest on horizontal support lines that have previously served as pivot levels, especially around 2.85-2.90 for XLY:XLP and 1.87-1.88 for RSPD:RSPS. If these fail, next support levels are much lower, which could indicate a stronger shift in sector leadership.
Market Implications
Sustained breakdowns of these ratios could signal a move out of growth-sensitive cyclicals and into defensive stocks, aligning with broader market caution.
Swing traders should watch these pivots closely—a bounce may signal renewed risk appetite, while sustained breakdowns would favor defensive positioning or sector rotation trades.
Growth versus Spy
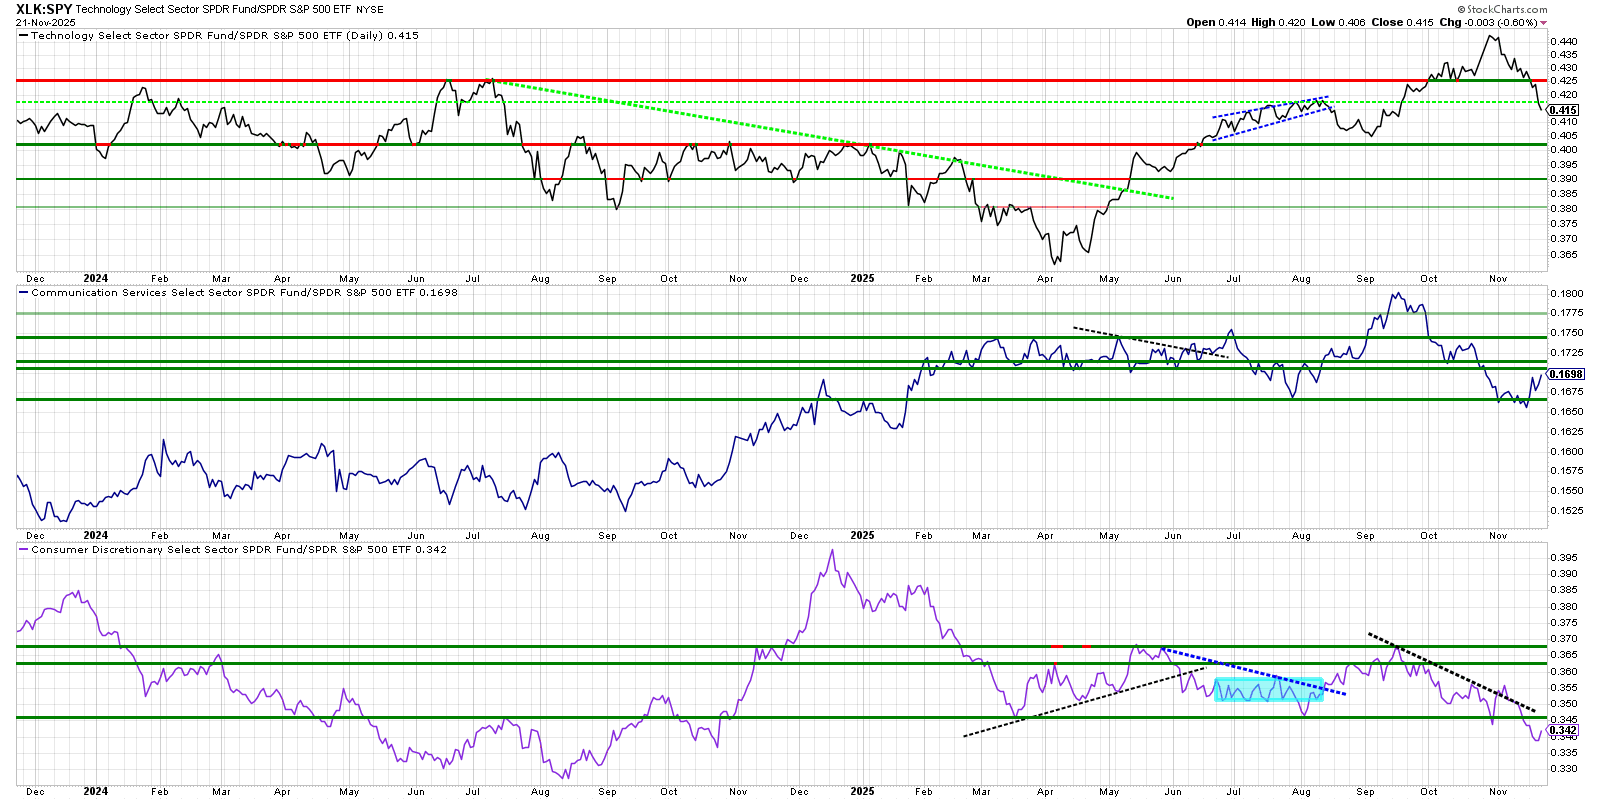
Key Takeaways
Technology (XLK) shows fading leadership but offers support at 0.41–0.40 — trend looks vulnerable unless buyers step in.
Communications (XLC) risks breakdown if it loses the 0.1698 support; sector is not regaining outperformance.
Consumer Discretionary (XLY) continues relative underperformance, confirming downside trend.
Swing Theme Implications
Market leadership has rotated away from discretionary and communications; technology leadership at risk as XLK:SPY pulls back.
Sector rotation setups should favor relative strength if/when XLK stabilizes; otherwise consider continued defensive/rotation plays until leadership trend resumes.
This analysis supports caution in aggressive sector rotations toward tech, while defensive setups may outperform if these ratios continue their corrective phase.
Value versus SPY
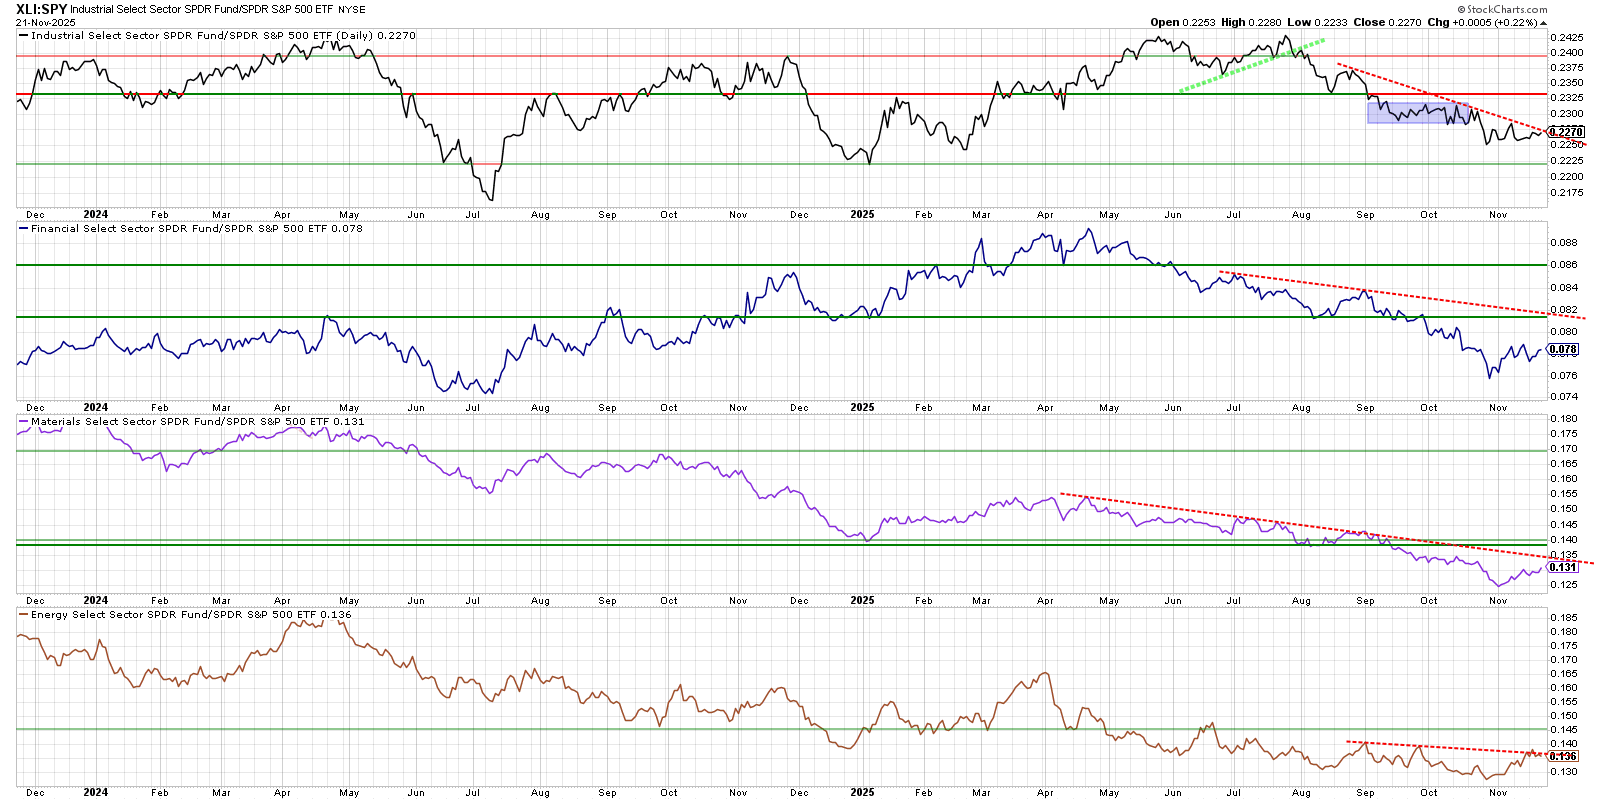
Actionable Technical Summary
Relative trends remain bearish or neutral for Industrials, Financials, and Materials.
Energy is closest to a possible positive swing, pending a decisive break above resistance.
Swing traders may find better setups in other sectors until proven trend reversals emerge in these charts.
Defensives versus SPY
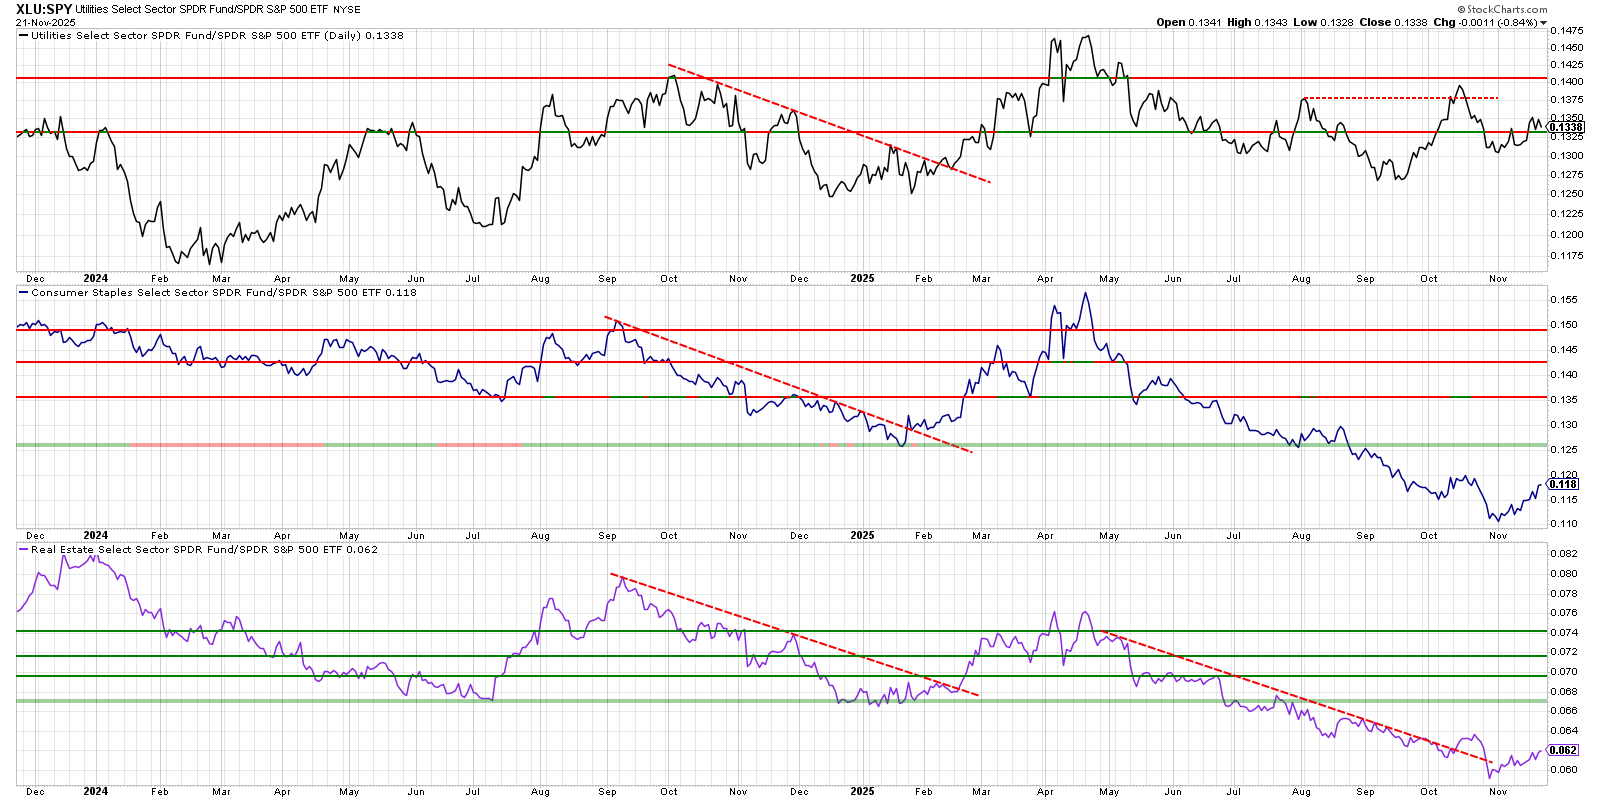
Strategic Implications
Defensive sectors (utilities, staples, and real estate) have been underperforming SPY for much of 2024 and early 2025, but all three ratios show signs of bottoming and short-term relative strength, particularly after breaking long trendlines.
If defensive ratios continue to hold above these supports or retake resistance levels, it may indicate a risk-off environment or rotation toward traditionally safer sectors.
Thoughts this week: Down almost -10% this week… Get it together Phat…
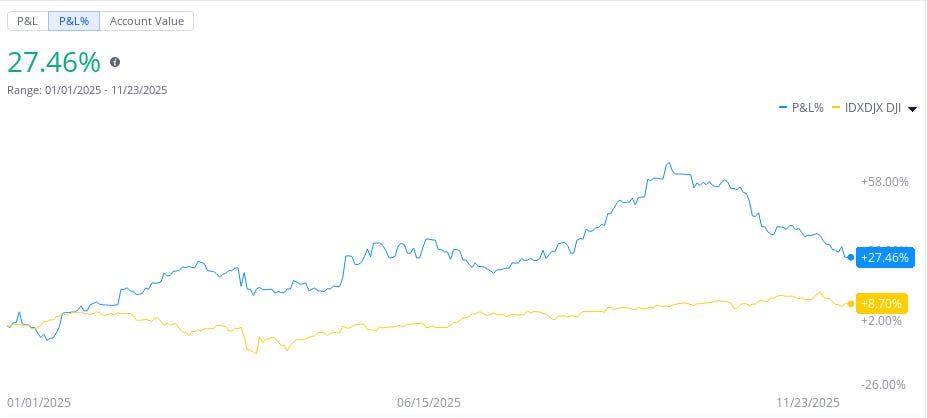
You can do it, Keep Studying!
Most others don’t post their YTD because they can’t or frankly, they are lying. You better make sure, or you might lose it all…
Stock Talk Insiders discord
If you like this Phat Swing Plan, and you would like to receive alerts for my trades, click this link for the discord Stock Talk Insiders discord and enter the promo code: PHAT to get 10% off all packages for life...

Follow my alerts on Stock Talk Insiders discord Enter code: PHAT for 10% off
Follow my Phatstack for my Phat Swing Plan and updates during the week.
Follow me on X Phatinfantry Trading @Phatinfantry where I post/talk crap when I drink wine and make fun of dumb things.
Follow me on YouTube where I go through my process and review charts Phatinfantry
Love this perspective, thanks for highlighting these important AI valuation worries. Do you tink these market fears will impact acutal AI innovation in the long run?