
Phat Swing Plans and Observations
For the week of 3/1/26


Market Summary for the week
U.S. equities head into Mar 2–6 still stuck in a 6,720–7,000 trading range, with last week’s tariff‑ and inflation‑driven volatility leaving the S&P 500 down modestly, the Nasdaq weaker, and utilities/defensives continuing to quietly outperform.
Big picture and indices
For the week ended Feb 27, the S&P 500 fell about 0.4%, the Nasdaq about 1.0%, and the Dow about 1.3%, reversing the prior week’s rebound as sticky inflation, AI jitters, and bank weakness weighed on risk appetite.
The S&P 500’s primary trend remains up, but short‑term momentum is firmly range‑bound; the index keeps failing near 7,000 and finding support around 6,720–6,780, with realized volatility picking up as swings within that band get sharper.
Index snapshot (last week)
S&P 500: -0.4% Long‑term uptrend, stuck between ~6,720 and 7,000.
Nasdaq: -1.0% Underperformed as NVDA and broader semis sold off despite beats.
Dow: -1.3% Pulled lower by banks and economically sensitive names; still modestly positive YTD.
Sector and style rotation
Last week’s sector leaders were utilities (about +3%) and consumer defensive (+2.4%), while cyclicals like financials and some industrials lagged as higher‑for‑longer rate fears resurfaced.
Growth/AI‑linked tech remained choppy: Nvidia beat and raised but still fell around 5–7% on sustainability concerns, and semis dragged the Nasdaq lower, even as stock‑specific winners like NFLX, KEYS, AXON, and DELL posted big gains.
For swing bias, that keeps defensives (utilities, staples, healthcare) and selected quality growth names in favor, while AI‑heavy semis and banks are higher‑risk tactical trades until leadership clarifies.
Macro calendar: what matters
This week is macro‑heavy again: ISM manufacturing, ADP, ISM services, and the February jobs report will all feed into how many cuts the Fed can realistically deliver in 2026, ahead of the March 17–18 FOMC meeting later in the month.
After hot-ish PCE and CPI prints kept inflation in the mid‑2s, a strong set of activity and labor numbers could push yields higher and further pressure growth/AI names; softer data would support the current “slow‑drift lower in inflation” narrative.
Key U.S. items this week (all ET):
Monday Mar 2: 10:00 a.m – ISM Manufacturing Index (Feb).
Wednesday Mar 4: 8:15 a.m – ADP National Employment Report; 10:00 a.m – ISM Non‑Manufacturing (services) Index.
Thursday Mar 5: 8:30 a.m – Weekly jobless claims, revised productivity & costs, trade balance; 10:00 a.m – Manufacturing, shipments, and orders.
Friday Mar 6: 8:30 a.m – Employment Situation (Feb nonfarm payrolls, unemployment, wages); 10:00 a.m – Wholesale trade.
Earnings: summary for the week
Earnings season is past its peak but still active, with a focus on retail, semis, and a few high‑beta growth names that can move niches rather than the whole index.
Nvidia’s reaction last week showed that even beats in AI leaders can be sold if guidance doesn’t reset long‑term fears, so traders will continue to treat AI/semis reports as two‑way coin‑flips rather than “can’t miss” upside catalysts.
Earnings calendar
Mid‑week: CRWD, ROST, ANF – all known for strong post‑earnings moves and options liquidity.
CRWD in the cyber-SaaS will be closely watched
Later in week: KR, AVGO, RGTI, AEO, JD
– AVGO is the key AI/semis bellwether to watch for sentiment in chips and cloud.
Trading implications for the week
Tape: SPX still trades in a wide but defined band (~6,720–7,000) with rising realized volatility, meaning swings are bigger but not yet directional; your playbook should assume continued range‑trading with event‑driven spikes around 10:00 a.m and 8:30 a.m releases.
Leadership: Defensive rotation (utilities/staples) versus choppy growth/AI suggests keeping a barbell: core longs in defensives and steady compounders, tactical longs/shorts in oversold or extended tech/semis around earnings and macro.
Event risk: The biggest inflection is Friday’s jobs report, with Wednesday’s ISM services and ADP as lead‑ins; consider trimming or hedging high‑beta exposure into Thursday afternoon, then using post‑NFP trends in yields and the dollar as confirmation to add to or fade tech, financials, and cyclicals.
And of course…
Theme on the tape is “geopolitical risk + energy bid, broad indices wobble but still near highs,” which usually favors watching energy/oil services, defense/aerospace…
Into Sunday night / Monday, I’ll be keeping a close eye (Like everyone) on: OPEC+ headlines, any concrete U.S./Iran move, But I think mostly as a trader I will be watching how ES/NQ futures react relative to recent lows rather than just the news flow.
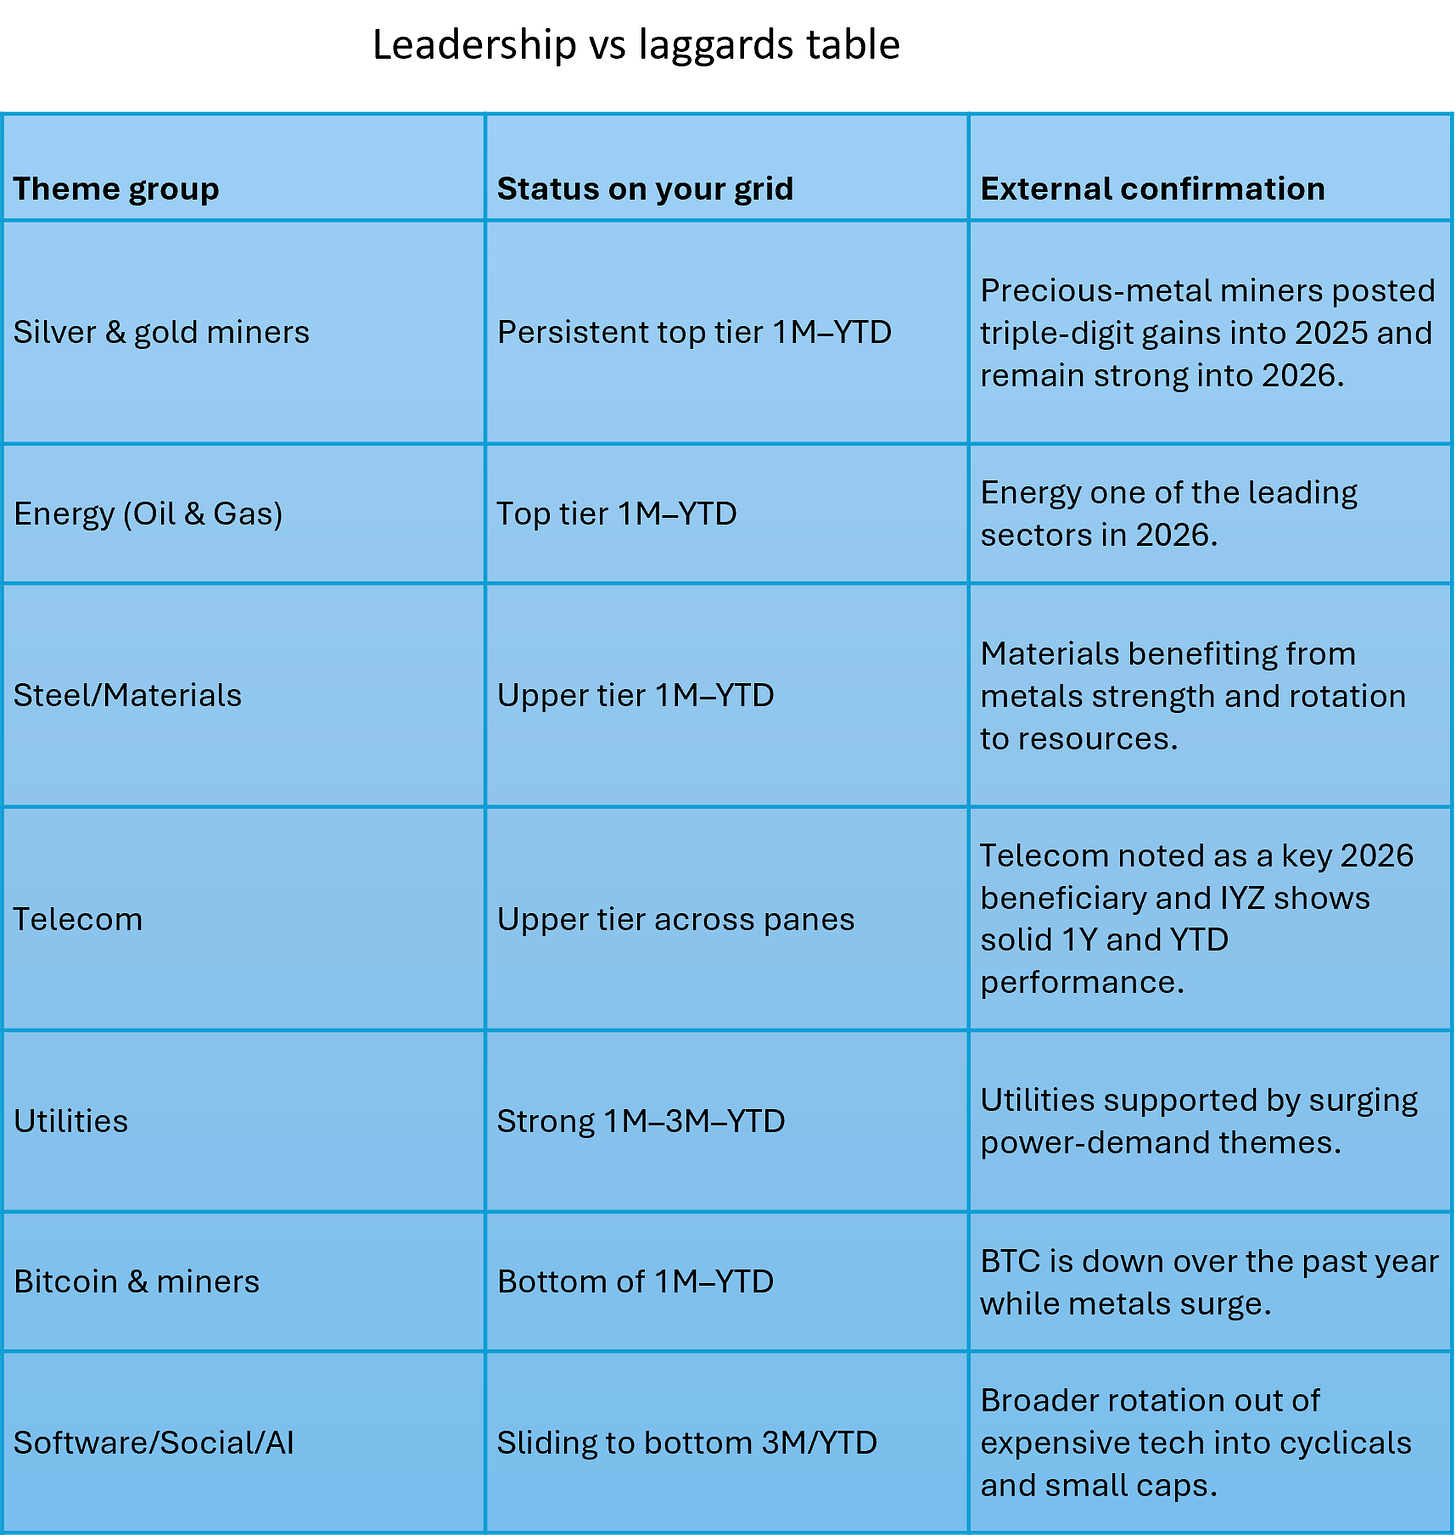
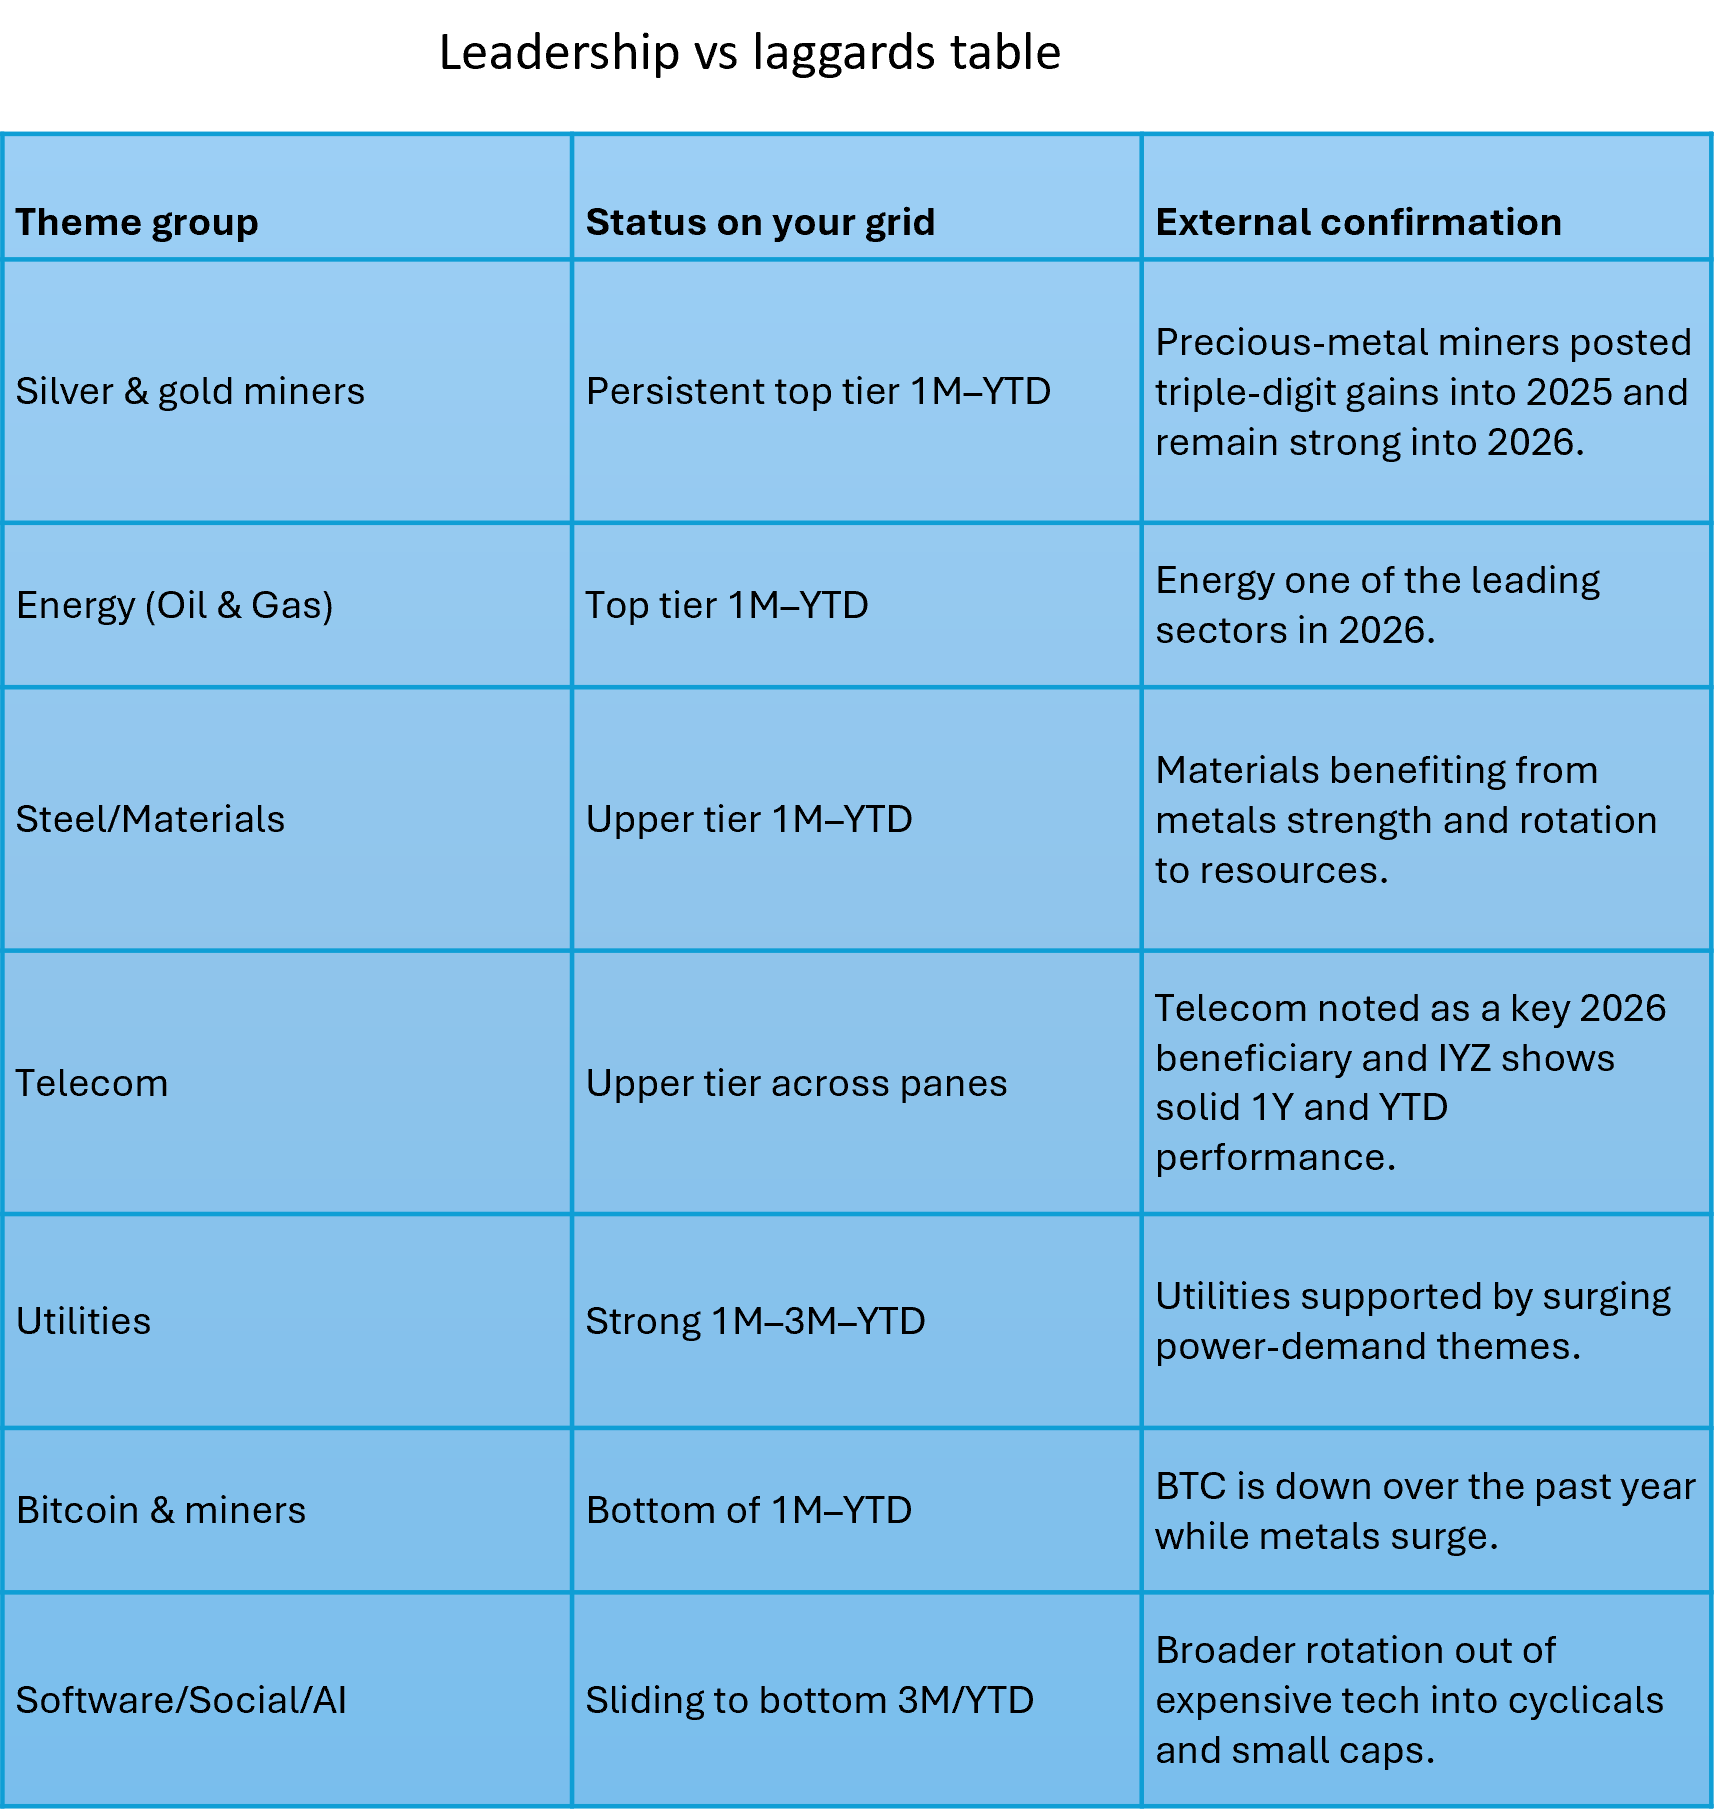
Deepvue Market Themes
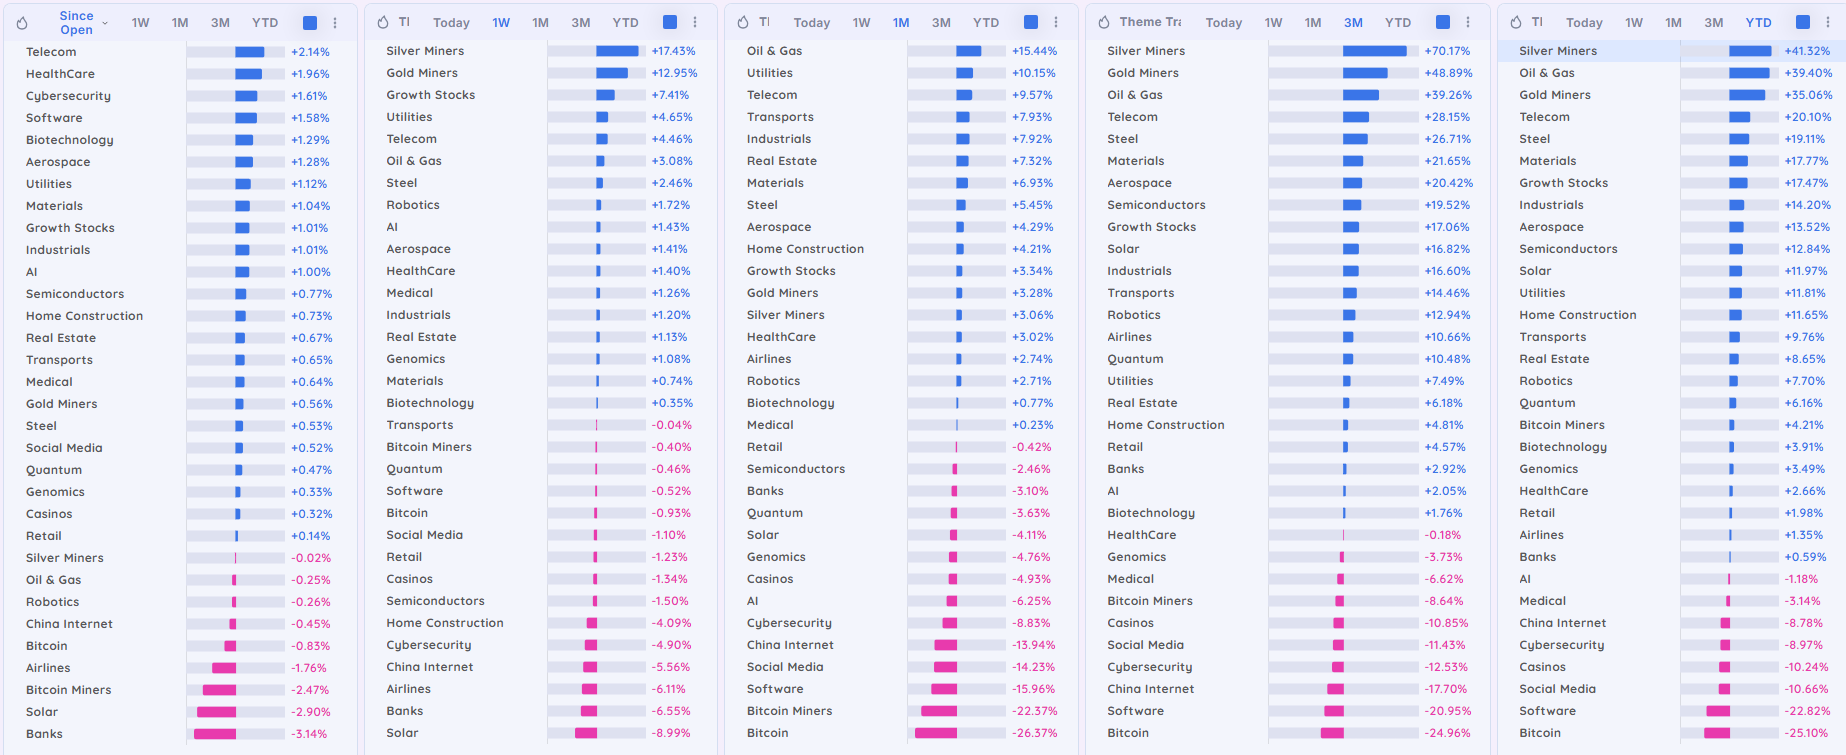
Swing trading implications
Bias new swing entries toward metals, energy, telecom, and real‑asset cyclicals, treating them as “buy pullbacks” candidates into rising MAs; they have both relative and absolute momentum on the theme tracker and in broader market data.
Treat software, social media, crypto, and high‑beta growth as “sell rips / avoid new longs”. In other words, real assets remain the dominant themes.
TradersLab.io Themes
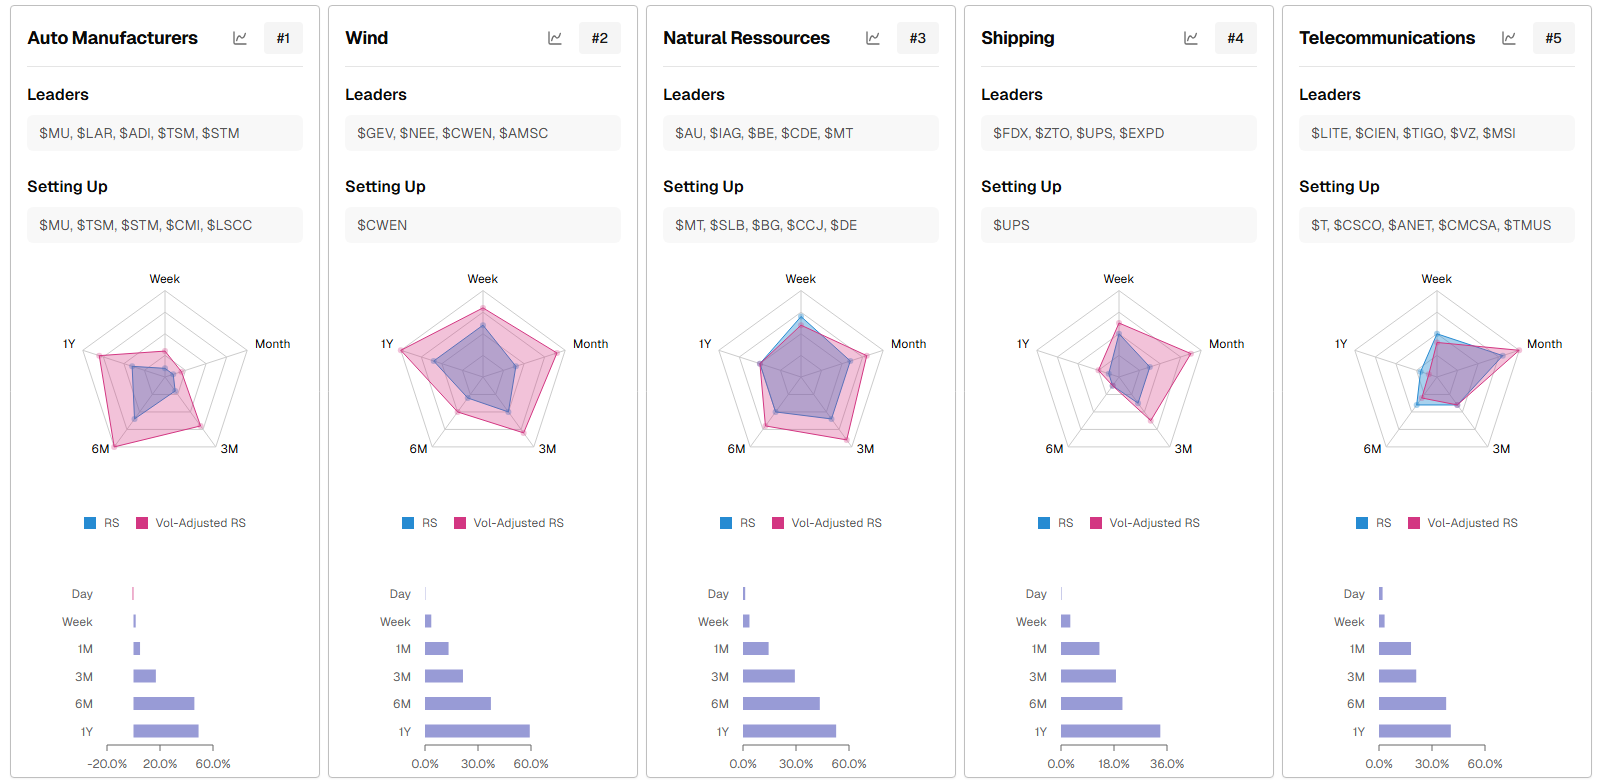
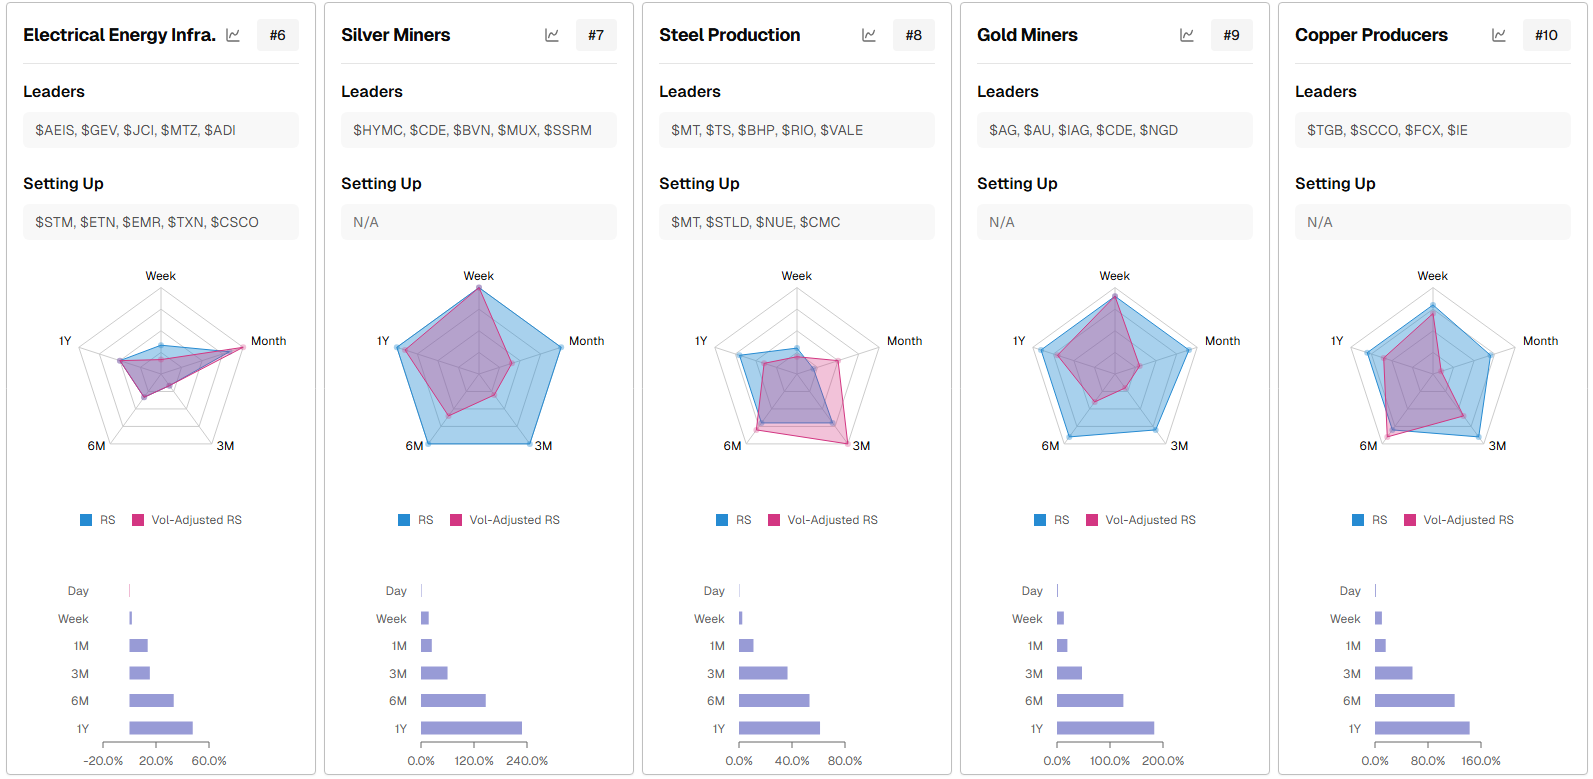
These spiders show early-stage leadership is still rotating toward autos, wind, and broader natural resources, with precious/industrial metals and electrical infrastructure moving up (in some cases back up) the ranks and beginning to offer high‑RS swing candidates.
What stands out
Auto Manufacturers, Wind, and Natural Resources are the strongest, most persistent RS themes across 3M–1Y, with volume‑adjusted RS confirming rather than diverging in those panels.
Shipping and Telecoms show improving RS but much shallower long‑term bars, so they could be more like emerging trades than core themes until they prove themselves.
Silver, Gold, Copper, and Steel complexes are clustered together in the top‑10 list, which argues for a metals/commodities still being of long-term interest.
Electrical Energy Infrastructure is constructive: 3M and 1M RS are strong, yet 6M–1Y are still muted, which is exactly what you want for fresh swing themes coming out of basing structures.
Run rate vs this week’s price change for cap-weighted S&P 500 sector ETFs and equal‑weight sector proxies RSP
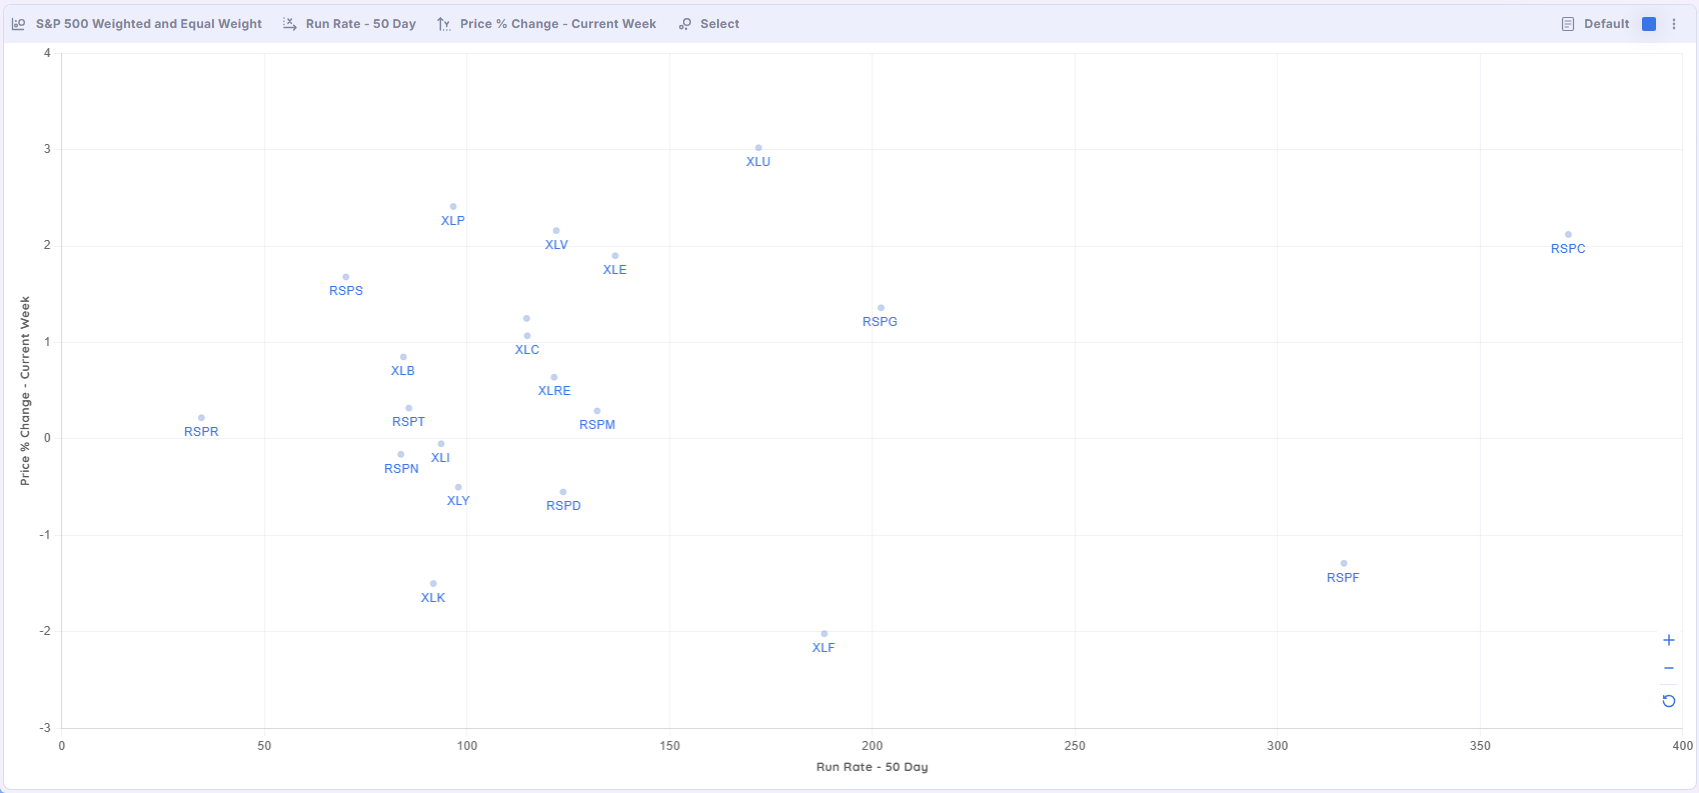
Swing-trader read
This favors defensive longs (Utilities/Staples/Health Care) and caution on Financials/Tech until they stop bleeding.
A simple trigger to watch: XLF and XLK need to flip back to positive weekly change while maintaining (or improving) run rate to signal risk-on breadth returning.
Market Carpet for the S&P 500 by Weekly Price Change
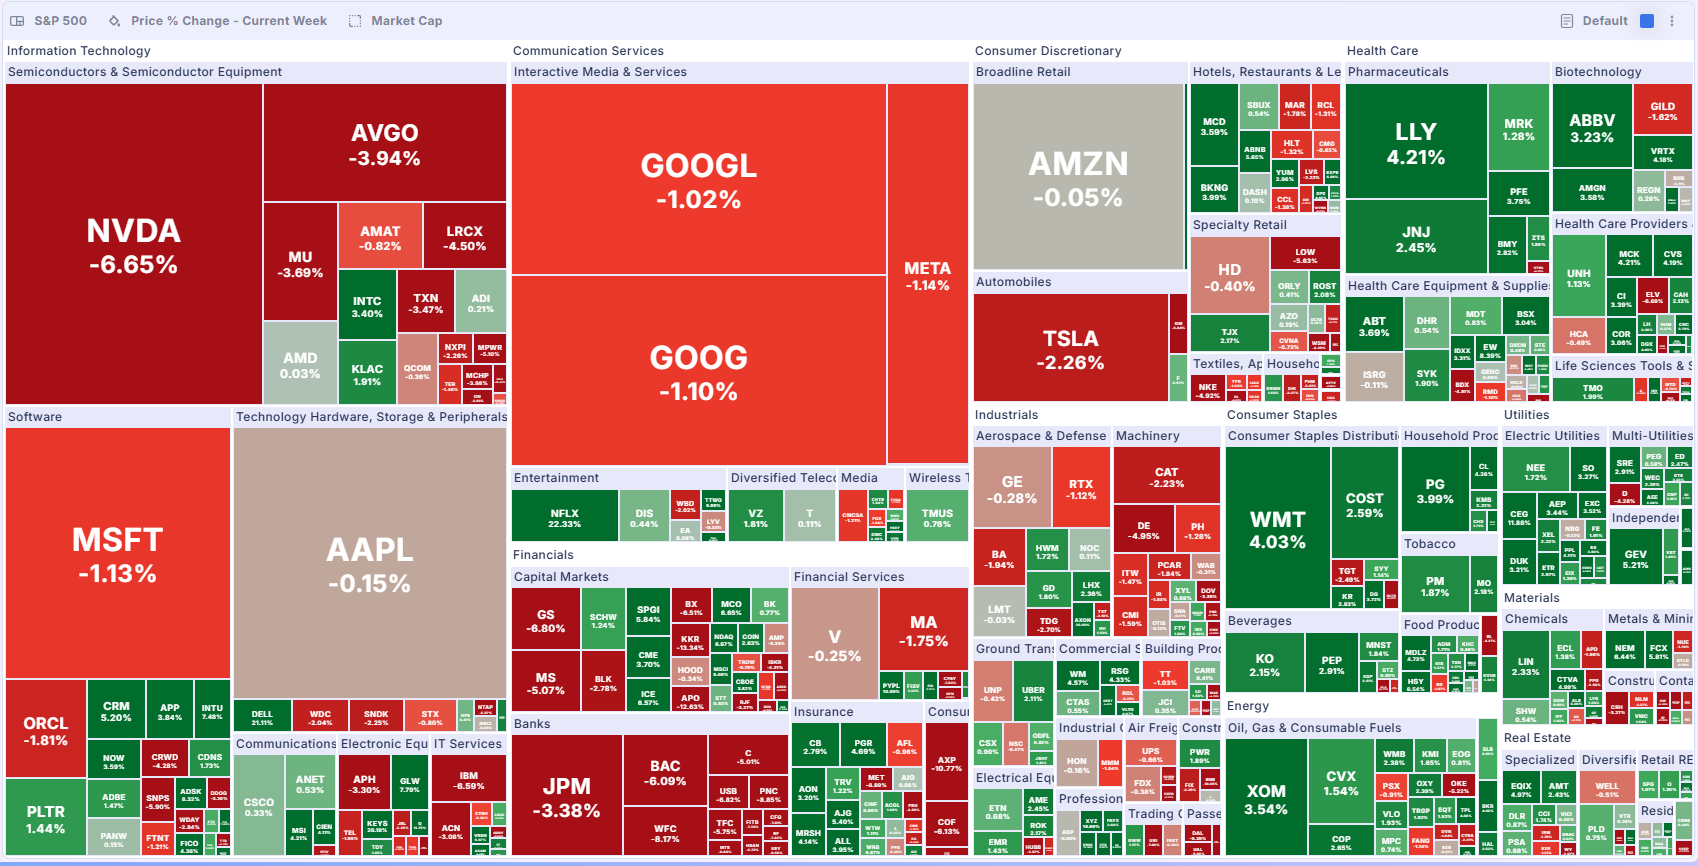
Implications for swing setups
Unless playing the oversold bounce, I’ll avoid entries in names that are red within red sectors (e.g., semis, banks). Too much waterfall selling for me.
From a relative strength perspective this carpet argues for longs in staples, big pharma, and energy, while trimming extended semis/mega‑cap growth until they rebuild RS vs SPX amongst their own sectors.
Psych Charts of note
NASI
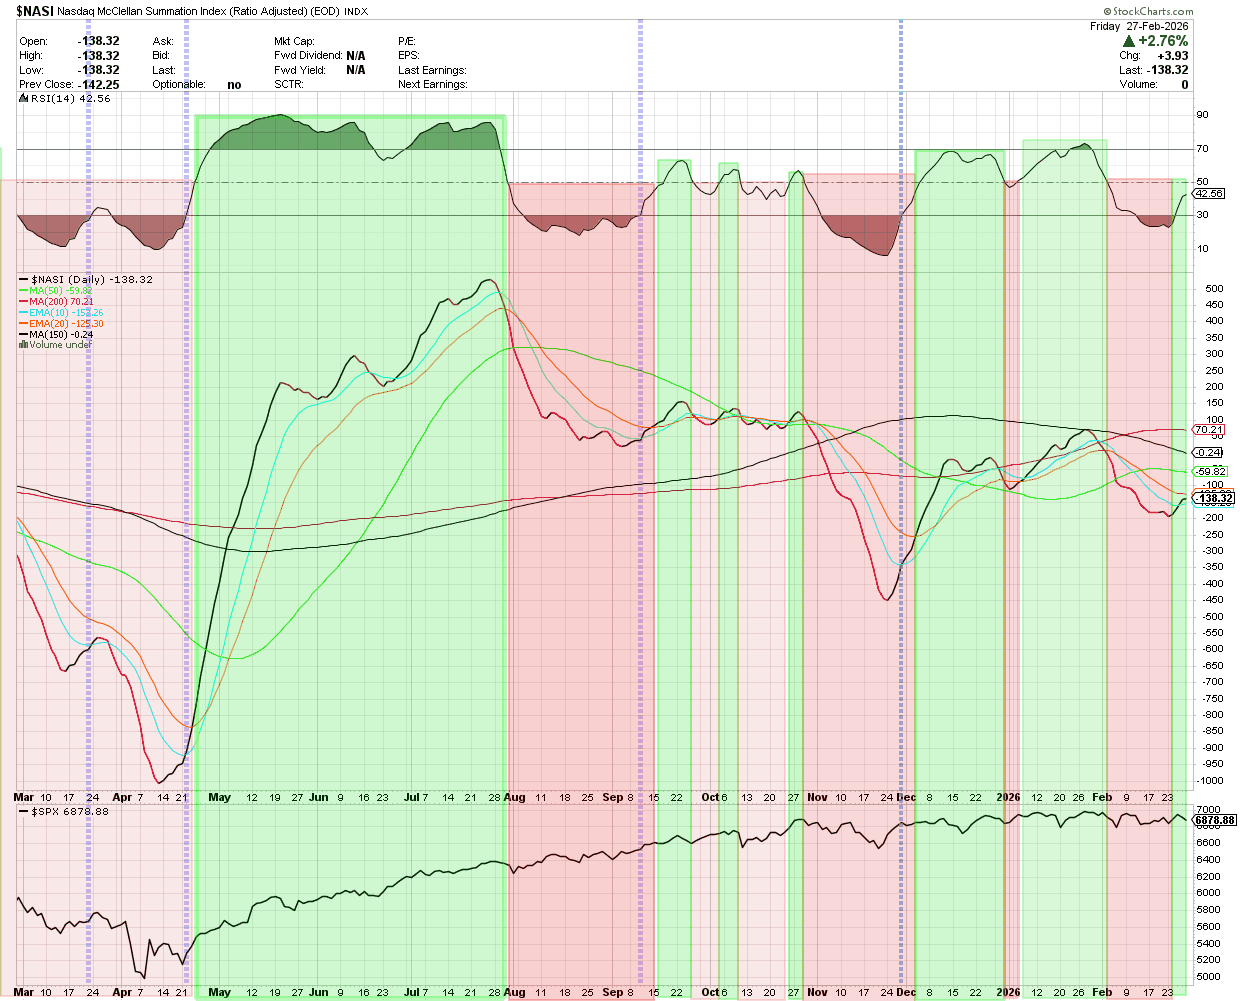
As noted last week, we got the hook up but wanted to see follow through which we did not get in price… We want to see that NASI cross back above the 20 sma for confirmation (Orange Line) Doesn’t look promising as of now, but we are in a news driven environment…
NYMO
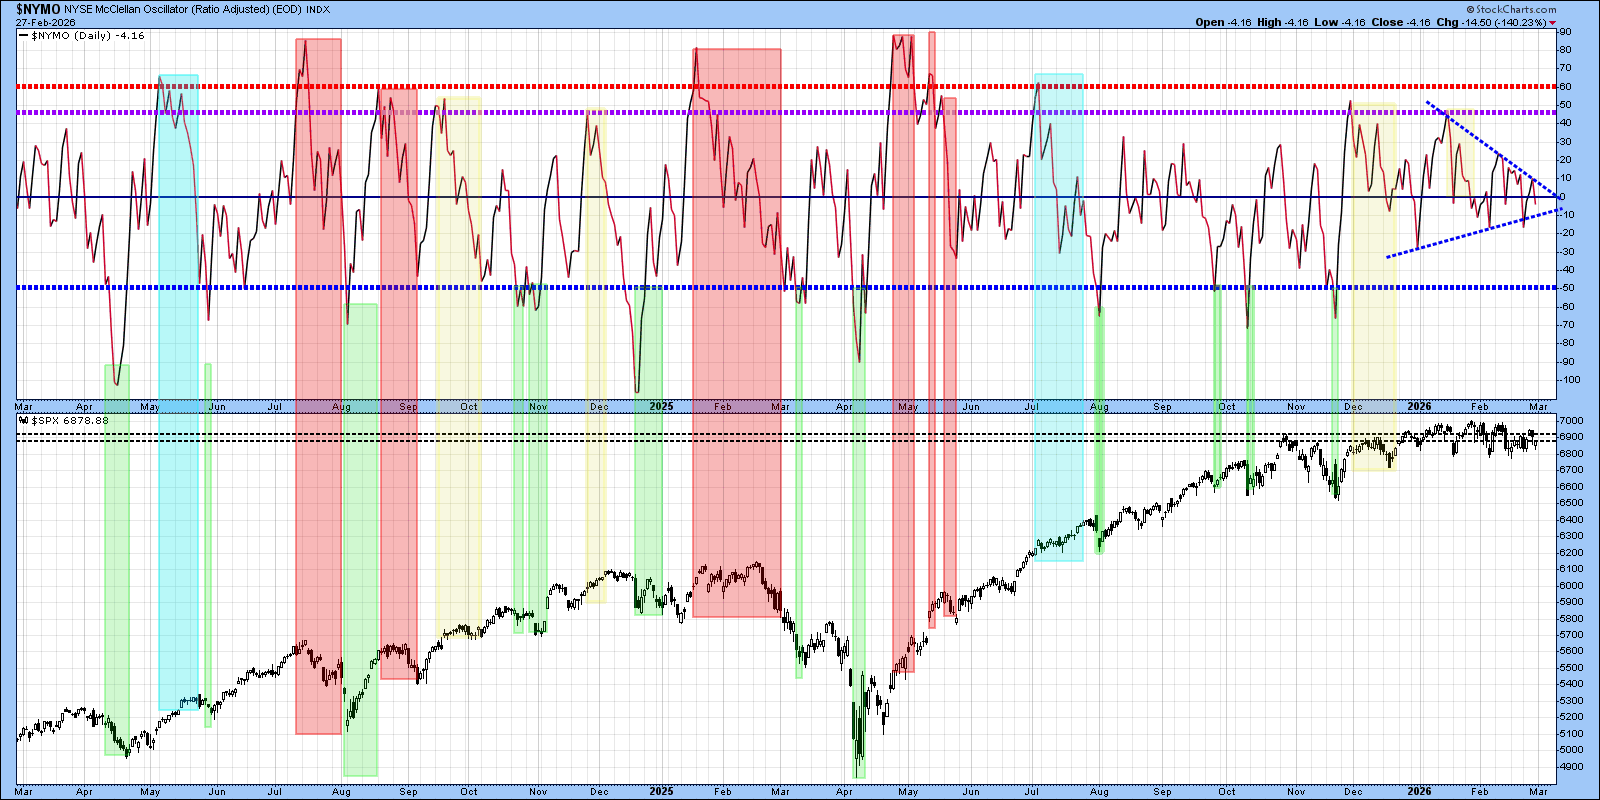
Getting tight… Big move coming…
ICE BofA US High Yield OAS (option‑adjusted spread)
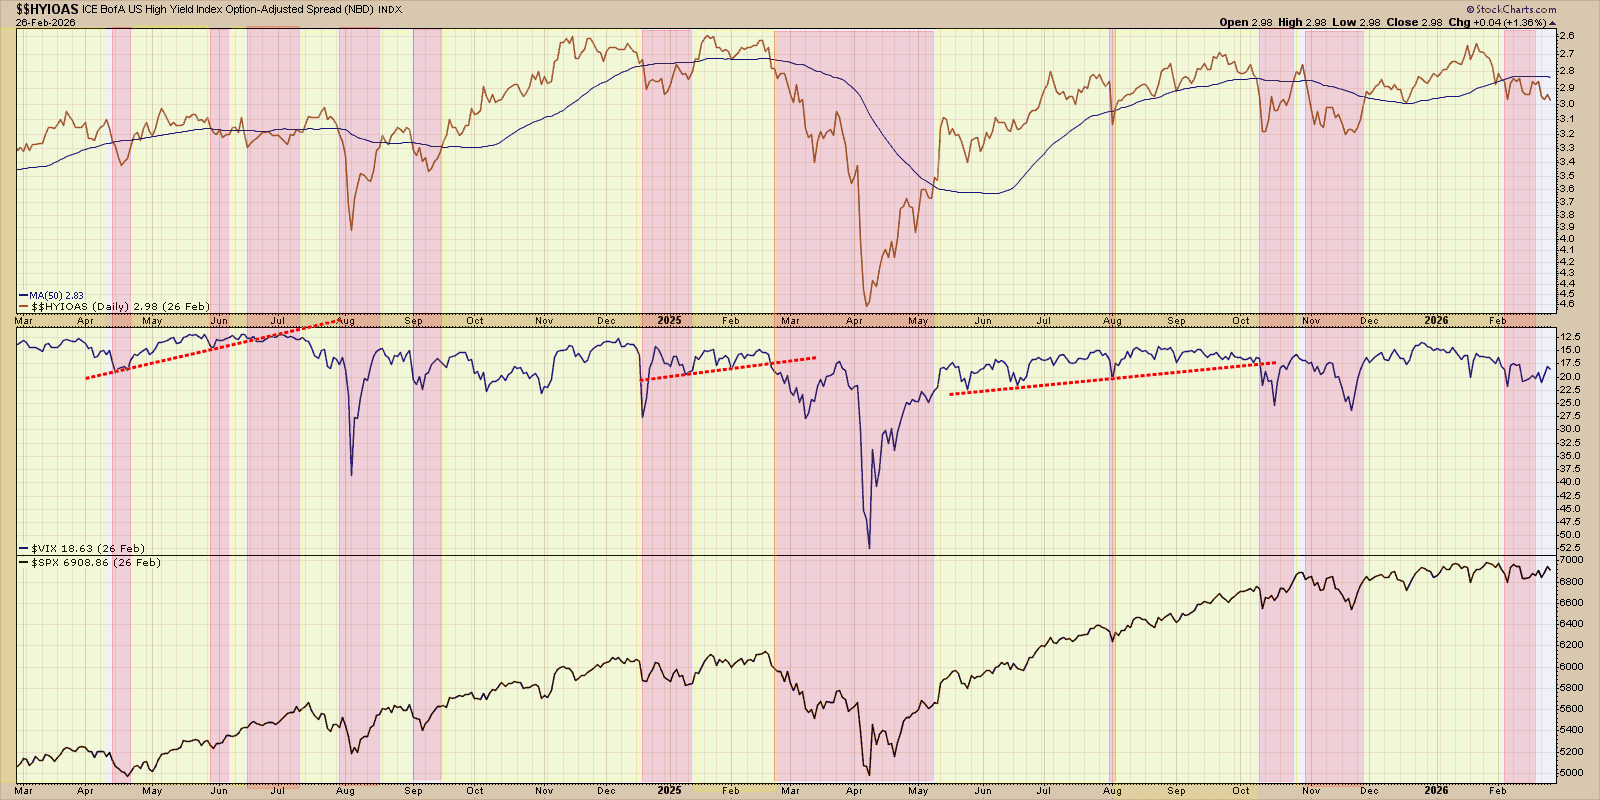
Noted last week that we were not seeing positive connections to HYIOAS…
Key divergences
HY OAS has made a series of higher lows and a gentle uptrend since mid‑2024 instead of continuing to compress, showing incrementally rising credit stress despite higher equity prices.
VIX is not at panic levels but is also carving higher lows rather than collapsing, which aligns with a market that is grinding higher on narrowing breadth and increasing hedging, not euphoric risk‑on.
Historically, sustained widening of high‑yield spreads and a rising VIX tend to precede or accompany equity pullbacks, because investors demand more compensation for risk and hedge more aggressively
In other words, S&P 500 going up but Credit Stress and VIX (volatility) are too. Classic, ride the price until it breaks, and then get the hell out of the way. When that happens, nobody knows. That’s what makes this the last great game IMO…
Market Breadth
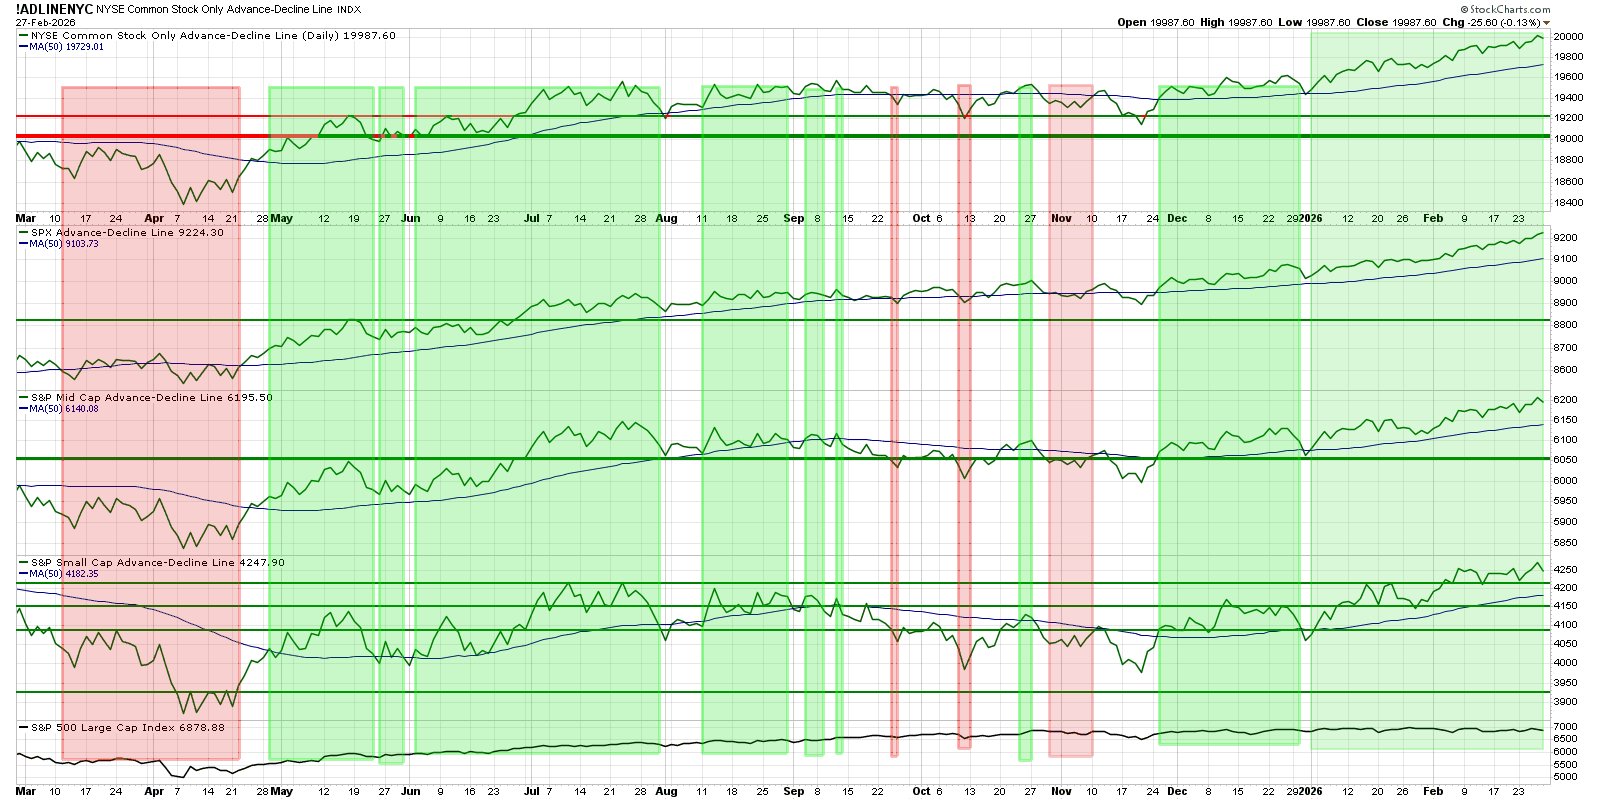
The S&P 500 price panel at the bottom is lagging the strength in these breadth lines at points. In other words, “Breadth is healthier than SPX price alone suggests.”
There has been a rotation into small and mid-caps and away from the richest mega‑caps, which can keep breadth strong even if the SPX itself grinds or chops; that favors selective stock picking and of course relative‑strength themes over broad index exposure.
SPY
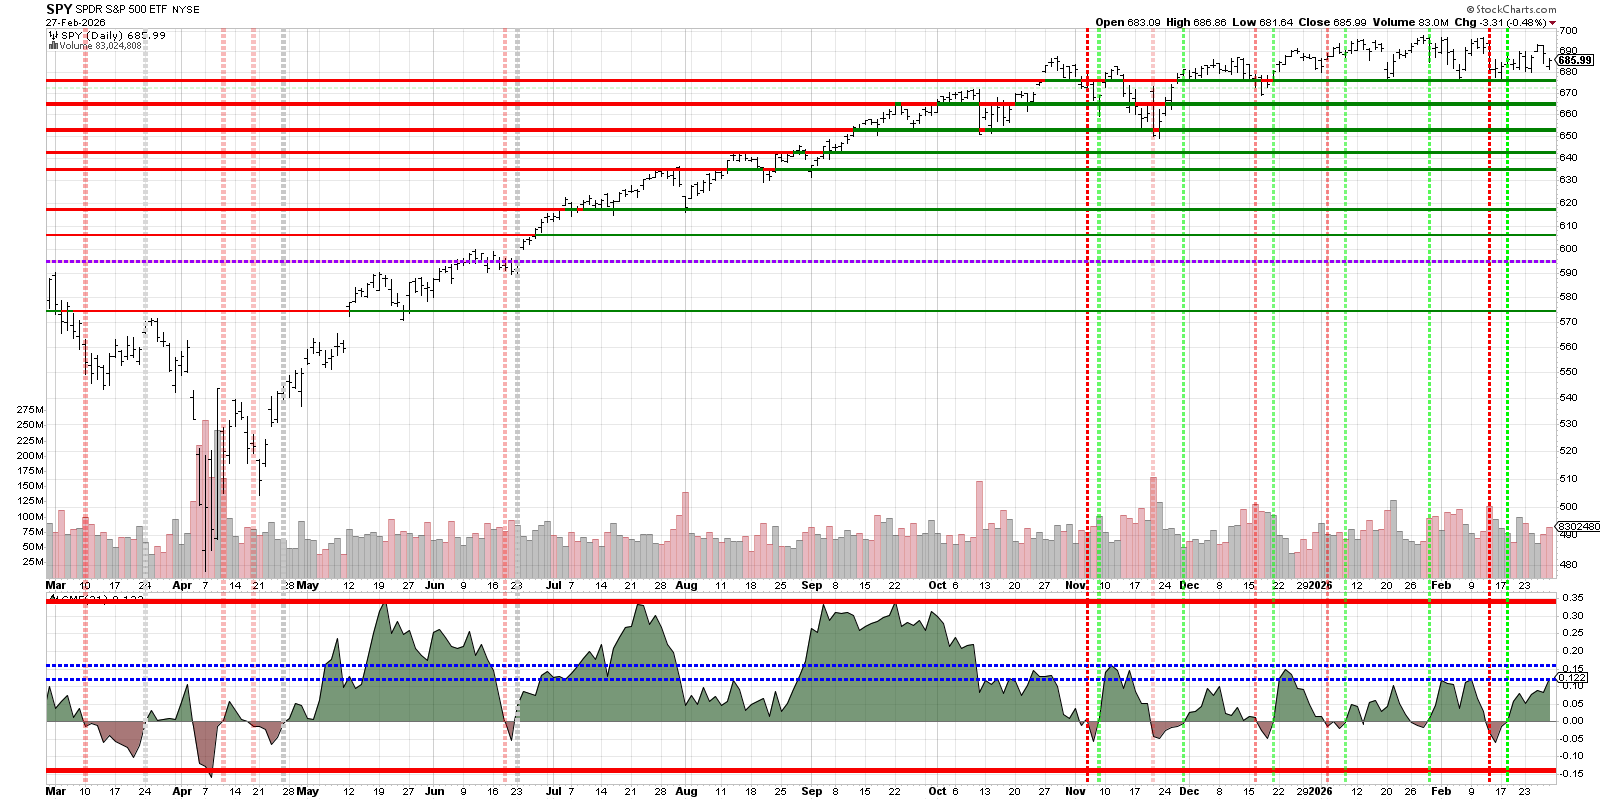
SPY remains in a primary uptrend but is in a short‑term digestion phase near highs, with clearly defined support zones below and a modest momentum pullback rather than a major top so far.
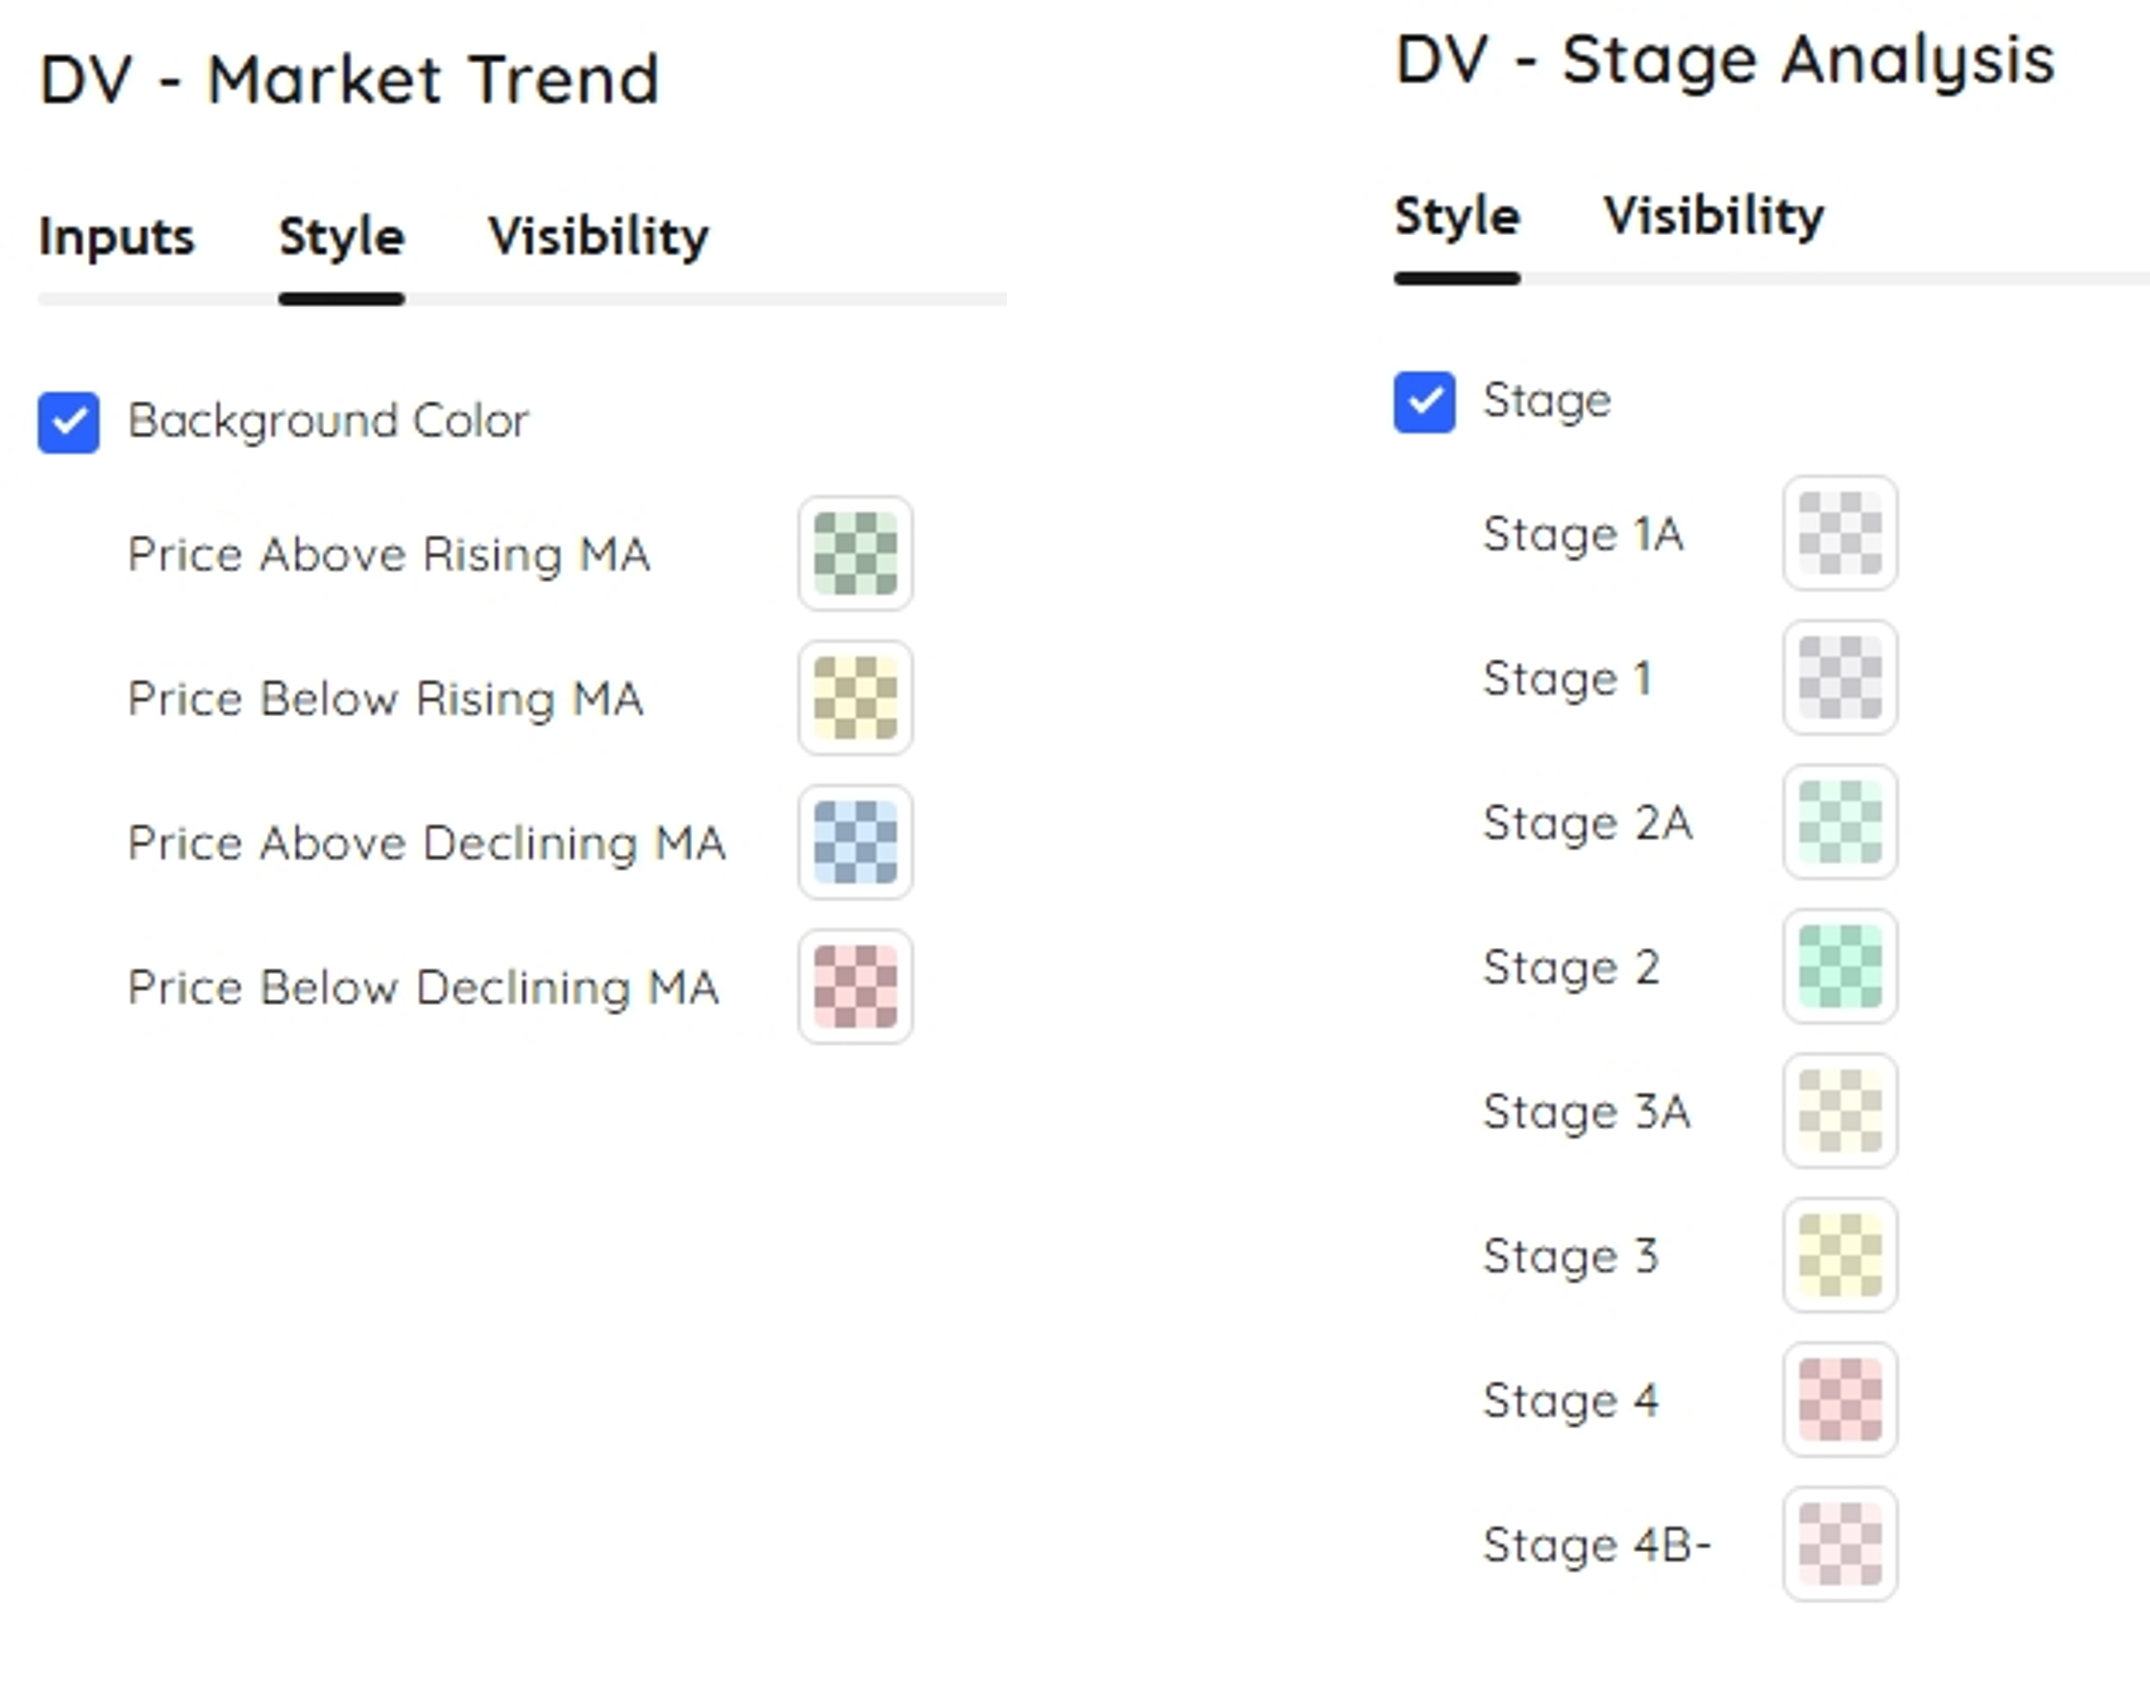
SPY Deepvue Market Trend
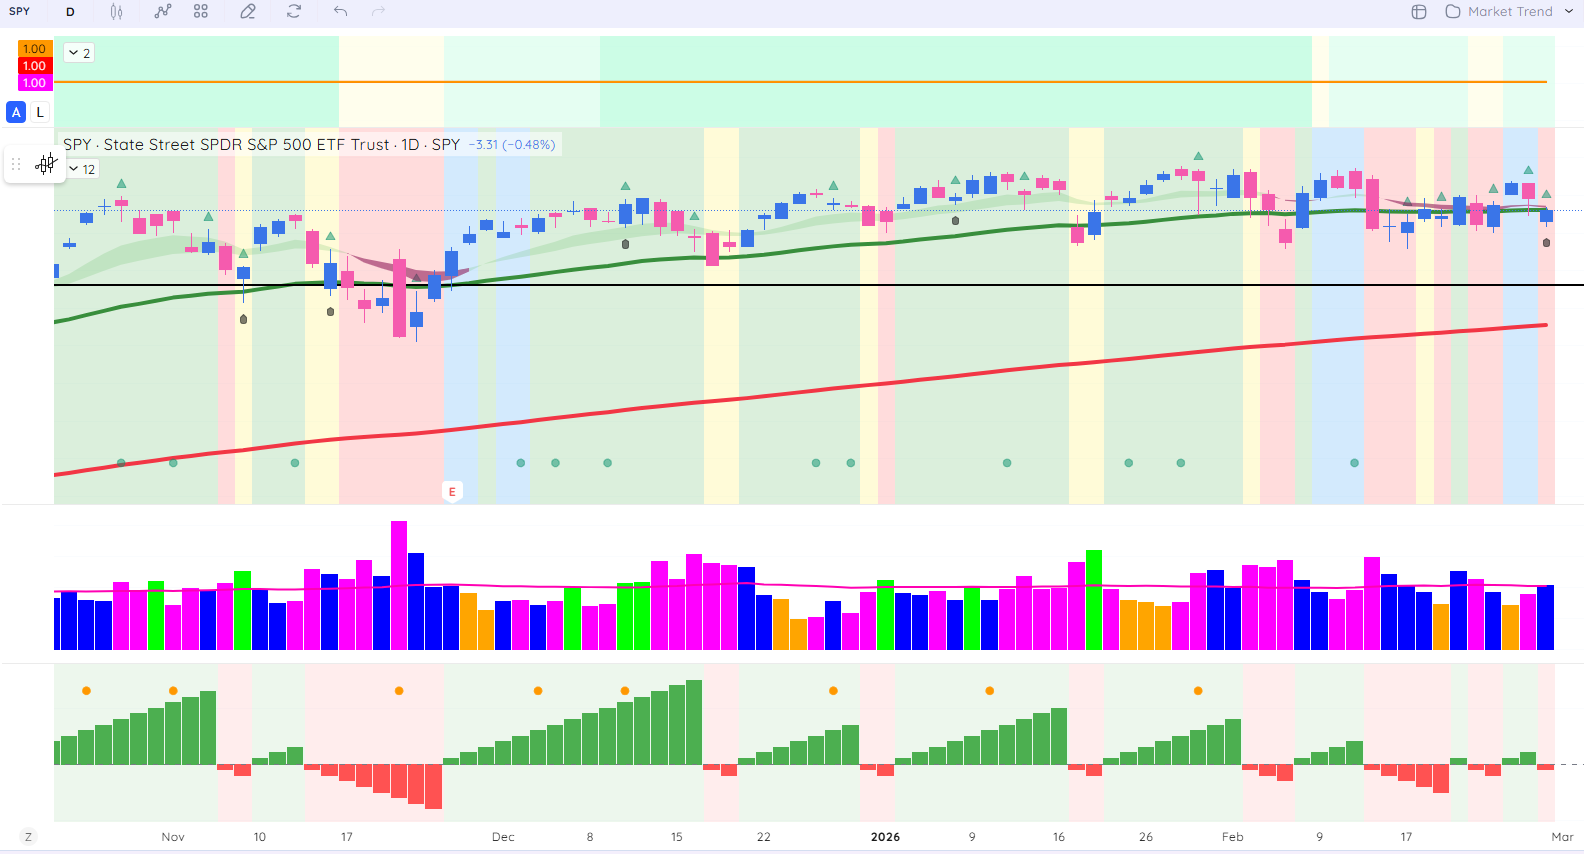
Cycles continue to start and break down. Also known as “Chop” to new traders…
SPY chart with Deepvue market trend analysis
We are somewhat green… We have a new cycle trying to start so we want to participate. I have my eye on a group of semi-conductors. Albeit we are only in stage 2A for the Weinstein Stage Analysis.
Weekly- Relative Rotation Graph (RRG)
This chart provides a relative strength and momentum snapshot for all S&P sector ETFs against the SPY over the 5-week period.
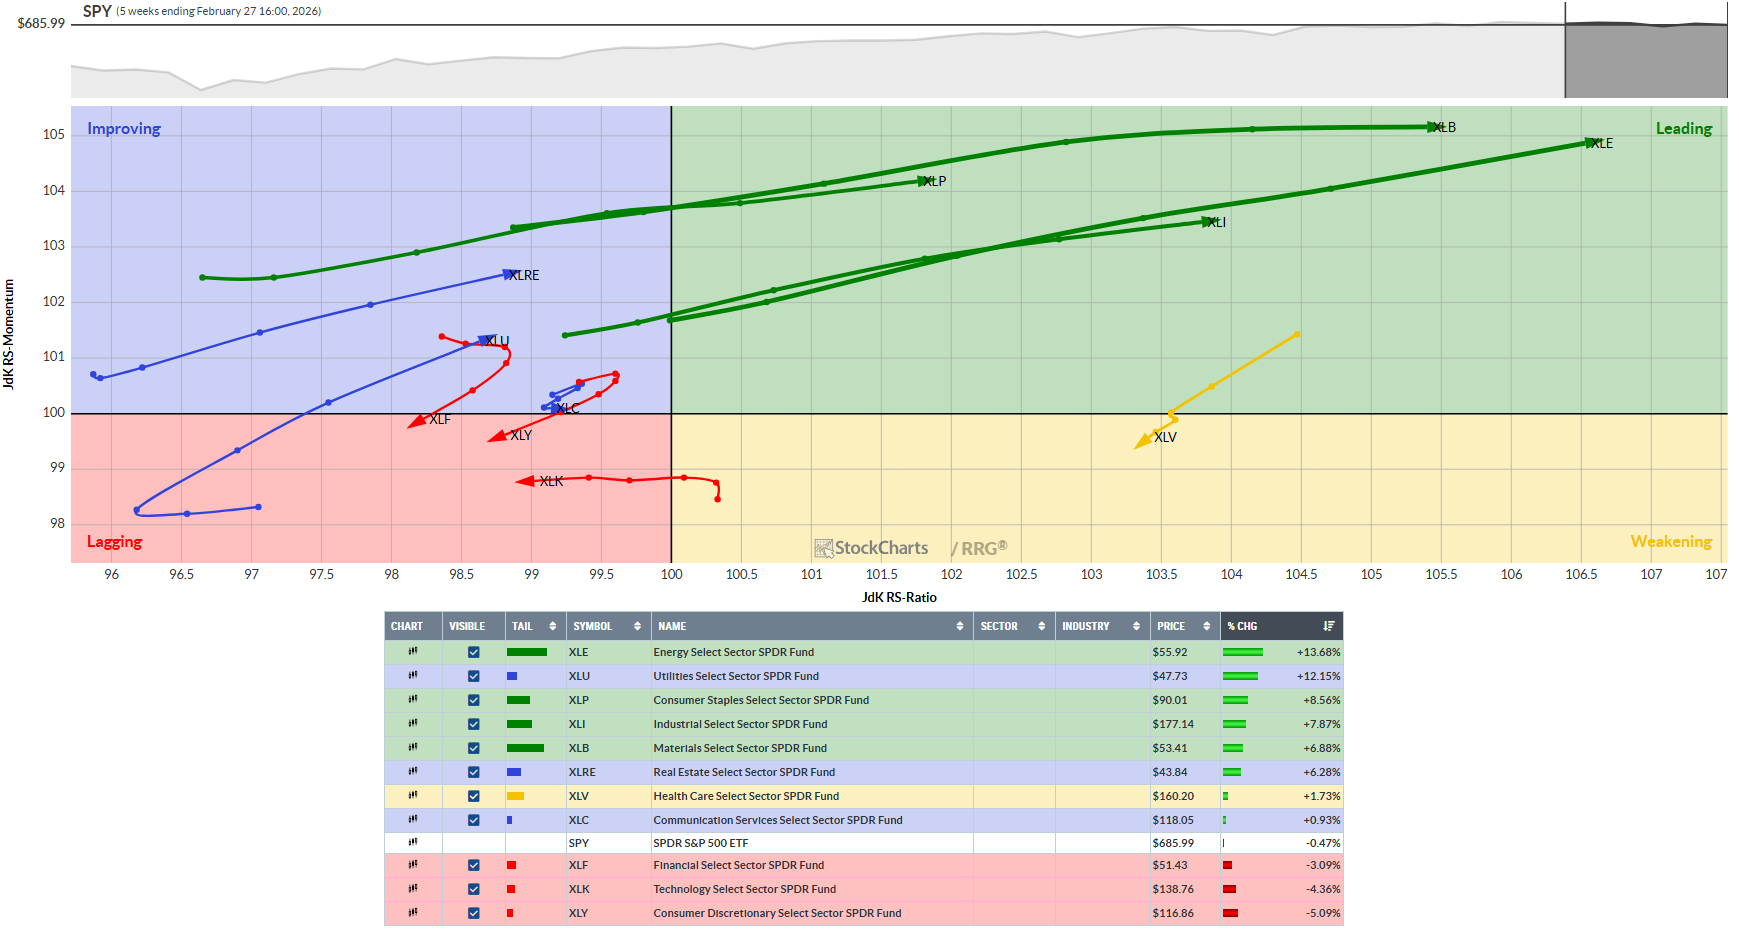
Theme bias: This favors energy, utilities, staples, industrials, and materials (defensive plus real‑economy), which aligns with a maturing bull or risk‑rotation tape rather than early‑cycle growth leadership.
Before we look further at the S&P 500 sectors, let’s look at the offensive versus defensive chart below…
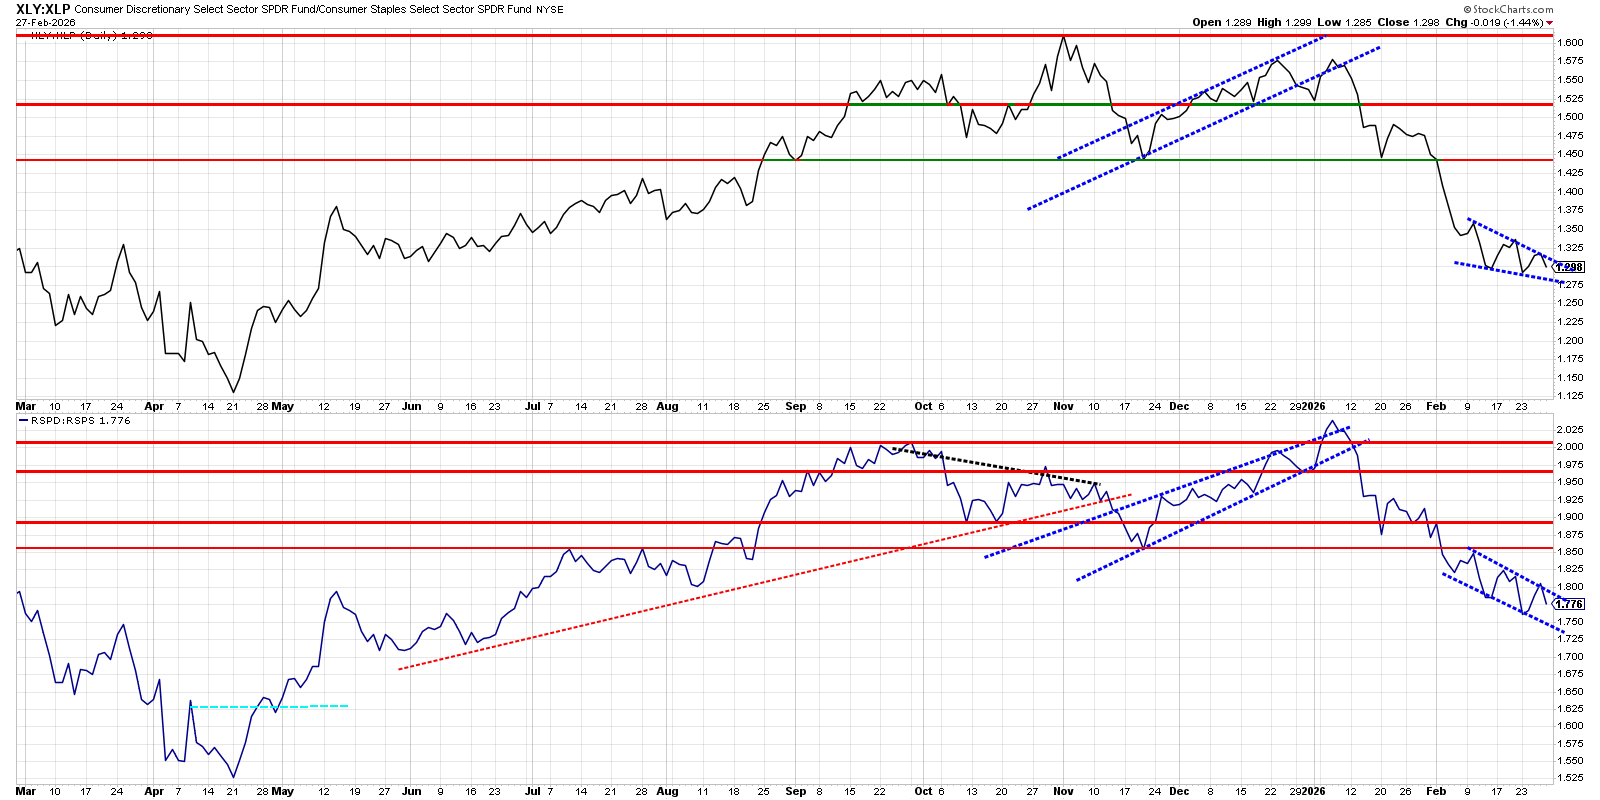
XLY vs. XLP and the equal‑weight RSPD vs. RSPS ratios are both in established downtrends, signaling a confirmed rotation out of consumer discretionary into staples/defense with no bottom yet in place. Watch XLY:XLP for the wedge break either way to play the move…
Growth versus Spy
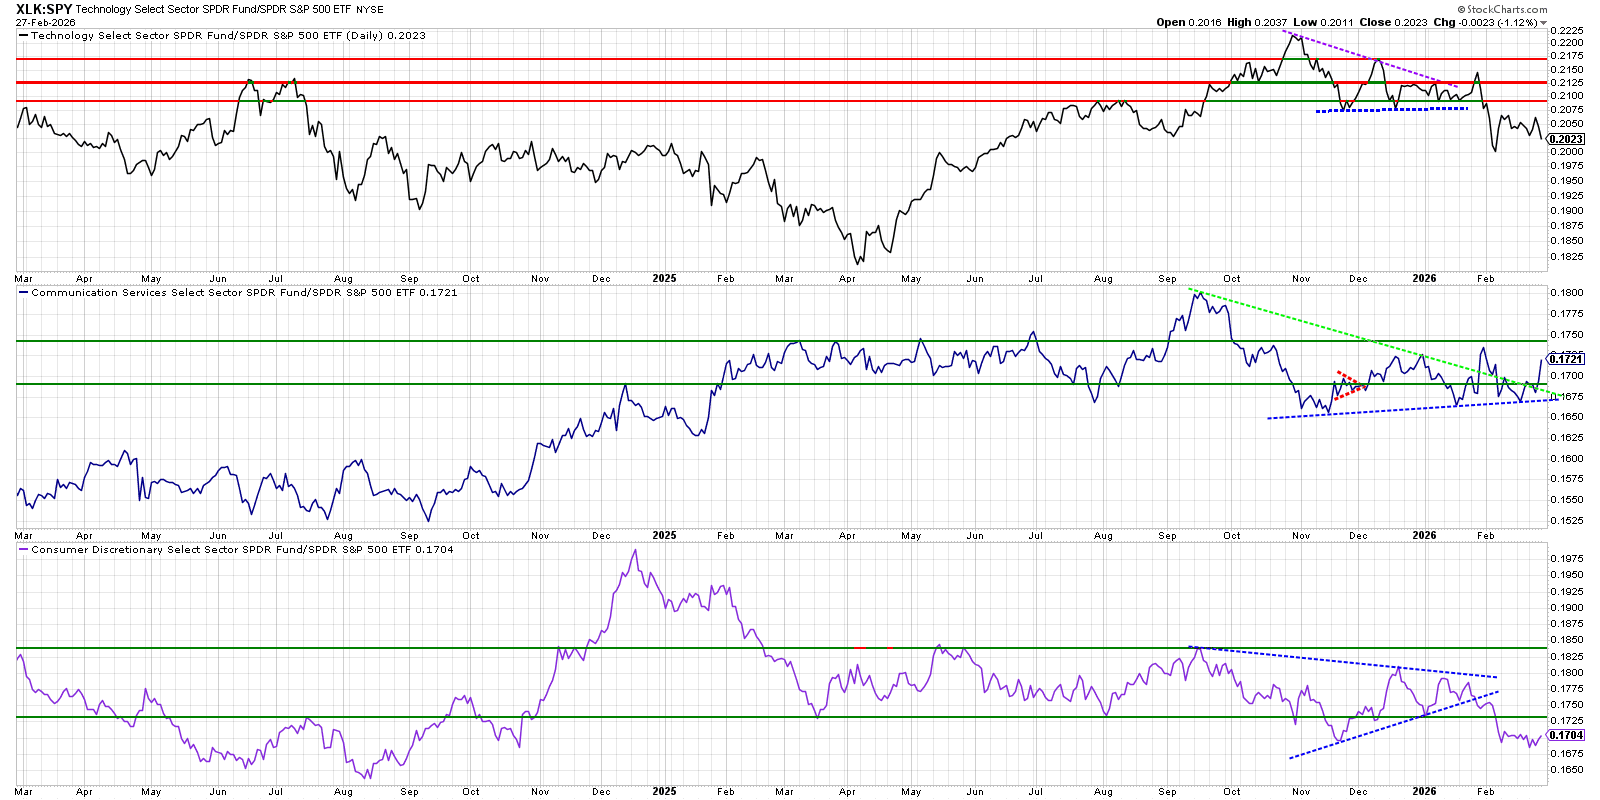
XLK has recently rolled over versus SPY while XLC is quietly improving and XLY continues to lag, so the relative-strength leadership within growth-y sectors is rotating away from mega-cap tech toward communications and away from consumer discretionary.
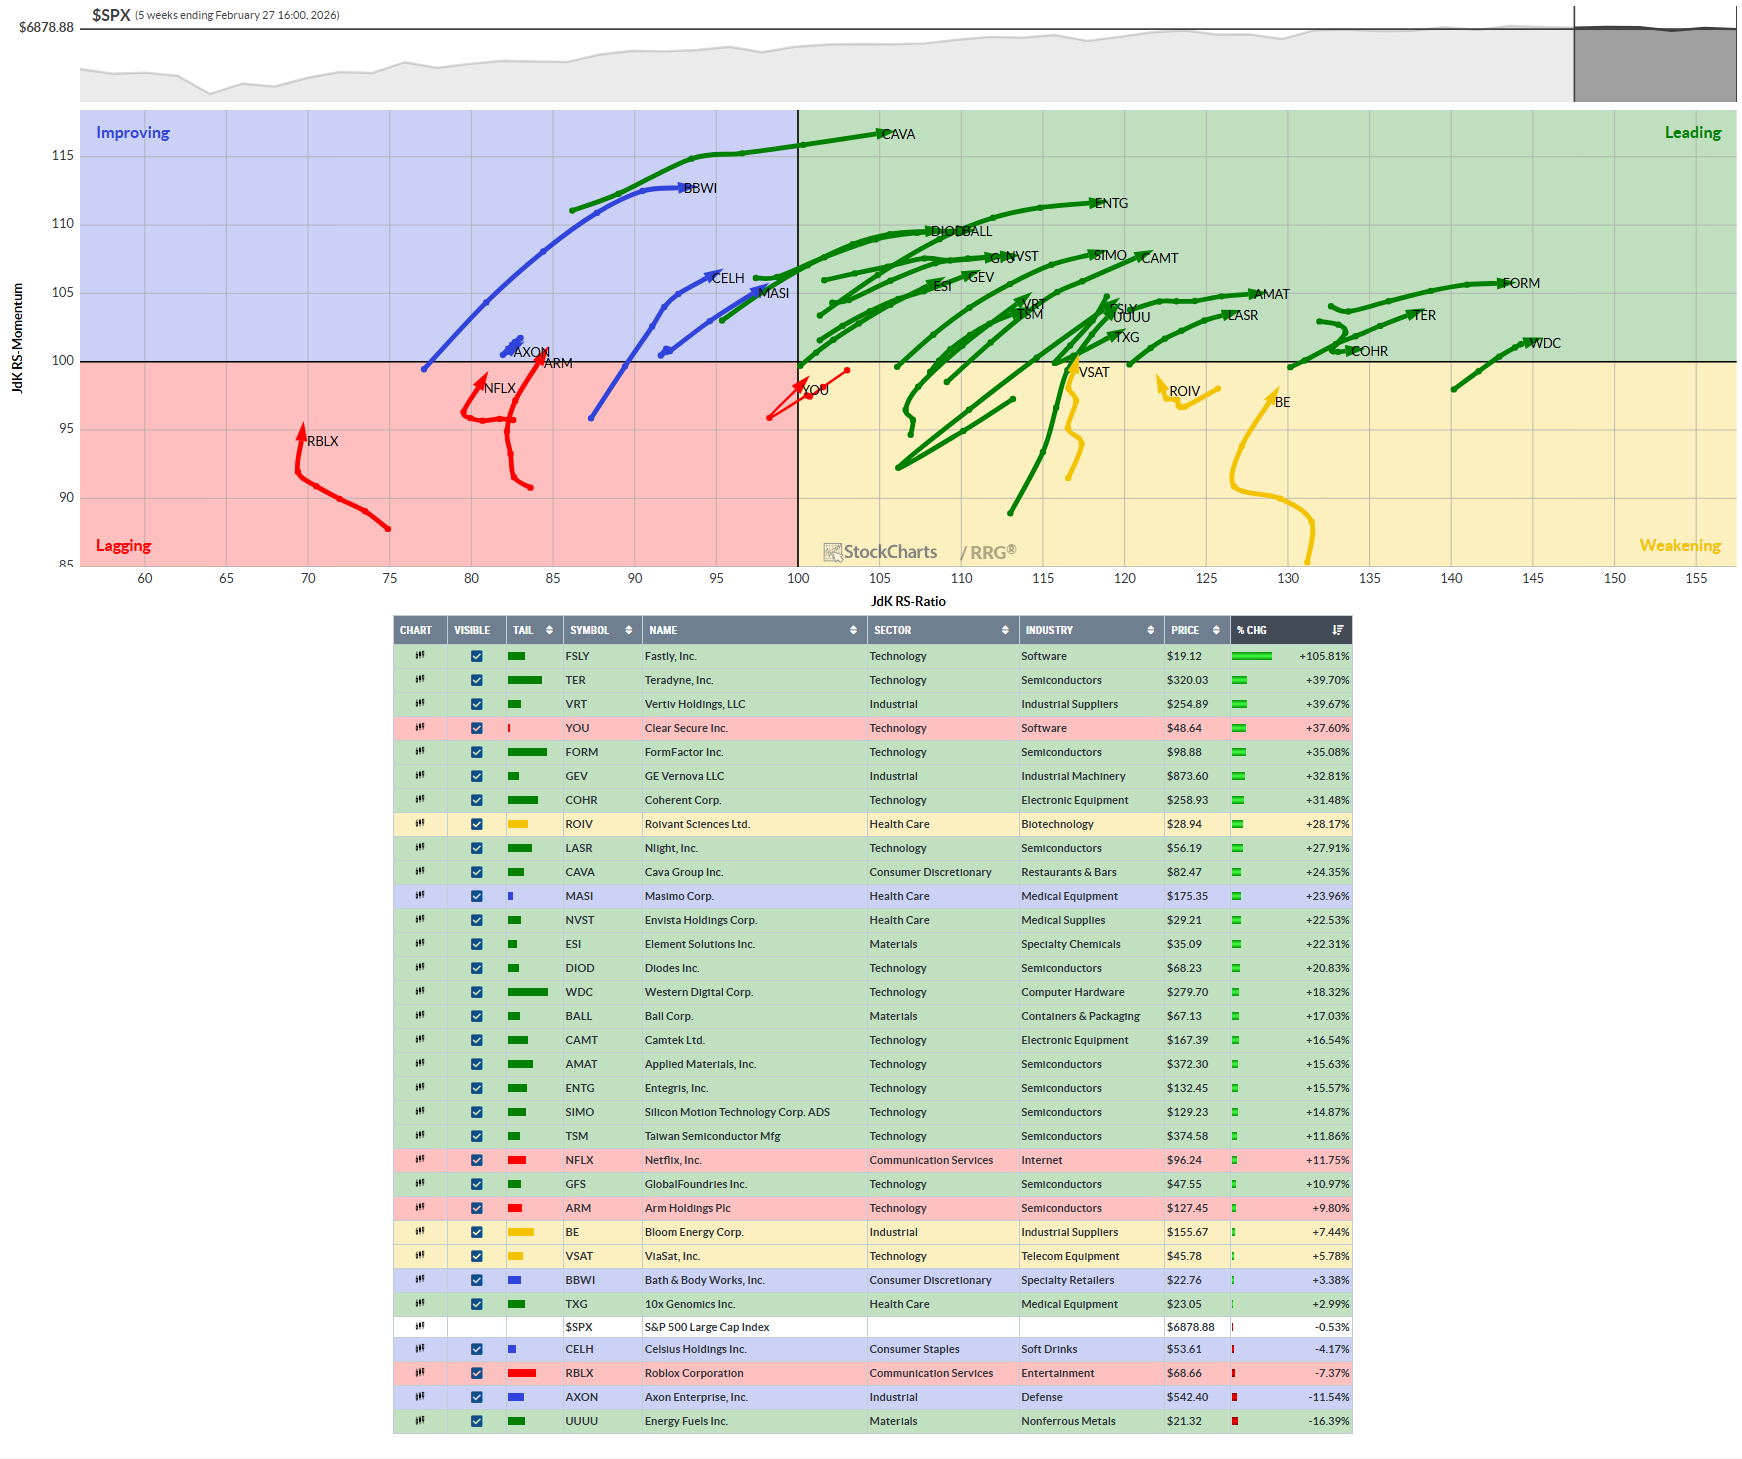
Growth with Bullish RRG: FSLY, TER, VRT, YOU, FORM, GEV, COHR, ROIV, LASR, CAVA, MASI, NVST, ESI, DIOD, WDC, BALL, CAMT, AMAT, ENTG, SIMO, TSM, NFLX, GFS, ARM, BE, VSAT, BBWI, TXG, CELH, RBLX, AXON, UUUU
Value versus SPY
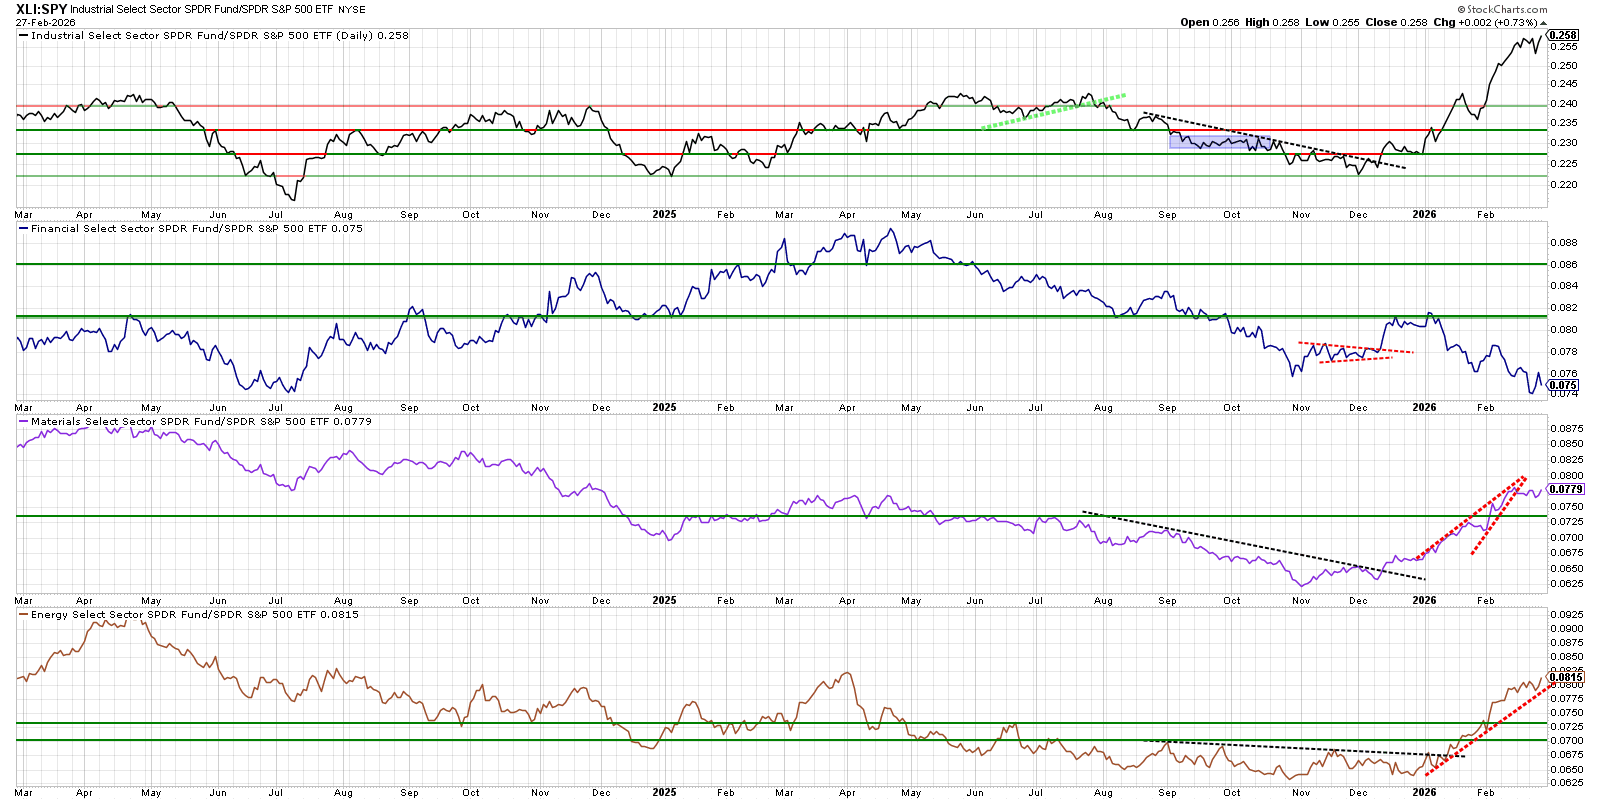
Industrials and Energy are emerging relative-strength leaders versus the S&P 500, while Financials and Materials continue to lag, with only early signs of potential stabilization in Materials.
Bullish Value RRG tickers 1st page: AGG, AEM, AGI, AMR, ARCH, ASR, AU, B, BALL, BCEI, BHP, BKR, BMO, BTG, CDE, CMC, CLMT, CNQ, CNR, COP, CRK, CVE, CVX, DINO, DVN, EOG, EQX, FCX, FNV, GFI, GLNCY, GOLD, HBM, HL, HMY, IAG, IMO, KGC, LAC, NGD, NEM, NEXA, NFGC, NGL, NOG, NRP, NTR, NUS, OXY, PAAS, PBR, PFE, PHYS, PKX, PNR, PPLT, PPLT, RIO, RRC, SBSW, SCCO, SGML, SJM, SJT, SLB, SMM, SSRI, SU, TECK, TRQ, VALE, VEDL, VLO, VMC, VZ, WPM, XOM
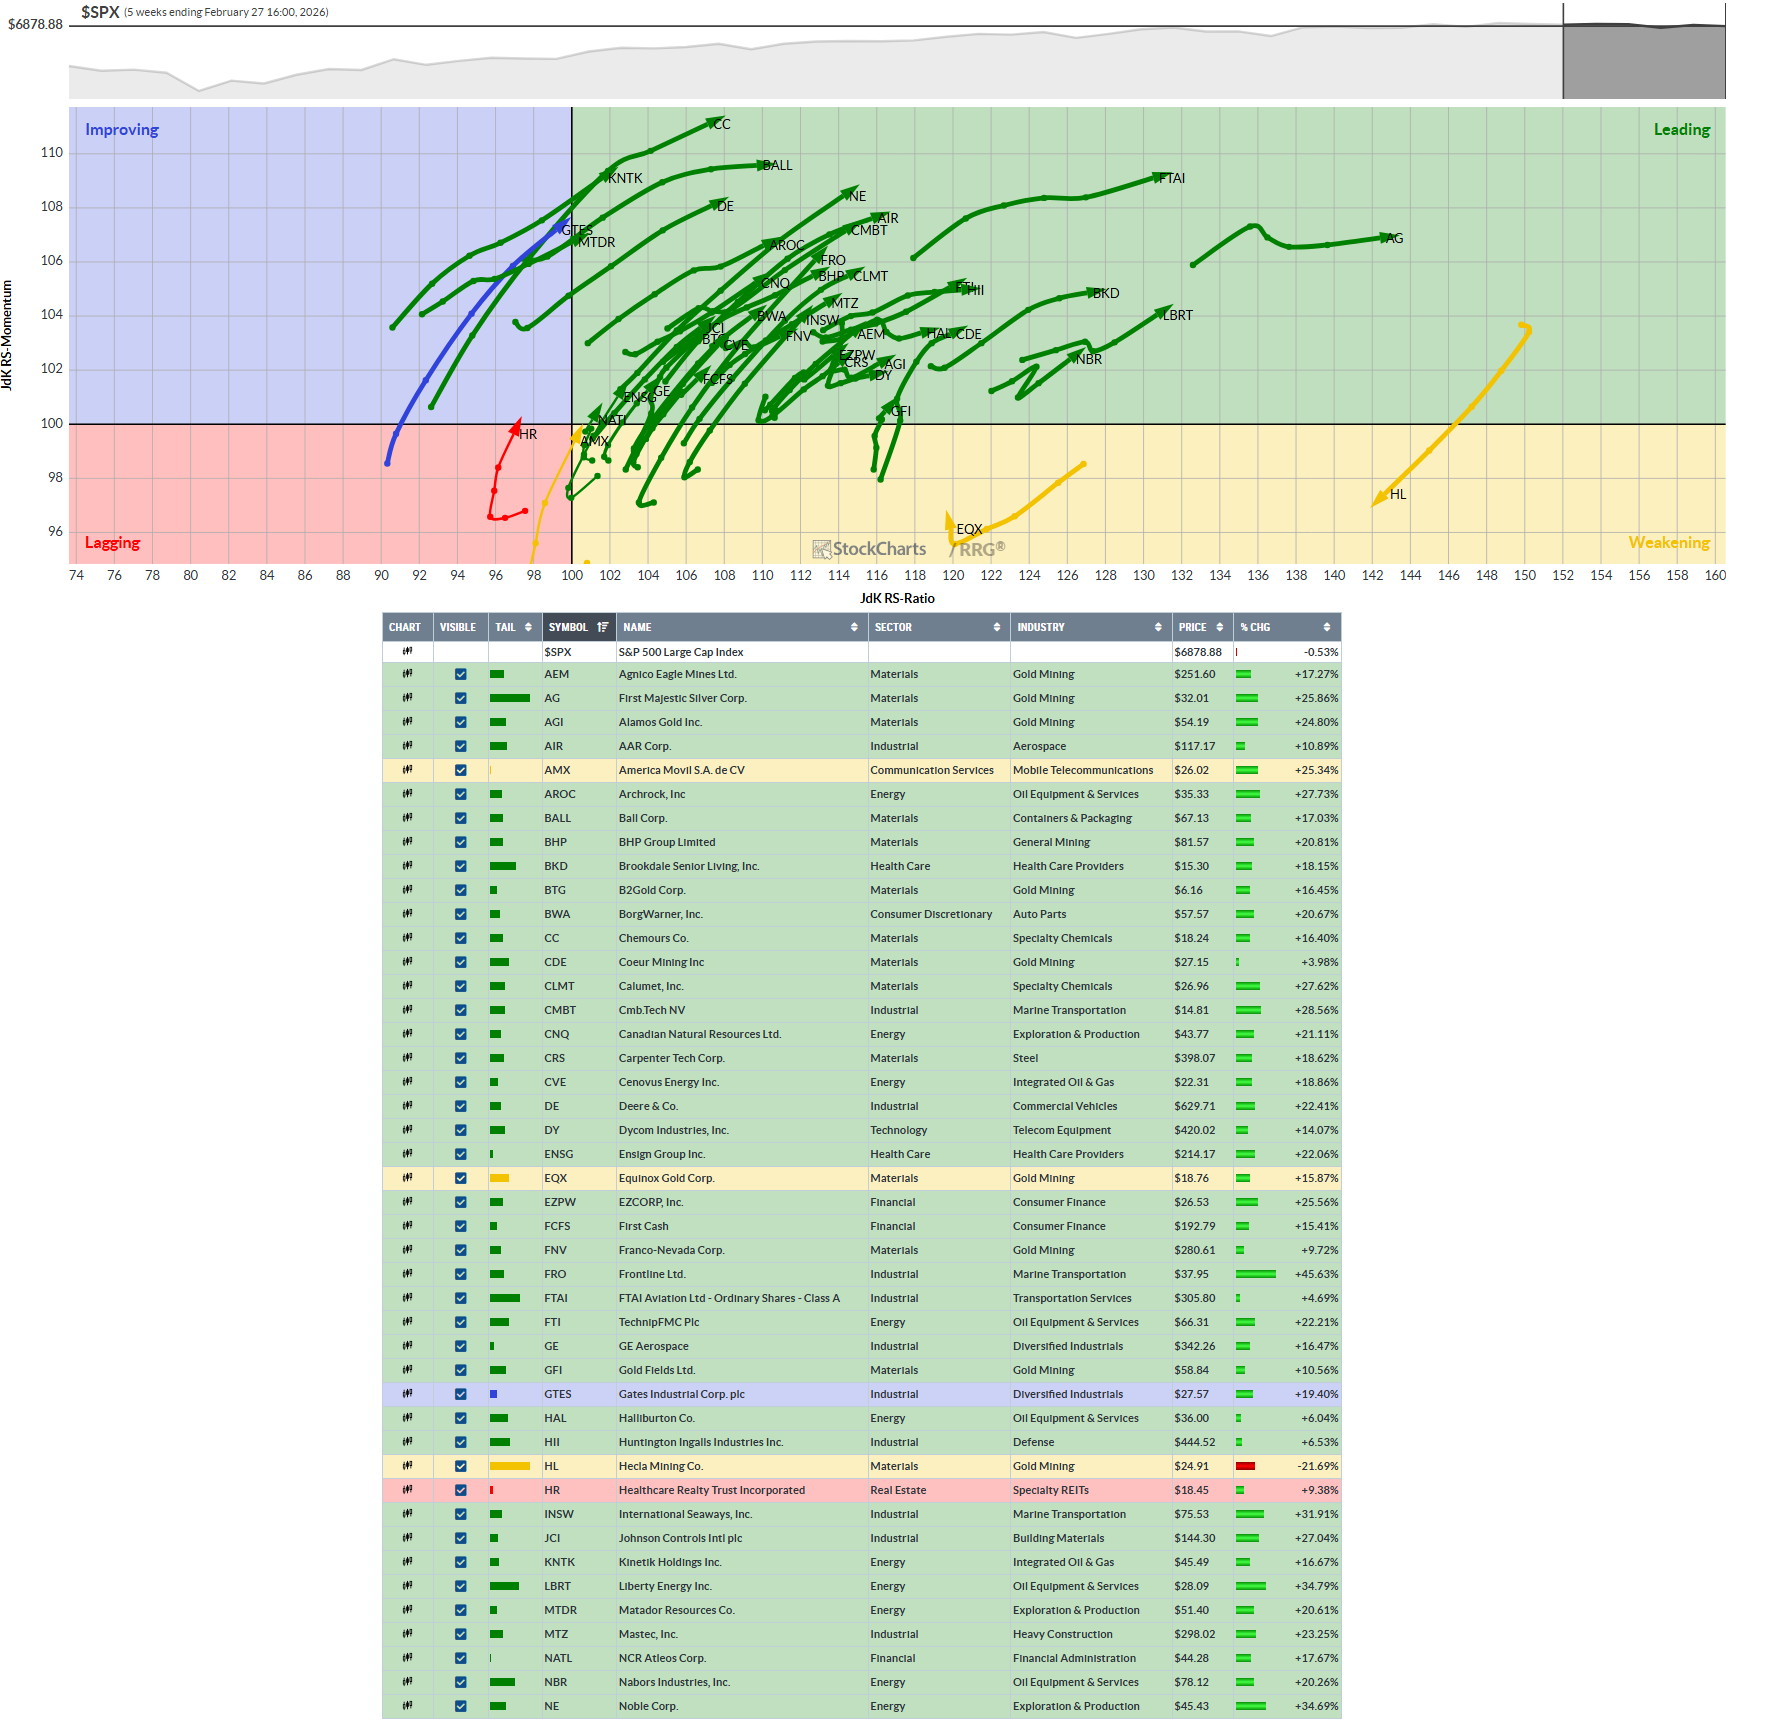
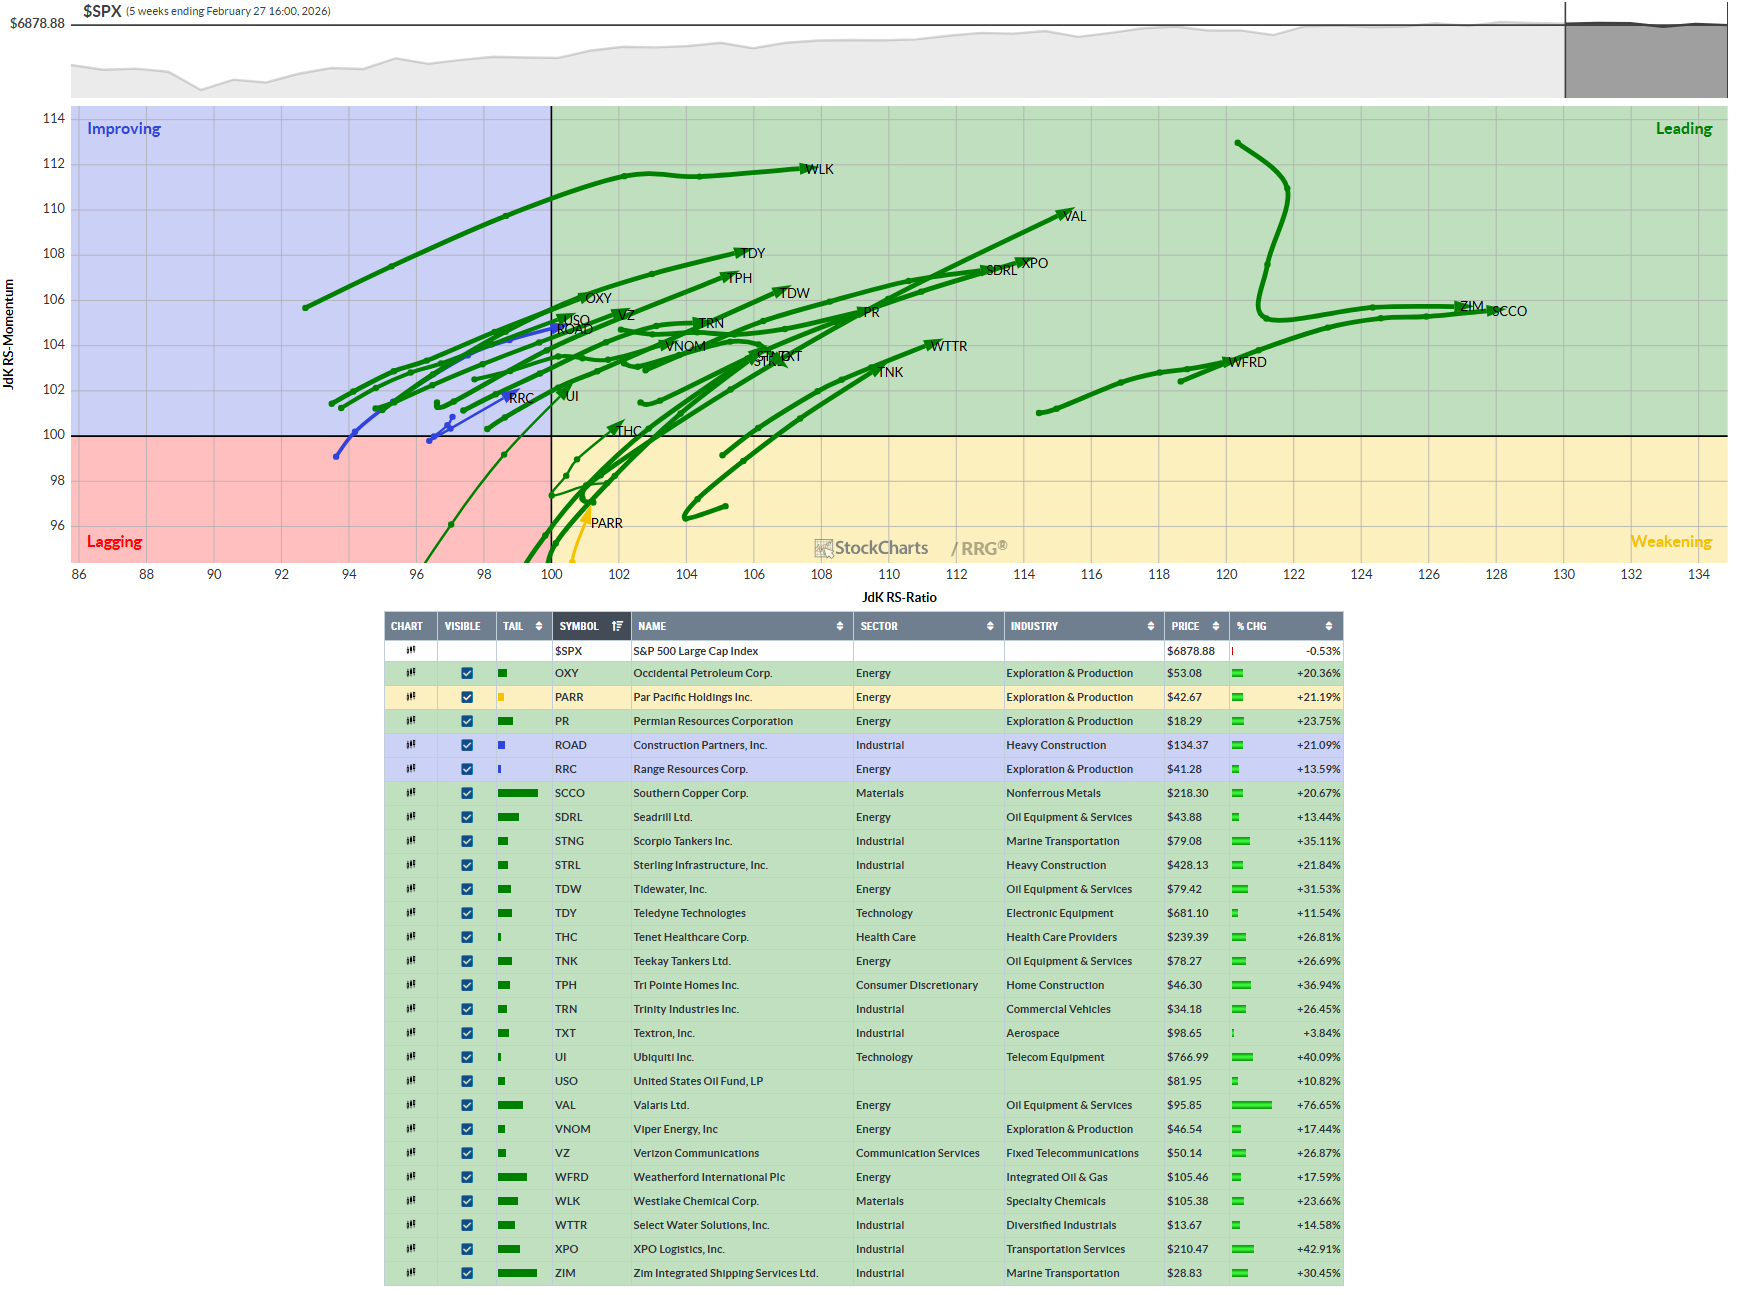
So many bullish Value RGG tickers we need two pages… There is a sentiment indicator in there somewhere, as they say…
Continuation of Value Bullish RRG tickers: SSPX, OXY, PARR, PR, ROAD, RRC, SCCO, SDRL, STNG, STRL, TDW, TDY, THC, TNP, TPH, TRN, TXT, UI, USO, VAL, VNOM, VZ, WFRD, WLK, WTTR, XPO, ZIM
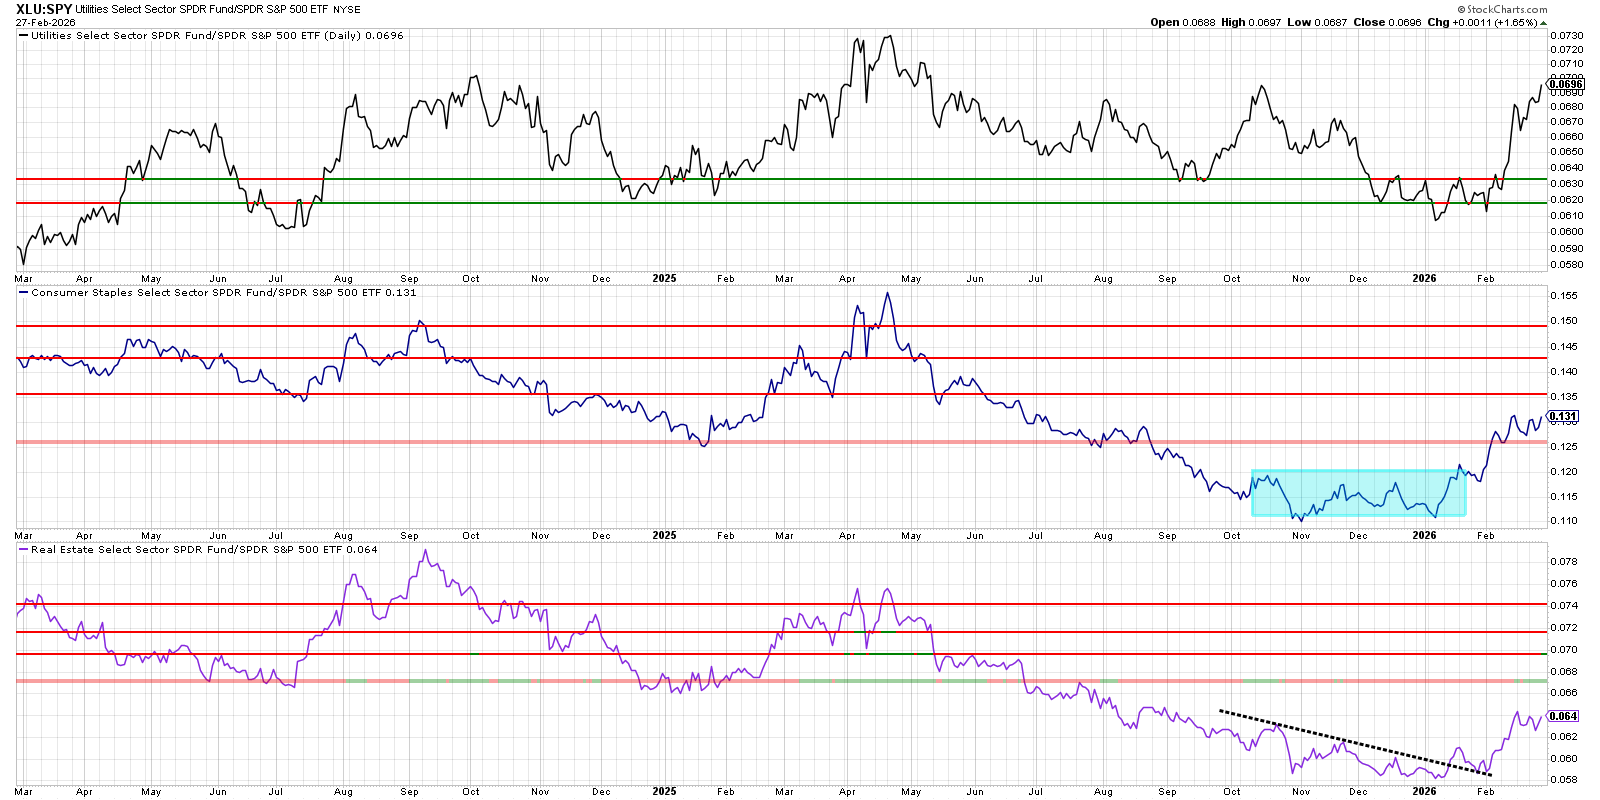
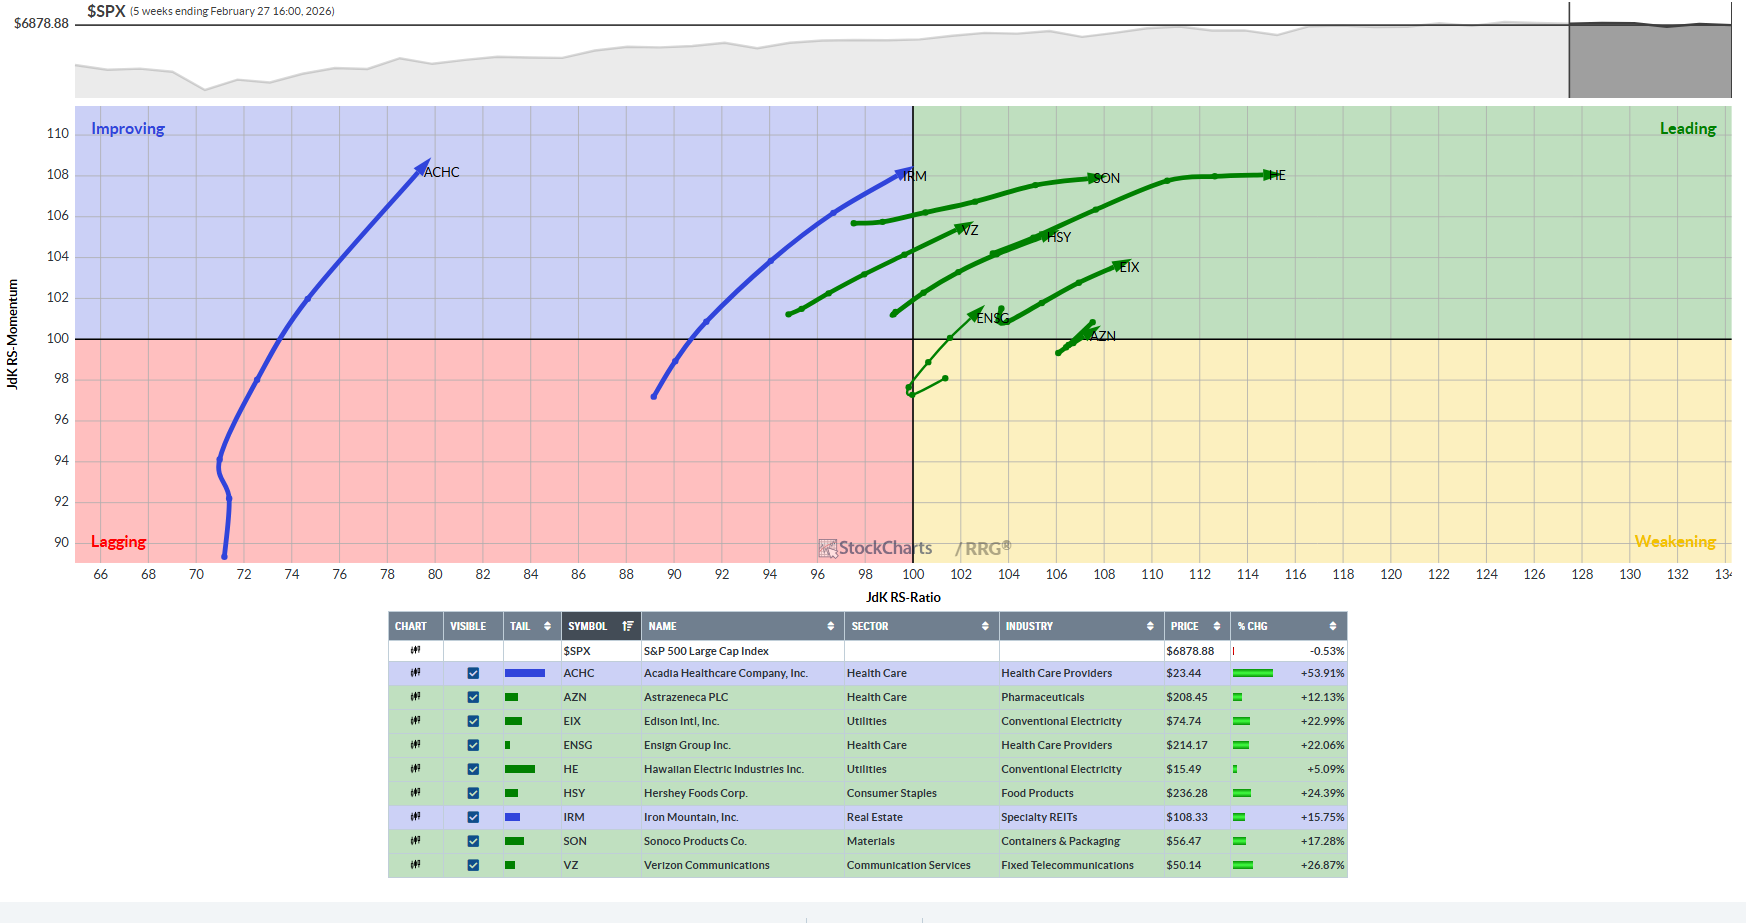
Defensives versus SPY
Trading takeaways:
Defensive sectors (Utilities, Staples) are gaining relative strength together, which often coincides with late‑cycle or risk‑off behavior in the broader tape.
Within that group, Utilities look extended but structurally strongest; Staples offer fresher breakouts from bases; Real Estate is still in repair‑mode.
Bullish Relative Rotation Graph (RRG) ETFs of note
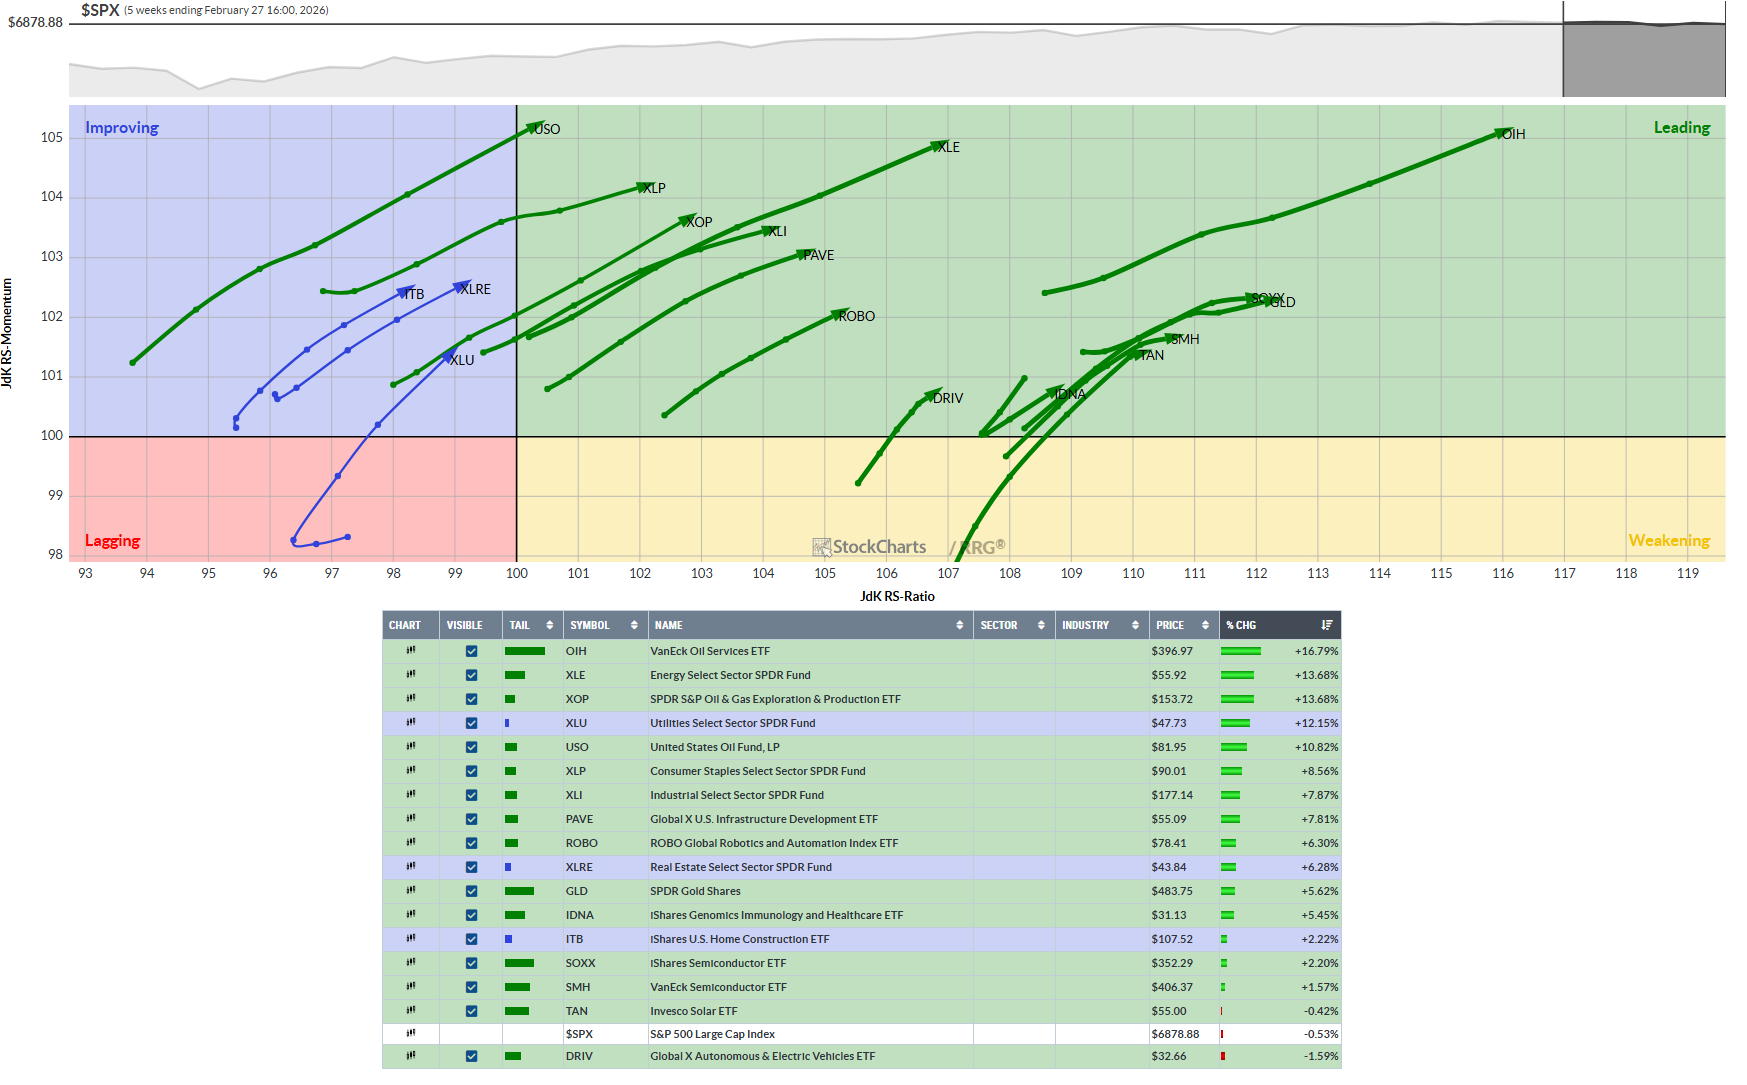
Bullish RRG etfs: XLRE, XLP, XLI, XLU, ROBO, PAVE, ITB, SOXX, SMH, TAN, DRIV, IDNA, USO, XLE, XOP, OIH, GLD

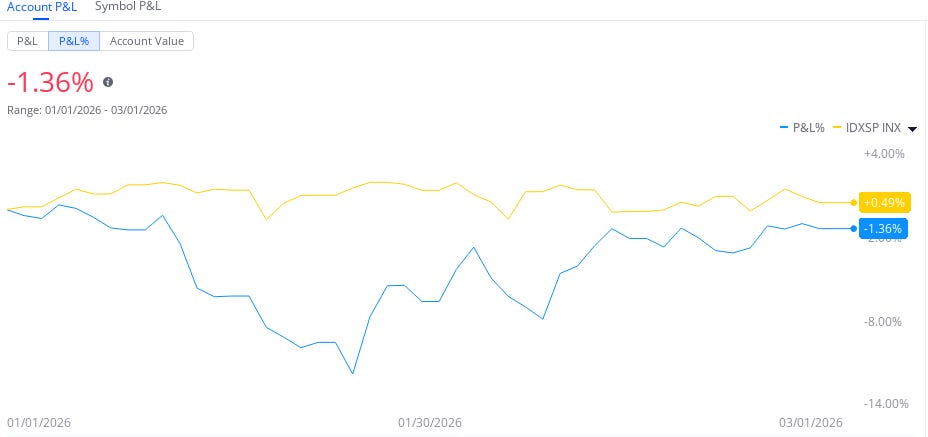
Thoughts this week: As you can see, I have recovered +10% in just over a month of trading. Wonderful recovery and feels great. Nothing to do but maintain my discipline. My process works; I just have to let it work and stay out of the way. I will catch that SPX and pass it next week. Still, plenty of year left. I’m currently all cash for the initial war chaos, sleeping well, and ready ride that price momentum, whichever way it wants to go.
You can do it, Keep Studying!
Most others don’t post their YTD because they can’t or frankly, they are lying. You better make sure, or you might lose it all…
Stock Talk Insiders discord
If you like this Phat Swing Plan, and you would like to receive alerts for my trades, click this link for the discord Stock Talk Insiders discord and enter the promo code: PHAT to get 10% off all packages for life...

Follow my alerts on Stock Talk Insiders discord Enter code: PHAT for 10% off
Follow my Phatstack for my Phat Swing Plan and updates during the week.
Follow me on X Phatinfantry Trading @Phatinfantry where I post/talk crap when I drink wine and make fun of dumb things.
Follow me on YouTube where I go through my process and review charts Phatinfantry
My $HYMC made the Silver Leaders.