
Phat Pullbacks for March 9th, 2026
Assisted with Trendspider Sidekick


I don’t work for Trendspider, but I love their platform…
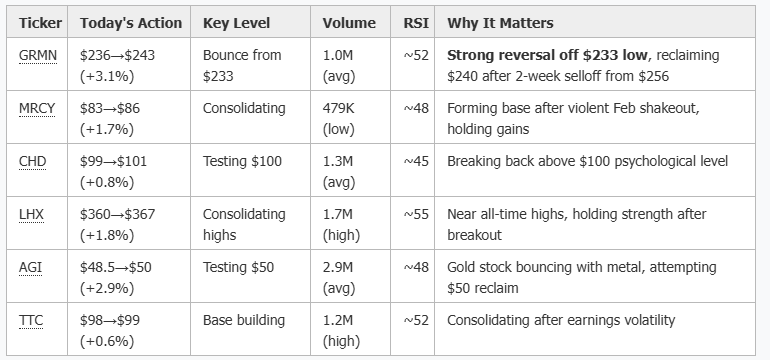
🔥 TODAY’S REVERSALS (March 6, 2026 EOD)
Primary Reversal Candidates - Watch Tomorrow
🔥 SECTOR ROTATION SIGNALS
⚠️ Defense/Aerospace Strength
LHX: +1.8% at new highs ($367)
MRCY: +1.7% recovering from Feb lows
Signal: Defense names showing resilience despite market volatility
⚠️ Precious Metals Bounce
AGI: +2.9% testing $50
NG: +2.6% testing $12
Signal: Gold stocks attempting reversal after recent pullback
Utilities/Staples - Mixed
ED: +1.5% at $112
NGG: -0.1% flat at $89.86
KMI: +0.6% holding $33.50s
Signal: Defensive sectors consolidating
⭐ TOP 5 SETUPS (Best Risk/Reward)
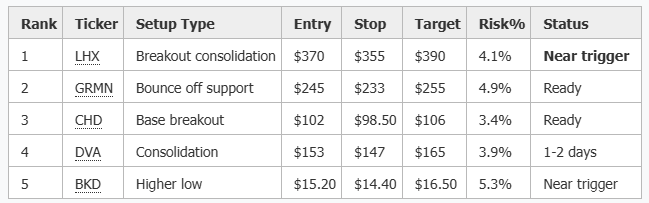
On watch for pullback buys Monday: GRMN, LHX, CHD, AGI
📊 DETAILED: TODAY’S REVERSALS
1. GRMN - Garmin ⚡⚡⚡
REVERSAL DATE: March 6, 2026 (TODAY)
What Happened Today:
Low: $233.64 (tested support zone)
Close: $243.48 (+3.1%)
Candle: Strong bullish engulfing, closed in top 30% of range
Volume: 1.0M (normal)
The Setup:
Prior high: $255.16 (Feb 2)
Pullback: -7.4% from high to $233.64
RSI: ~52 (healthy, room to run)
MA structure: Price above 20-day MA (~$246), testing it from below
Why It’s Early: This bounced hard off $233 support - the low from the Feb 18 earnings gap down. Day 1 of potential reversal.
Entry Plan:
Aggressive: Buy tomorrow if holds $240 and trends up
Conservative: Wait for break of $250 (Feb 27 high) with volume
Risk Management:
Stop: $233 (today’s low)
Position size: Normal - ATR ~5%
Target 1: $255 (prior resistance) = 4.5% gain
Target 2: $265 (measured move) = 8.5% gain
Earnings: None upcoming in next 10 days ✓
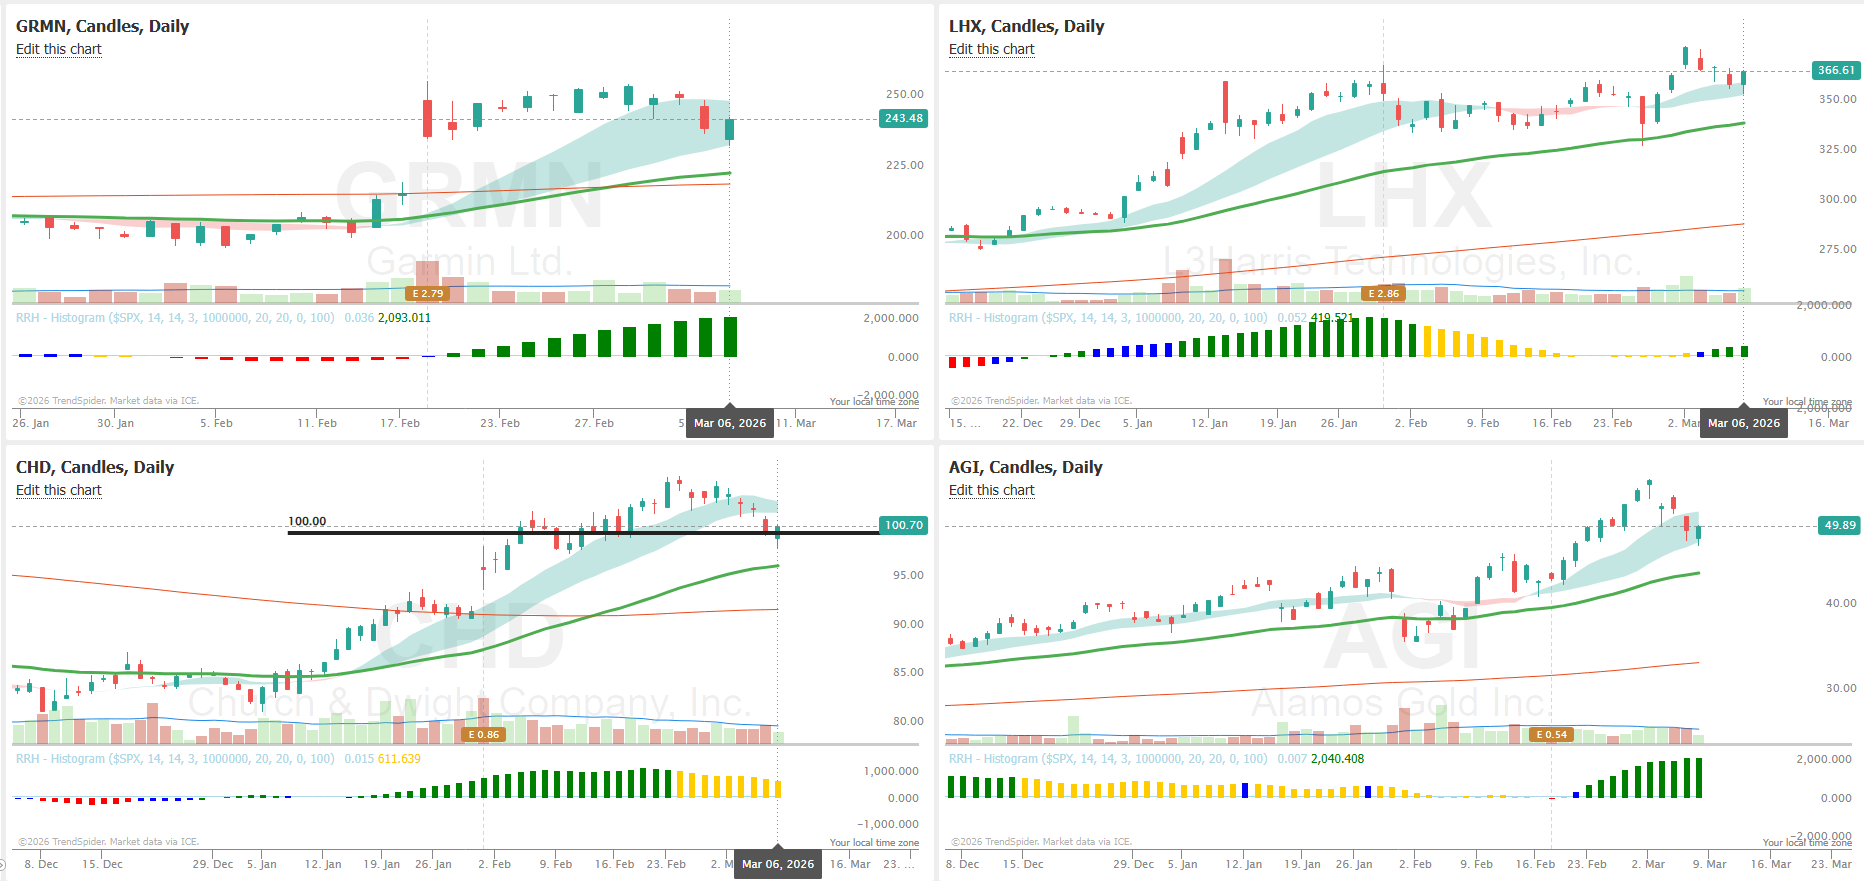
Here’s the full big picture for GRMN:
Price Action
Current price: ~$243 (last close Mar 6, 2026)
Stock gapped +17% on Feb 18 after blowout Q4 2025 earnings, from ~$217 to ~$257
Post-gap pullback has been orderly, consolidating in the $237–$255 range over the last 2 weeks
The weekly chart shows a clear uptrend since Oct 2024 (~$163 → $260+), though with two major drawdowns in between (tariff-driven Apr 2025 selloff to ~$169, and Nov 2025 correction to ~$186)
Relative performance vs S&P 500 (TechRank): jumped from the bottom 20th percentile in Jan 2026 to 75th+ percentile post-earnings — a significant shift
Earnings — Very Strong Beat History
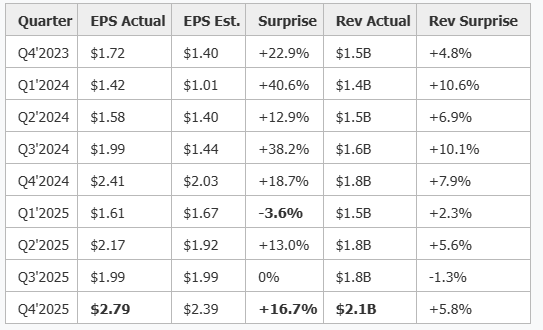
This is a remarkable beat streak. Nearly every quarter beats meaningfully. Q4 2025 was exceptional: EPS +15.8% YoY, revenue +16.6% YoY to $2.1B. The company guided FY2026 EPS at $9.35 (vs $8.70 consensus) and revenue $7.9B (vs $7.63B consensus) — both above expectations.
Fundamentals — Solid Quality Business
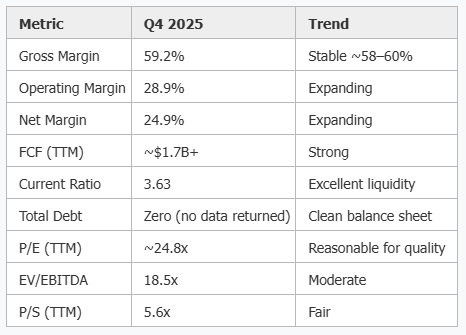
No debt, margins expanding, free cash flow ~$500M+ per quarter. This is a high quality business. The TTM P/E of ~25x is not cheap but is very reasonable given the growth trajectory and margin profile.
Analyst Sentiment — Shifting Bullish
Post-Q4 2025 earnings there was a notable re-rating:
Morgan Stanley upgraded from Underweight → Equal-Weight, PT $195 → $252 (Feb 19)
JP Morgan raised PT $250 → $265 (Feb 19, hold)
Tigress Financial raised PT $310 → $320 (Feb 20, buy — the most bullish)
Barclays upgraded from Sell → Hold, PT → $217 (Jan 16) — was still skeptical
MS and Barclays were persistent bears and both just capitulated — that’s notable
The majority of visible analysts are still at Hold or lower, meaning there’s room for further upgrades.
Shareholder Returns
17% quarterly dividend increase announced ($0.90 → $1.05/share)
New $500M buyback program through 2028 announced on Feb 18
Unusual Options (Last Week)
Mixed signals, nothing extreme:
A couple of call sweeps (June $240 CALL, Apr $240 CALL) — mildly bullish
One bearish sweep: Apr $220 PUT tagged as bearish ($61K premium)
Volume is relatively modest — no outsized conviction bets
Insider Activity
Post-earnings, there was a wave of insider selling on Feb 26 from multiple executives:
CEO Clifton Pemble: sold $5.0M
co-COO Patrick Desbois: sold $1.7M
CFO Douglas Boessen: sold $877K
EVP Matthew Munn: sold $1.3M
This happened right after a batch of fresh award grants on Feb 18 (earnings day) — so it reads mostly as routine sell-to-cover on new awards, which is a pre-planned pattern. Not alarming on its own, but worth noting the volume of selling near the gap-up high.
Big Picture Summary
GRMN is a high quality, debt-free industrial/consumer tech business that has been consistently beating estimates for 8+ quarters. The Q4 2025 blowout + strong FY2026 guidance triggered a massive re-rating, and even former bears (MS, Barclays) capitulated. The stock is now consolidating just below its all-time highs (~$261) after the gap.
Bull case: Expanding margins, no debt, clean FCF, guidance above consensus, analyst upgrades still coming through, dividend hike + buyback.
Bear case: Stock has rallied ~45% from the April 2025 lows and is near ATH. Post-earnings insider selling was heavy (though likely award-related). Options flow is mixed, not a strong conviction signal either way. The two remaining hold/sell analysts (Barclays $217, JP Morgan $265) represent potential headwinds if the market softens.

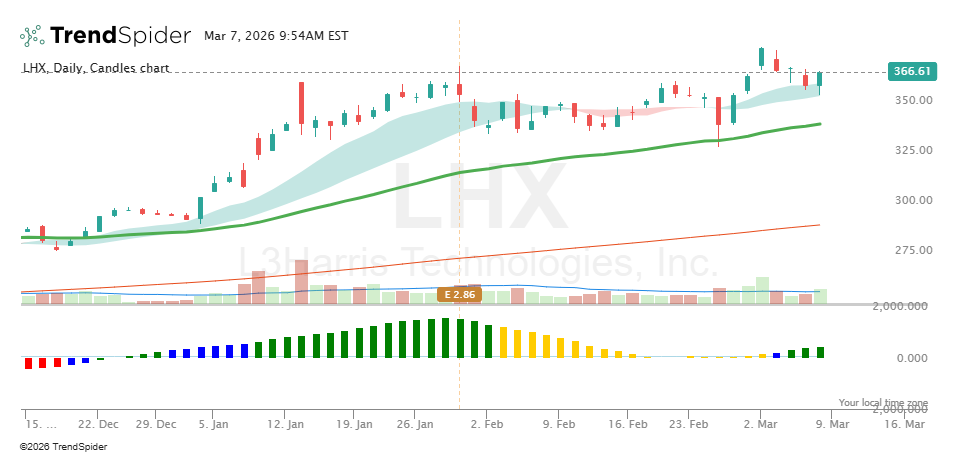
2. LHX - L3Harris ⚡⚡⚡⚡
REVERSAL DATE: March 3-6, 2026 (Consolidation at highs)
What Happened Today:
Range: $355-$367
Close: $366.61 (+1.8%)
Volume: 1.7M (elevated)
The Context: This is NOT a reversal - it’s consolidation after massive breakout. Price went from $340 to $378 in 2 days (Feb 27-Mar 2), now digesting gains.
Why This Matters:
Trading at new all-time highs zone
Defense spending thesis intact
Pullback to $360-$365 would be healthy entry
Entry Plan:
Wait for pullback to $360-$365 area
Or breakout above $380 confirms continuation
Risk Management:
Stop: $355 (below consolidation)
Target: $390-$400 zone
Earnings: None upcoming ✓
Here’s the full picture on LHX:
Business Overview
L3Harris is a major defense contractor — self-described as the “Trusted Disruptor.” Revenue is ~75% U.S. Government. Four segments (restructuring to three in FY2026): Communication Systems, Integrated Mission Systems, Space & Airborne Systems, and Aerojet Rocketdyne (propulsion/missiles). ~45,000 employees, $38.7B contractual backlog. Partnerships include Palantir, Anduril, and Amazon Kuiper.
Price Action
Current price: $366.61 (Mar 6 close), market cap ~$68.5B
YTD 2026: +~25% from $293.57 year-end close
From April 2025 lows (~$196): +~87% — a massive run driven by the broader defense sector re-rating
52-week high: $379.23 hit on March 2, 2026 — stock is ~3.4% off that high
The weekly trend is clearly strong uptrend from Q2 2025, with a sharp acceleration in Jan 2026 (earnings gap) and another leg higher early March
Note the Feb 25 shakeout — dropped intraday to $329.28 before recovering; that’s the key near-term support zone (~$329–$341)
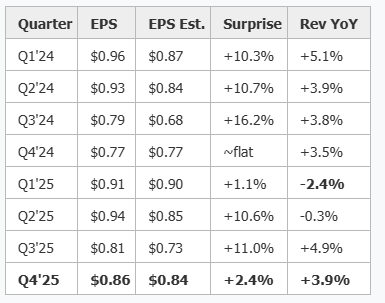
Earnings — Consistently Beating
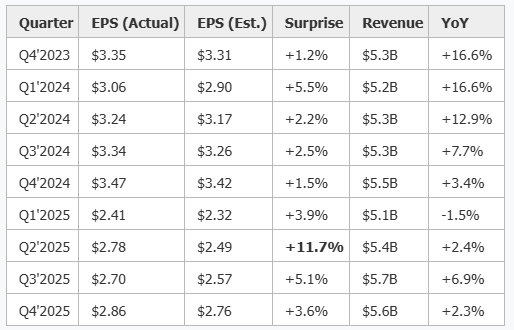
EPS beats every single quarter. Revenue is growing steadily. Note the GAAP EPS numbers (diluted) in the fundamentals are lower than reported — the big headline EPS is adjusted/non-GAAP. Don’t confuse the two.
One flag: Q4’2025 revenue of $5.6B came in below the $5.8B estimate (-2.2% miss). First meaningful revenue miss in a while.
Fundamentals
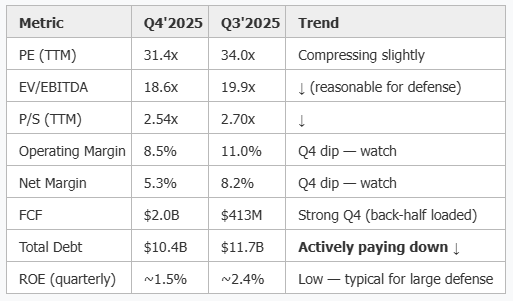
Debt has declined from $13.7B (Q1 2024) to $10.4B (Q4 2025) — meaningful deleveraging. The margin dip in Q4 2025 is worth monitoring heading into Q1 2026 reports.
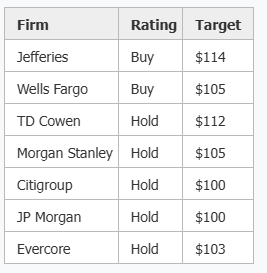
Analyst Ratings — Bullish Tilt, Rising Targets
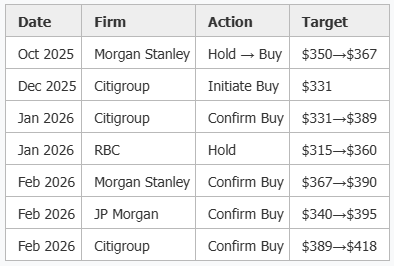
Consensus is overwhelmingly bullish. Highest target is $418 (Citi). Current price $366.61 implies ~14% upside to the highest target. Two firms (RBC, UBS) maintaining Hold.
Catalysts & News
US-Iran conflict (Mar 2): Defense stocks surged; LHX popped to 52-week high $379.23 on geopolitical tailwinds
Trump committed to quadrupling output of advanced weaponry — direct beneficiary
Feb 18: Won largest-ever full-rate production contract from General Dynamics Electric Boat (26 submarine shipsets)
Feb 17: ~$400M THAAD propulsion contract
Feb 10: Saudi Arabia defense collaboration agreement
“Golden Dome”/SHIELD vendor list: LHX included as a potential winner of large missile defense programs
Pete Hegseth visited LHX facilities (Feb 26) — direct DoD attention
Insider Activity
CEO Kubasik sold $23.2M in Sep 2025 and $4.3M in Nov 2025 — these are large cash sales, but both appear on a consistent schedule (annual/semi-annual cadence), not alarm bells
Multiple presidents sold ~$2M each on Mar 2 (right near the recent high) — could be planned, but timing is notable
Feb/Mar 2026: Broad annual compensation awards issued across management team — normal compensation cycle
Big Picture Summary
LHX is in a powerful uptrend driven by a multi-year defense spending cycle, geopolitical tensions, and consistent earnings beats. The business is solid — $38.7B backlog, actively deleveraging, and winning major new contracts. Analyst community is bullish with rising price targets.
Key things to watch:
Q4’2025 revenue miss ($5.6B vs $5.8B est.) and Q4 margin compression — need to see whether that’s a one-quarter blip or a trend
$379 52-week high is near-term resistance; a clean break would be a continuation signal
$329–$341 zone is the nearest meaningful support (Feb 25 spike low)
Multiple insiders selling at/near current levels — not necessarily alarming given award cycles, but worth noting
Defense sector is trading rich right now on macro tailwinds; any geopolitical de-escalation could pressure the group
3. CHD - Church & Dwight ⚡⚡
REVERSAL DATE: March 6, 2026 (TODAY)
What Happened Today:
Low: $98.40
Close: $100.70 (+0.8%)
Candle: Reclaimed $100 level
The Pattern: Testing $100 psychological resistance after pullback from $106 (Feb 27). This is a staple/consumer defensive that’s been in choppy range.
Entry Plan:
Trigger: Break above $102 confirms
Stop: $98.50
Target: $106 (prior high)
Why It’s Interesting: Clean support at $98-$99, and staples showing relative strength vs growth stocks lately.
Earnings: None upcoming ✓
CHD — Church & Dwight | Big Picture Summary
🏢 Business
Church & Dwight is a mid-cap consumer staples company (~$23.8B market cap) built around household and personal care brands. Seven power brands (ARM & HAMMER, OXICLEAN, BATISTE, WATERPIK, THERABREATH, HERO, TOUCHLAND) drive ~70% of sales and profits. Revenue is split roughly 77% Domestic / 18% International / 5% Specialty.
Key 2025 moves:
Acquired Touchland (hand sanitizers, ~$815M total consideration) — July 2025
Divested VitaFusion/L’il Critters (VMS business) — Dec 31, 2025
Exited Flawless, Spinbrush, Waterpik showerhead businesses — taking ~$46M pre-tax charge
Portfolio is being actively repositioned toward faster-growing premium/value lines.
Walmart represents ~23% of net sales — a notable customer concentration risk.
📊 Price Action
52-week high: ~$116.46 (Mar 2025). Stock is ~13.5% off those highs.
Jan 2026 low: ~$82.64 — stock has since rallied ~21.8% off that low.
The Jan 30 earnings report was the key inflection: stock gapped up sharply and has held the move.
Current price (~$100.70) is consolidating in the $99–$105 zone for the past few weeks. A mild, orderly pullback from the $105 post-earnings peak.
📈 Earnings
Every single quarter has beaten estimates on EPS. Consistent beat machine.
Revenue growth slowed and even went negative in H1 2025 (partly due to divestitures/exits), but organic business is recovering. The beat streak is intact.
Q1 2026 guide: EPS $0.92 vs $0.96 estimate — below consensus. Management issued a cautious near-term guide even while beating Q4. FY2026 adjusted EPS guide: $3.71–$3.81 vs $3.73 est — roughly inline.
💰 Dividend
Quarterly dividend raised to $0.3075 (announced Jan 30, 2026) — up from $0.295.
Yield ~1.2–1.4% — modest but growing. Consistent raiser.
🎯 Analyst Sentiment
Post Q4 earnings (Feb 2), a wave of target upgrades:
Mixed: bulls (Jefferies, Wells Fargo) are still more constructive, but most of the Street is parked at Hold. Barclays and Citigroup held sell/neutral below-market targets as recently as Nov 2025.
🏃 Relative Performance vs Sector
CHD went from outperforming only ~40% of Consumer Discretionary sector peers in early Dec 2025, to outperforming ~85% as of Mar 6, 2026. That’s a dramatic shift — driven by the Jan 30 earnings catalyst. The stock is now a sector leader on a trailing-quarter basis.
👔 Insider Activity
August 2025: CEO (Dierker) bought $500K in open market shares. Two EVPs also made open-market buys. This was at ~$91–$93 — looks like conviction buying near the lows.
Routine awards: ongoing small equity awards across the executive suite — normal.
Feb 4, 2026: Director Janet Vergis sold $1.3M in shares — the only notable open-market sell. Post earnings, so likely opportunistic.
Mar 2, 2026: Large wave of annual equity awards to all executives — normal annual comp grants.
Overall insider picture: mildly bullish — the August open-market buying by the CEO and multiple EVPs near the lows stands out.
🗺️ Big Picture Summary
Bull case: Consistent earnings beater with a clean portfolio (post-divestitures), sector-leading relative performance, strong brand portfolio (#1 positions across multiple categories), CEO buying the dip, and analyst targets pointing 10%+ higher. International growth is a real driver. Touchland acquisition adds a fast-growing premium brand.
Bear case / Risks: Revenue growth is uninspiring (flat to low single digits). Q1 2026 guide was below consensus. Walmart concentration (~23% of sales) is a structural risk. Price is now up ~21% from the Jan lows and sitting right at the lower-end of analyst target range — limited near-term upside per sell-side. Most analysts are Holds. Macro consumer spending slowdown could hurt discretionary-adjacent categories.
Technical: Price is in a ~$99–$105 consolidation zone after the Jan 30 gap. Weekly trend is recovering but has not reclaimed the $110+ levels from early 2025. Watch $99 as near-term support and $105–$107 as near-term resistance.

4. AGI - Alamos Gold ⚡⚡
REVERSAL DATE: March 5-6 (attempting reversal)
What Happened Today:
Low: $47.50
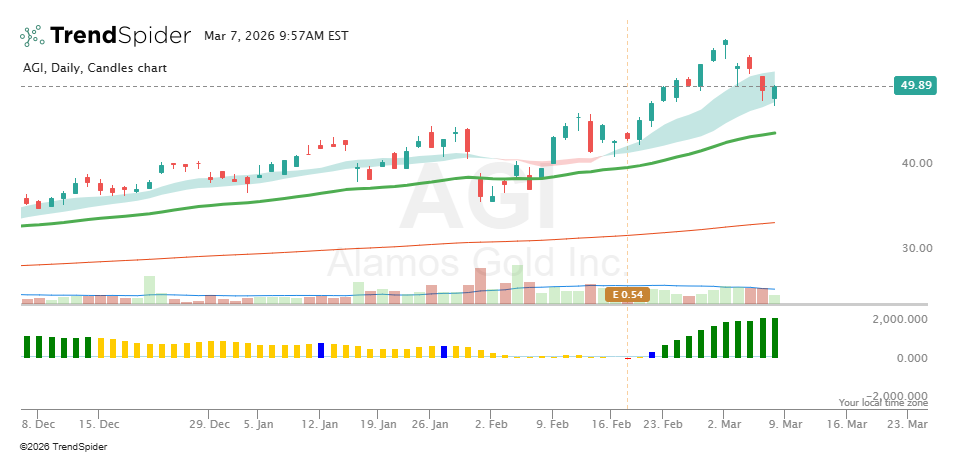
Close: $49.89 (+2.9%)
Volume: 2.9M (average)
The Context: Gold stock bouncing after pullback from $55 (Mar 2) to $47.50. This is a volatile precious metals name.
Technical:
Testing $50 resistance
Below all key MAs (20/50-day)
RSI: ~48
Entry Plan:
Only if gold metal continues higher
Trigger: Break above $52 with volume
Stop: $47
Target: $55
Risk: High - ATR ~8%. Size accordingly.
Earnings: None upcoming ✓
🏔️ Alamos Gold (AGI) — Big Picture Summary
Market Cap: ~$20.9B | Sector: Basic Materials / Precious Metals
📈 Price Action & Trend
AGI has been in a powerful multi-year uptrend.
The stock recently peaked around $55.40 (week of Mar 2, 2026) and has pulled back ~10% to the $49–50 area. This week’s candle (the current incomplete week) shows a bearish engulfing structure — opened at $54.88, sold down to $47.50, and is currently at $49.89. This is the first meaningful pullback in weeks.
Key price levels to watch:
$55–56: Recent all-time high resistance
$49–50: Current price / support being tested
$42–43: Prior consolidation / Jan 2026 highs — major support if $50 gives way
$38–40: Dec 2025 breakout zone — would represent a full round-trip of the recent leg
📊 Earnings — Explosive Growth
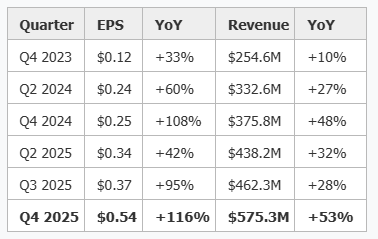
This is a best-in-class earnings growth story for a gold miner. Q4 2025 was reported Feb 18 and beat estimates by ~5% on EPS. Year-over-year EPS growth accelerating to +116% is exceptional — driven by gold prices at record highs plus volume growth. The revenue miss vs. estimates in recent quarters ($575M vs $594M estimated in Q4) is a mild concern worth watching.
One notable blemish: Q1 2025 was a sharp miss (-26% EPS surprise, -8% revenue surprise). This caused the Jan 30 selloff from $44 → $36 in a single day. Q2 and Q3 recovered convincingly.
🏗️ Business Highlights
Key news from 2026:
60% dividend hike (Feb 18): Raised quarterly dividend from $0.025 → $0.04/share — signals strong confidence from management
Mineral reserves +32% (Feb 17): FY25 proven & probable reserves increased to 15.9M oz gold — a major long-term positive
Island Gold Mine expansion to 20,000 TPD: +27% production increase expected, $12.2B NPV at $4,500/oz gold
Active exploration at Young-Davidson, Lynn Lake, Qiqavik, Cline-Pick — all reporting meaningful intercepts
AGI is growing both organically (exploration) and operationally (throughput expansions). This is not just a gold price leveraged play — there’s genuine operational execution behind it.
💵 Dividend
Dividend was held steady at $0.025/quarter throughout 2024–early 2025, then jumped to $0.04/quarter in Feb 2026 — a 60% increase. At current prices (~$50), annualized yield is modest (~0.32%), but the hike is a strong signal of management confidence in cash flow sustainability.
🔬 Analyst Sentiment
All recent ratings are Buy/Outperform. ScotiaBank has been the most active and bullish:
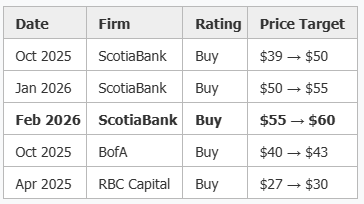
The $60 PT from ScotiaBank (set Feb 6) implies ~20% upside from current levels. No sell ratings visible. Notably, BofA was a “hold” in April 2025 but upgraded to buy by October — showing broadening bullish conviction.
⚡ Unusual Options Activity (Feb–Mar 2026)
Options flow is mixed but skewed bullish on net:
Large bullish flows: Apr’26 $50C, Apr’26 $60C, Jan’28 $40C sweeps
Notable bearish trades: Jan’28 $60P (large $162K+ trades on Mar 3 — high OI 1,343–1,357%), Mar’26 $45C sweep at bid
The Jan’28 $60 PUT with 1,343% OI and $162K+ premium is notable — someone is hedging or positioning bearishly with a long time frame
Net read: bulls are positioning for further upside but there’s meaningful hedging activity suggesting some smart money is protecting against a reversal from the $55–60 zone.
📉 Relative Performance vs. Sector
AGI has gone from the 33rd–38th percentile vs. same-sector peers in early Jan 2026 (slightly below average), to 53–55th percentile by late Feb/early March 2026 — it has been outperforming its sector peers as the recent gold rally kicked in. It’s not a dominant outperformer yet — merely moving with and slightly above the pack on a yearly basis.
⚠️ Key Risks to Watch
Gold price dependency: The entire earnings narrative is built on gold at/near record highs. A reversal in gold (stronger USD, rate expectations shift, dollar strength) directly compresses margins and the multiple
Recent selloff in gold-adjacent stocks (Mar 3–5 news) tied to stronger dollar and rising yields — this is already pressuring AGI from the $55 peak
Revenue misses: Even as EPS beats, revenue has been consistently missing estimates in recent quarters — gap between actual ops and analyst expectations worth monitoring
Q1 2025 precedent: That blowup miss shows AGI is not immune to quarterly misses even in a bull gold environment
Valuation/multiple expansion: Most of the move is multiples-driven as gold surged; if the narrative cools, the re-rating can be swift and brutal
🧭 Bottom Line
AGI is a high-quality gold miner in a structural bull move, backed by genuine operational improvements (reserve growth, mine expansions, earnings growth), strong analyst conviction, and the tailwind of record gold prices. The business is executing well.
The current pullback from $55.40 → $49.89 looks like first meaningful cooling after a parabolic run. The $49–50 zone is the immediate test — a hold here would be constructive; a break opens $42–43 as the next natural support.
The macro narrative (tariffs, geopolitical uncertainty, Fed independence concerns) remains supportive for gold broadly. Watch gold spot closely — AGI moves in near-lockstep with it.
🎯 ACTION PLAN FOR MONDAY (March 9)
Pre-Market
LHX - Watch if holds $365+
GRMN - Watch if holds $240+
GOLD - Is there momentum after holding 5,000 (AGI)
First 30 Minutes
Do we break yesterday’s high on above average volume and…